EV Sales, Charging, and Battery Trends in 2026
Global electric vehicle sales are projected to hit 23 million in 2026, capturing nearly 30% of the worldwide auto market as falling lithium-ion battery prices push the industry closer to upfront cost parity with gas-powered cars. However, adoption is heavily fractured: China is accelerating past a 50% domestic market share, while the United States remains stuck in the single digits, hampered by high interest rates and a severe public charging infrastructure deficit. Meanwhile, real-world fleet data confirms that modern battery degradation is largely a non-issue, shifting the industry's focus toward resolving localized grid strain and extreme cold-weather efficiency.
The Global EV Sales Landscape in 2026
The narrative surrounding electric vehicle (EV) adoption in 2026 is defined by stark regional divergence. Following a milestone year in 2025 - when global EV sales topped 20 million units for the first time, accounting for roughly one in four new passenger vehicles sold globally - the market has entered a mature, though highly uneven, phase of growth 1132.
The International Energy Agency (IEA) projects that worldwide EV sales will reach 23 million in 2026, representing about 28% of total global car sales 1347. BloombergNEF (BNEF) offers a slightly more conservative estimate of 22 million passenger EV sales (a 25% jump from 2024), having revised its short- and long-term forecasts downward primarily due to shifting policy environments and high interest rates in the United States 856. Despite these slight forecast variations, both institutions agree that the underlying momentum is undeniable: by the end of 2026, global EV fleets will displace an incremental 1 million barrels of oil demand per day compared to 2024 5.
However, looking at global averages obscures the true state of the market. The industry has effectively split into a multi-speed transition, where geography dictates the pace of electrification.
China's Outsized Dominance and Software Shift
China remains the undisputed center of gravity for both EV production and consumption. In 2025, Chinese automakers supplied nearly 60% of all electric cars sold worldwide, and domestic EV sales within China exceeded 13 million units, representing roughly 55% of all new vehicles purchased in the country 1132. Preliminary 2026 data shows Chinese market share frequently cresting above 60% 37.
This aggressive growth is driven by local supply chain supremacy, aggressive manufacturing scale, and targeted trade-in incentives - such as a 20,000 Chinese yuan (approximately $2,750) subsidy to trade in older internal combustion engine (ICE) vehicles 8. More importantly, China is the only large market where EVs are, on average, cheaper to purchase upfront than comparable ICE cars 89. Data indicates a notable trend where China is rapidly pulling ahead of global competitors; while the U.S. market share hovers in the single digits, China's domestic EV market comfortably crossed the 50% threshold in 2025 and continues to climb 38.
Beyond hardware, China is leading the transition toward Software-Defined Vehicles (SDVs). The IEA notes that the true architectural shift in 2026 is not just electrification, but the integration of centralized software systems capable of over-the-air (OTA) updates for battery thermal management and autonomous driving. Chinese OEMs are increasingly exporting these highly integrated platform vehicles, rather than just physical cars, placing immense competitive pressure on legacy automakers worldwide 1.
The European Rebound and the U.S. Slowdown
Europe sits in the middle of the transition curve. Rebounding from relative stagnation, European EV sales grew by over 30% in 2025, reaching 4.2 million units to capture a 28% market share 128. Within the European Union, 24 of 27 member states saw their EV sales share increase 2. This growth is heavily supported by stringent EU CO2 emission regulations and sustained policy support 12. The United Kingdom has emerged as a particularly strong market outside the EU, with BNEF predicting that EVs will make up 40% of all UK car sales by the end of 2026, driven by a Zero Emission Vehicle mandate requiring 22% of new registrations to be zero-emission 814.
In stark contrast, the United States is navigating a visible slowdown. U.S. EV market share lingered in the high-single digits (around 8% to 10%) throughout 2024 and 2025 38. U.S. growth decelerated sharply in late 2025 and early 2026, hampered by high interest rates, the expiration or modification of federal tax credits under the Inflation Reduction Act, and a strong domestic preference for large SUVs and trucks 334815. According to the IEA, more than 85% of electric models available in the U.S. are large vehicles or SUVs, which require massive, expensive battery packs that push upfront costs out of reach for average consumers 46.
The Rise of Emerging Markets
While the U.S. market adjusts, emerging economies are rapidly accelerating, often fueled by geopolitical energy shocks. Following oil shipment disruptions in the Middle East that pushed petrol prices higher, EVs became an increasingly attractive economic proposition 47. In 2025, EV sales outside of China, Europe, and the U.S. reached a record 2 million units, an 80% increase for emerging markets and developing economies 24.
Southeast Asia saw sales more than double, led by Thailand, Indonesia, and Vietnam, largely supported by an influx of affordable Chinese export models 2. Similarly, EV sales in Mexico tripled in 2025 - with plug-in hybrids increasing sevenfold - and Latin America broadly is projected to see a 45% increase in EV adoption in 2026 23.
| Region | Est. 2025 EV Market Share | 2026 Market Dynamics & Key Drivers |
|---|---|---|
| China | ~55% - 60% | Sustained dominance; driven by local supply chains, upfront price parity with gas vehicles, and a vast selection of affordable models under $10,000 32816. |
| Europe (including UK) | ~28% | Steady volume growth; heavily driven by EU fleet emission mandates, corporate subsidies, and expanding model availability 128. |
| United States | ~8% - 10% | Decelerating growth; hampered by public charging gaps, high interest rates, policy uncertainty, and high MSRPs for large electric SUVs 34815. |
| Emerging Markets | < 5% | Rapid acceleration (50%+ growth); fueled by volatile fossil fuel prices and the widespread importation of affordable Chinese vehicles 2347. |
Battery Chemistry and Falling Costs
The primary bottleneck for global EV adoption has historically been the upfront cost of the vehicle, which is dictated almost entirely by the battery pack. In 2025 and 2026, the industry passed a critical threshold in battery economics, driven by overcapacity and a shift in fundamental chemistry.
The Lithium-Ion Price Collapse
According to BloombergNEF's annual battery price survey, the volume-weighted average price for lithium-ion battery packs dropped to $108 per kilowatt-hour (kWh) in late 2025, an 8% year-over-year decline 910. Analysts expect this downward trajectory to continue, with Goldman Sachs forecasting that global average pack prices will fall to roughly $111/kWh in early 2026, eventually reaching $80/kWh by the end of the year 11.
The $80/kWh mark is a highly anticipated industry milestone: at this price point, battery electric vehicles generally achieve upfront ownership cost parity with gasoline-fueled cars on a strictly unsubsidized basis 11.
However, these costs vary wildly by region. In 2025, average battery pack prices were lowest in China at $84/kWh. Pack prices in North America and Europe were 44% and 56% higher, respectively, reflecting higher localized manufacturing costs, supply chain immaturity, and reliance on imported components subjected to new tariffs 10.
LFP vs. NMC: The New Chemistry Standard
This global price collapse is not just a result of manufacturing scale; it is driven by a fundamental transition in cell chemistry 919. Automakers are rapidly shifting away from Nickel Manganese Cobalt (NMC) batteries. While NMC offers high energy density (more range per pound), it requires expensive, volatile, and geopolitically sensitive metals 1912.
Instead, the market is overwhelmingly embracing Lithium Iron Phosphate (LFP) chemistry. By early 2026, LFP cells were priced between $60 and $80 per kWh, significantly cheaper than the $80 to $100 per kWh commanded by NMC cells 1019. Beyond cost, LFP relies on abundant iron rather than controversial cobalt, boasts a remarkably long cycle life (often exceeding 6,000 cycles), and is highly resistant to thermal runaway, making it structurally safer 1921.
While LFP batteries typically hold less energy density than NMC equivalents, their cost-efficiency allows automakers to produce affordable, standard-range vehicles that cater to the mass market. In 2023 and 2024, LFP battery deployments grew by over 110%, driven heavily by Chinese manufacturers like CATL and BYD, who dominate the LFP supply chain 1021.
Solid-State Batteries: Moving to Pilot Production
While LFP dominates the current mass market, Solid-State Batteries (SSBs) remain the highly anticipated future. SSBs replace the flammable liquid or gel electrolyte found in conventional lithium-ion batteries with a solid material, such as ceramics, sulfides, or solid polymers 1314. This architecture promises to eliminate fire risks, enable lightning-fast charging (from empty to full in minutes), and unlock significantly higher energy densities 131424.
The year 2026 marks a tangible transition from laboratory prototypes to pilot production for SSBs, though mass commercialization at scale remains years away. In February 2026, California-based QuantumScape inaugurated its "Eagle Line," a highly automated pilot facility utilizing a proprietary "Cobra" separator process to produce anode-free lithium-metal cells for automotive customer testing 131415. Concurrently, Factorial Energy launched a U.S. passenger vehicle pilot program for its polymer-based quasi-solid cells, which maintain compatibility with existing factory equipment 1315.
Legacy automakers are also aggressively pursuing the technology. Toyota, which holds the most patents in the SSB space, has verified plans with the Japanese government to launch limited production of a sulfide-based solid-state vehicle between 2027 and 2028 132426. Toyota's first-generation pack targets a 621-mile (1,000 km) range and a 10-to-80% charge time of under 10 minutes 1324. Similarly, Samsung SDI is operating a pilot line in South Korea and targeting 2027 for the mass production of all-solid-state cells in a partnership with BMW and Solid Power 13.
Despite these milestones, experts urge calibrated expectations. SSBs require pristine, moisture-free manufacturing environments and extreme engineering tolerances that are phenomenally expensive to replicate at scale 1526. Industry analysts from Gartner note that due to these high initial costs and difficult production ramp-ups, SSBs will likely be restricted to low-volume, ultra-premium luxury EVs through the end of the decade 15.
Real-World Battery Health: Degradation and Winter Range
Consumer hesitation regarding EVs often centers on two anxieties: how fast the battery will permanently degrade, and how the vehicle will perform in freezing temperatures. Extensive real-world data collected through 2025 and 2026 provides clear, and sometimes surprising, answers.
What Real-World Data Says About Degradation
The notion that an EV battery must be replaced every few years is not supported by massive fleet data. A January 2026 study by Geotab, which analyzed over 22,700 EVs across 21 models, found that the average annual battery degradation rate is 2.3% 1628. At this rate, a standard EV battery will still retain approximately 81.6% of its original capacity after eight years of use 28.
Separate large-scale diagnostic studies corroborate this. Generational's 2025 Battery Performance Index, which analyzed 8,000 used electric vehicles across 36 manufacturers, found that 8-to-9-year-old vehicles consistently retain a median of 85% capacity 2930. Even high-mileage EVs exceeding 100,000 miles frequently returned a State of Health (SoH) between 88% and 95% 2930. Consequently, modern EV batteries are generally expected to last 15 to 20 years (150,000 to 300,000 miles), comfortably outlasting the chassis of the vehicle itself 2817. Furthermore, battery replacement rates for modern EVs are exceedingly low; data suggests that only about 2.5% of all EVs have ever required a full battery replacement 28.
The Hidden Cost of High-Power Fast Charging
However, the Geotab data revealed a vital caveat: how a driver charges the vehicle matters immensely. The 2026 average degradation rate of 2.3% is actually an increase from the 1.8% rate observed in Geotab's 2024 findings 1628. This uptick is directly attributed to the increasing reliance on high-power DC fast charging.
Vehicles that frequently utilize DC fast chargers (above 100 kW) experience accelerated degradation of up to 3.0% per year - roughly double the degradation rate (1.5%) of EVs that rely primarily on slower Level 1 or Level 2 AC home charging 1628. The underlying culprit is thermal stress; forcing massive amounts of direct current into a battery generates extreme heat, which gradually breaks down the cell chemistry over time. Similarly, EVs operated in consistently hot climates degrade about 0.4% faster per year than those in temperate zones, confirming that heat is the primary enemy of long-term battery health 1628.
The "Cold Cliff": EV Winter Performance
While heat drives long-term degradation, freezing temperatures are the primary enemy of daily efficiency. Independent winter testing in 2026 confirms that EVs lose between 20% and 40% of their rated range when temperatures drop well below freezing (e.g., 20°F / -7°C) 321819.
This acute range loss is due to two factors. First, cold temperatures increase the internal resistance of lithium-ion cells, preventing them from discharging energy efficiently 3520. Second, and more importantly, EVs lack the ambient waste heat generated by a combustion engine. To keep the cabin warm, an EV must draw heavily from the battery. Traditional resistive heaters found in older or budget EVs can draw up to 7 kW of continuous power just to maintain cabin temperature - the equivalent of running several space heaters on the hood while driving down the highway 20.
Automakers are mitigating this "cold cliff" by integrating advanced heat pumps, which act like reversible air conditioners to scavenge ambient heat and warm the cabin highly efficiently 3520. Additionally, pre-conditioning the battery - warming it using grid power while the car is still plugged in at home - vastly improves cold-weather performance and prevents sluggish fast-charging speeds at public stations 35.
Notably, internal combustion and hybrid vehicles are not immune to thermal efficiency losses. A 2026 AAA dynamometer study testing three hybrids and three EVs found that hybrids experience a 23% reduction in fuel economy in freezing temperatures, proving that extreme weather penalizes all drivetrains, even if the impact is more acutely felt on an EV's digital range estimator 1819.
The Public and Private Charging Infrastructure Gap
If battery technology is the industry's greatest triumph in 2026, charging infrastructure is its most glaring vulnerability. While EV adoption has scaled rapidly, the physical networks required to keep them moving have struggled to keep pace, creating distinct challenges for both home and public charging.
The Global Charging Divide
The global deployment of chargers mirrors the asymmetry of EV sales. China leads the world comprehensively, boasting over 4.86 million public charging stations by early 2026 - roughly 60 times the public count in the United States 372139. Europe has also maintained a steady deployment pace, crossing 1.17 million charge points in Q1 2026, with ultra-fast charging now covering 77% of the EU's motorway network 37.
The United States, conversely, faces a severe infrastructure deficit. As of April 2026, the U.S. had only 81,418 public charging stations containing roughly 250,000 individual ports 37. Growth in U.S. station deployment has slowed drastically, dropping from a 61% surge in 2021 to a mere 7% in 2025 37. Furthermore, U.S. infrastructure is heavily concentrated geographically; California alone houses 26.3% of the nation's public chargers, leaving vast rural gaps across the Midwest and South 3740. ChargePoint data from 2025 indicated that while their enabled charging sessions grew by 34%, new port installations only grew by 16%, leading to increased utilization bottlenecks 22.
Home Charging: Costs and Satisfaction
Despite the focus on public networks, 86% of typical EV charging in the U.S. happens at home 2324. However, the J.D. Power 2026 U.S. Electric Vehicle Experience (EVX) Home Charging Study revealed a slight decline in home charging satisfaction, driven primarily by rising electricity costs 2344.
In 2026, EV owners spent an average of $63 per month on home charging, up $5 from the previous year 2324. This average masks sharp regional disparities: owners in New England paid the most at $99 monthly (resulting in the lowest cost satisfaction score of 552 out of 1,000), while owners in the Mountain region paid just $36 2324.
Satisfaction is heavily dependent on the hardware used. Permanently mounted Level 2 home chargers yielded the highest satisfaction score (733 out of 1,000), despite reporting the highest rate of mechanical problems 2324. Portable Level 1 chargers, which plug into standard wall outlets and charge very slowly, scored a dismal 569 2344.
Public Charging Reliability and the "Uptime" Mandate
In the public sphere, consumer sentiment is a mix of frustration and measured improvement. According to the J.D. Power 2025 U.S. EVX Public Charging Study, overall satisfaction with DC fast chargers dropped 10 points to 654 (out of 1,000), and public Level 2 satisfaction dropped 7 points to 607 4525. Much of this dissatisfaction stems from the rising cost of commercial electricity and confusing payment gateways 4525.
Paradoxically, while satisfaction dropped, actual reliability improved. The percentage of "non-charging visits" (situations where a driver arrives at a station but is unable to charge due to broken equipment or software failures) dropped to 14%, the lowest level in four years 4525.
This improvement is largely driven by stricter federal mandates, such as the U.S. National Electric Vehicle Infrastructure (NEVI) program's requirement that federally funded stations maintain a verifiable 97% uptime per port 4526. This has spurred a massive shift toward Regulatory Technology (RegTech) software that automatically tracks outage durations down to the minute for quarterly audits 26. Furthermore, Tesla's Supercharger network continues to dominate the U.S. market in both volume (holding a 52.2% share of all DC fast ports) and customer satisfaction, prompting almost all major automakers in North America to adopt Tesla's North American Charging Standard (NACS) connector natively by 2026 372548.
Megawatt Charging for Heavy-Duty Transport
While passenger vehicles transition to NACS, heavy-duty logistics requires entirely different architecture. In 2026, the Megawatt Charging System (MCS) standard moved into series production 26. Designed for commercial trucks and buses, MCS delivers power levels up to 3.75 MW - roughly ten times faster than current CCS standards 26. This allows a heavy-duty electric truck to charge from 20% to 80% in under 30 minutes, fitting perfectly into a commercial driver's legally mandated rest breaks 26. However, deploying MCS requires specialized liquid-cooled connectors handling over 1,000 amps, placing unprecedented point-load stress on local utility grids 26.
Grid Strain and Smart Energy Management
As EV adoption scales, the impact on the electrical grid has moved from a theoretical concern to an immediate operational challenge for utilities. The primary bottleneck is not generating enough total electricity at the power plant level, but rather delivering it safely through local neighborhood distribution networks.
The Threat to Distribution Transformers
The weakest links in the modern power grid are distribution transformers - the metal cylinders mounted on residential utility poles or the green utility boxes sitting on suburban lawns that step down high-voltage power for household use 492751. These transformers were sized and installed decades ago based on the expected load of standard appliances like lights, refrigerators, and air conditioners.
A standard Level 2 home EV charger draws between 7 kW and 11 kW of continuous power. Charging an EV at home is roughly equivalent to running an entire house's central air conditioning unit at maximum capacity for six to eight hours straight 4928. When multiple EVs in a single neighborhood plug in simultaneously after work (typically between 5:00 PM and 8:00 PM), the concentrated thermal load causes these transformers to overheat.
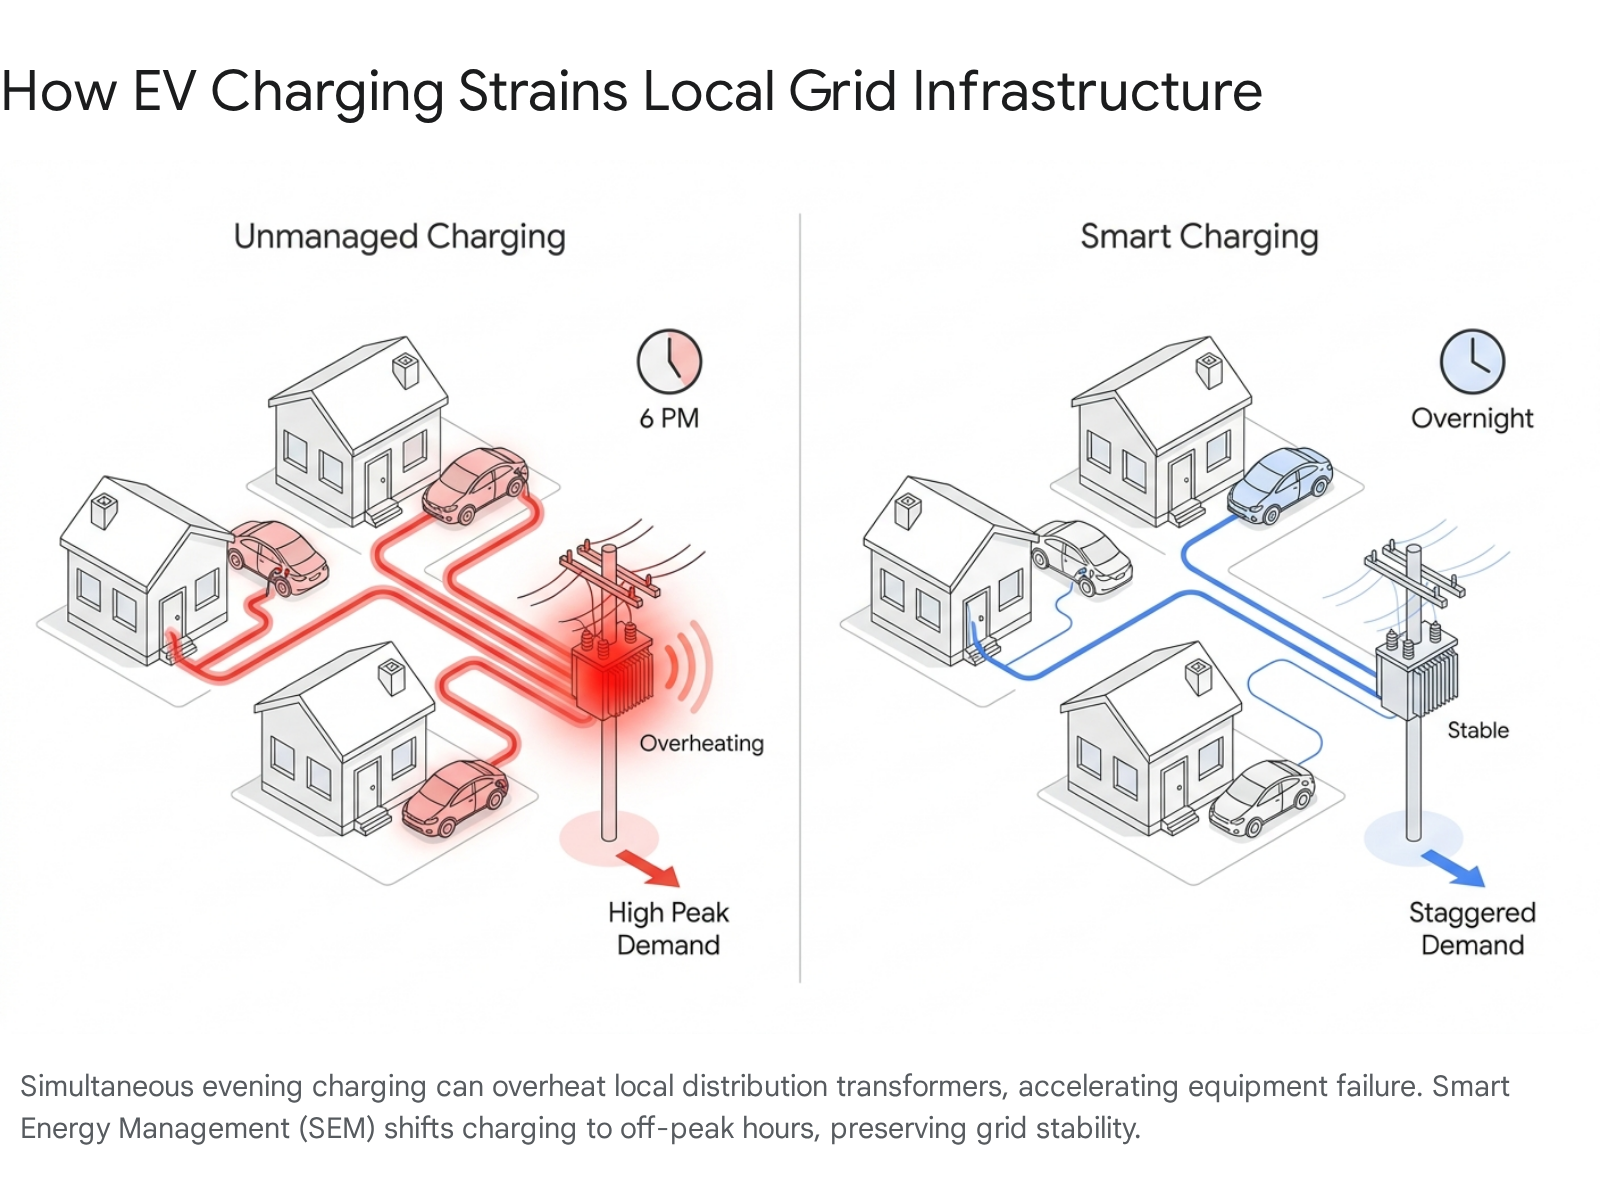
Academic simulations conducted for 2025 and 2026 show that under severe, unmanaged heavy charging loads, a distribution transformer's structural life loss can accelerate from 16.23 minutes per day to over 631.53 minutes per day, drastically increasing the risk of insulation failure, localized blackouts, and premature replacement costs 2829. A recent high-resolution study mapping the grid in California estimated that by 2045, 67% of the state's local feeders will require capacity upgrades to handle EV loads, representing an infrastructure cost of up to $20 billion in that state alone 2754.
Smart Energy Management (SEM) and Load Shifting
To avoid trillions of dollars in global grid upgrades, utilities are urgently deploying AI-driven Smart Energy Management (SEM) software and aggressive Time-of-Use (ToU) tariffs 493031.
Because the average personal vehicle sits parked 90% of the time, the charging load is highly flexible 57. By financially incentivizing drivers with cheaper electricity rates to schedule their charging for 2:00 AM instead of 6:00 PM, or by using software to throttle charging speeds dynamically based on real-time neighborhood grid capacity, utilities can smooth the demand curve 235131. A 2026 analysis conducted by the National Laboratory of the Rockies for Xcel Energy demonstrated that grid-aware active SEM could satisfy over 94% of residential charging sessions without triggering a single transformer overload, entirely negating the need for expensive hardware upgrades on studied feeders 31.
Despite the clear benefits to both the grid and the consumer's wallet, adoption of these tools lags. According to J.D. Power, only 38% of U.S. EV owners "always" schedule their home charging 24. Among owners who do schedule charging during off-peak hours, monthly electricity costs averaged $65, compared to $71 for those who never schedule 2344. Furthermore, only 12% of EV owners participate in utility smart charging programs, leaving massive grid flexibility untapped and putting unnecessary strain on distribution networks 2444.
Closing the Loop: The Push for EV Battery Recycling
As the first major wave of modern mass-market EVs (built in the 2010s) begins to reach the end of their operational lifespans, the industry faces an influx of retired lithium-ion battery packs 123259. Consequently, 2025 and 2026 have seen rapid advancements in battery recycling policies and technologies to ensure critical minerals are recovered and reintegrated into the supply chain.
Recovery Rates and Regulatory Mandates
Regulatory frameworks are increasingly forcing automakers to transition from a linear supply chain to a circular economy. The European Union's comprehensive Battery Regulation mandated strict recycling efficiency targets that had to be met by December 31, 2025. This regulation required recyclers to achieve a 65% overall efficiency rate for lithium-based batteries, escalating to 70% by 2030 33. Furthermore, by 2027, the EU will legally require specific material recovery rates: 90% for cobalt, copper, and nickel, and 50% for lithium 33. The UK has implemented similar Extended Producer Responsibility (EPR) schemes that impose financial penalties on automakers failing to demonstrate material recovery 59.
Technologically, the global recycling sector is advancing rapidly, though performance varies by region. Studies published in 2025 show that the United States, driven by private sector innovations in direct recycling and AI-based battery sorting, has achieved an impressive 95% resource recovery efficiency rate from end-of-life batteries 32. However, the U.S. struggles significantly with logistics and collection, successfully recycling only about 35% of eligible retired packs 32.
Conversely, China utilizes aggressive EPR mandates and digital recycling "passports" embedded in battery packs (which record chemistry, cycle count, and disassembly instructions) to achieve a 40% formal collection rate, paired with a 90% material recovery efficiency 3259.
Technological Innovations in Recycling
While traditional hydrometallurgical processes (which use acid baths to extract metals) have successfully pushed cobalt and nickel recovery efficiencies past 90%, recovering lithium remains technically challenging, often hovering between 70% and 85% efficiency due to its dispersion in electrode materials 12.
To combat this, the industry is investing in "direct cathode regeneration." This emerging process repairs the crystalline structure of degraded battery materials without breaking them down entirely into raw elemental sludge 32. Experts project that direct recycling could increase recovery efficiency by an additional 20% to 30%, significantly reducing the lifecycle costs of new batteries 32. As these advanced processes scale globally, research from the Union of Concerned Scientists projects that recycled materials could offset the need for newly mined lithium by nearly half (48%) by 2050, drastically reducing the geopolitical, financial, and environmental impacts of the transportation energy transition 34.
Bottom line
The electric vehicle landscape in 2026 is characterized by cheaper, longer-lasting batteries, but highly unequal global infrastructure. While China accelerates toward total market dominance and battery pack prices plunge toward upfront parity with gas vehicles, the U.S. is temporarily stalled by a frustrating public charging network and high vehicle prices. Ultimately, data proves that modern EV batteries will easily outlast the vehicles they power, but overcoming localized grid transformer strain and extreme winter efficiency losses will require smarter, heavily integrated energy management networks, not just better cars.