How the US Electricity Grid and Energy Transition Work
The United States power grid is currently undergoing its most radical transformation in a century, driven by a sudden, massive surge in electricity demand from commercial data centers and the broader electrification of the economy. To maintain reliability, the grid is rapidly shifting away from legacy coal generation toward a complex portfolio of natural gas, utility-scale solar, and wind, though its aging physical transmission infrastructure struggles to keep pace with this decentralized capacity. Complicating matters further, recent federal legislation - specifically the One Big Beautiful Bill Act of 2025 - has drastically altered the financial incentives for renewable development, triggering a frantic race among developers to build new generation and battery storage before critical tax credits expire.
The Anatomy of the Machine: How the Grid Actually Operates
To comprehend the scale of the energy transition, one must first understand the physical and economic architecture of the grid. The electric grid is not a storage tank; it is a dynamic, real-time delivery system. Electricity must be consumed at the exact millisecond it is generated to maintain the grid's precise 60-hertz frequency 12. If demand outstrips supply, or if supply suddenly spikes without corresponding demand, the frequency deviates, equipment fails, and grid operators are forced to initiate rolling blackouts to prevent catastrophic physical damage to the infrastructure.
Generation, Transmission, and Distribution
The architecture of the grid is frequently compared to a national road network, divided into three distinct phases of operation 134.
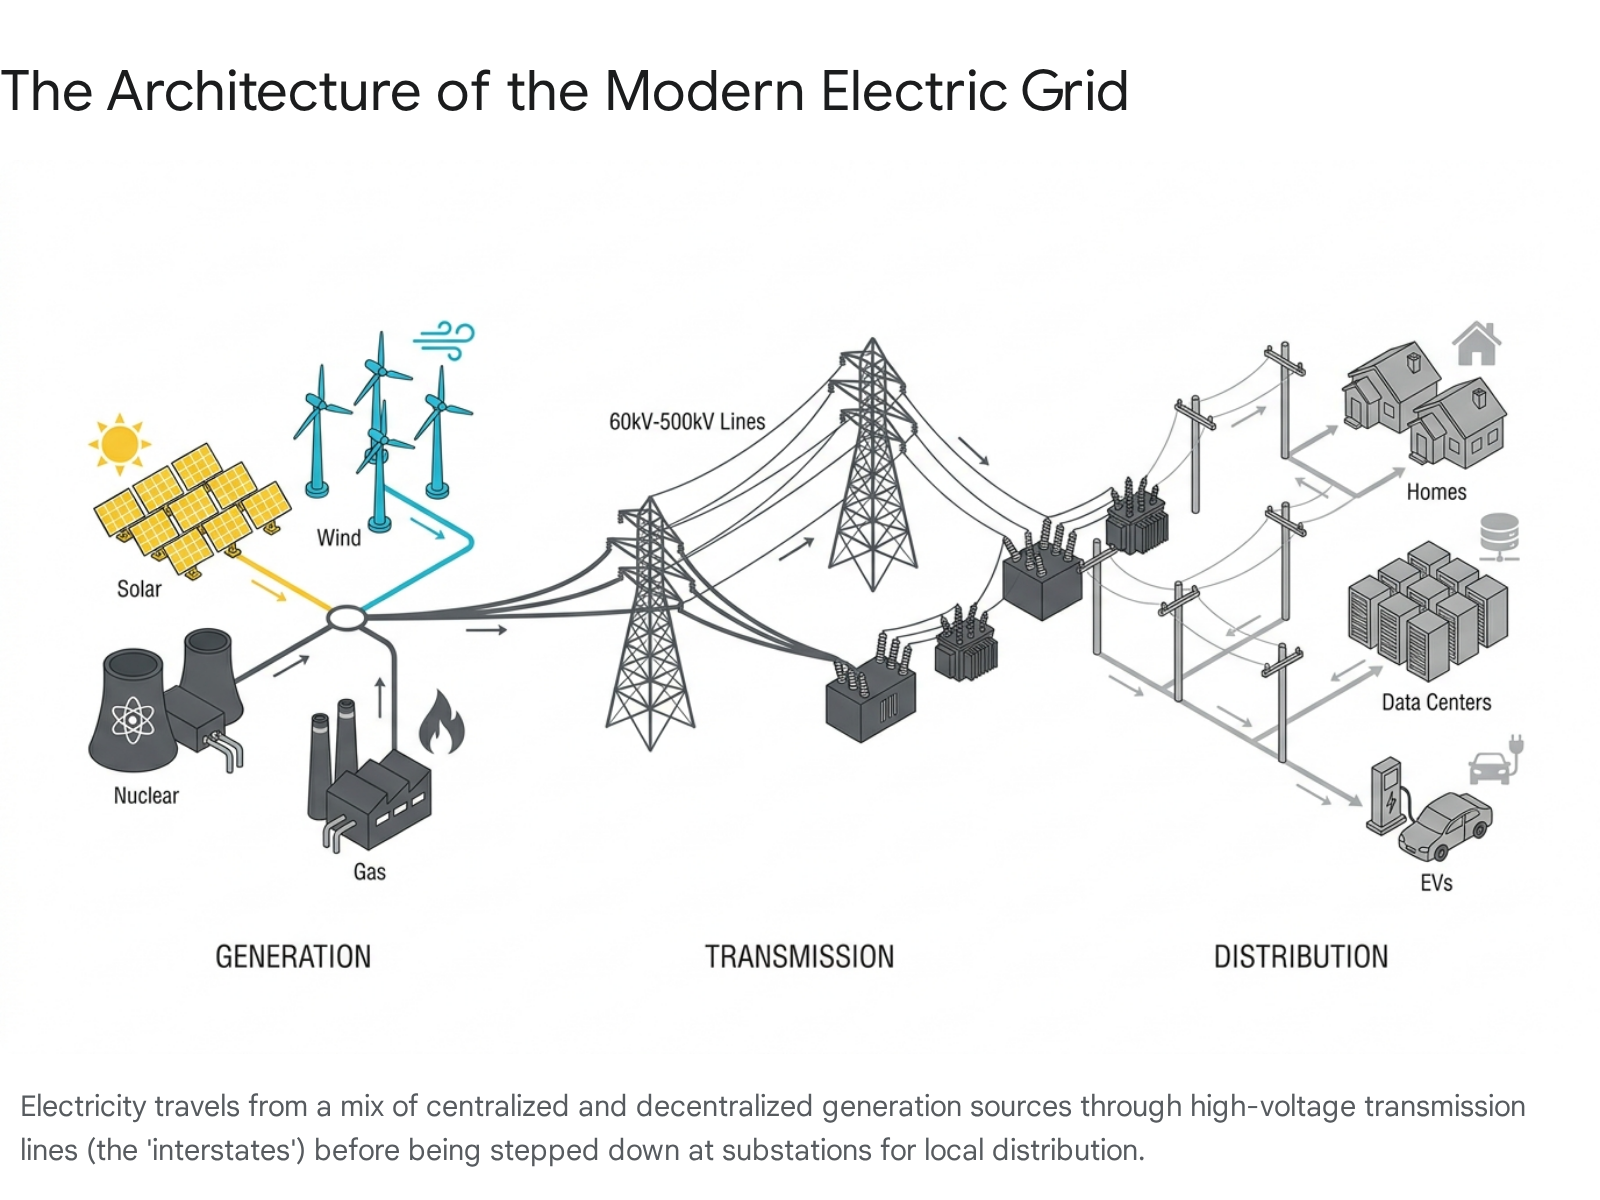
The first phase is generation, where power plants act as the factories producing electricity. Historically, these were massive, centralized facilities such as coal, nuclear, or hydroelectric plants built near fuel sources or major waterways. Today, the generation fleet increasingly includes decentralized, inverter-based resources (IBRs) like wind farms and utility-scale solar arrays dispersed across rural landscapes 5.
The second phase is transmission. Once electricity is generated, substations step up its voltage to extreme levels - typically between 69 kilovolts and 500 kilovolts - so it can travel vast distances with minimal energy loss due to heat 14. These high-voltage lines represent the interstate highways of the power grid, supported by massive steel lattice towers and traversing state lines.
The final phase is distribution. When the high-voltage power approaches a population center, local step-down substations reduce the voltage to safer levels. The power then travels along lower-voltage distribution lines - the local city roads - to individual homes, commercial businesses, and industrial facilities 13.
Currently, the United States relies on a sprawling transmission network consisting of over 600,000 miles of high-voltage lines, but the physical state of this network is precarious. Over 70% of these lines are more than 25 years old, nearing the end of their engineered lifespans 67. The American Society of Civil Engineers recently gave this infrastructure a D+ rating, highlighting the urgent need for modernization as the geographic locations of power generation shift from historic coal basins to sun-drenched deserts and windy plains 3.
The Three Interconnections and Wholesale Markets
Despite frequently being referred to in the singular as the "national grid," the contiguous United States is actually divided into three distinct, highly independent networks known as interconnections 23. These interconnections function predominantly independently of one another, with only limited, specialized exchanges of power passing between them.
The Eastern Interconnection is the largest grid, covering the area from the Great Plains eastward to the Atlantic coast, excluding most of Texas 2. The Western Interconnection covers the sprawling, geographically diverse area west of the Rocky Mountains and the Great Plains to the Pacific coast 2. Finally, the Electric Reliability Council of Texas (ERCOT) covers roughly 90% of the state of Texas. ERCOT intentionally operates as an electrical island to largely avoid federal oversight and regulation from the Federal Energy Regulatory Commission (FERC) 29.
Within these vast interconnections, the grid's daily operations are managed by regional balancing authorities, most notably Regional Transmission Organizations (RTOs) and Independent System Operators (ISOs). Entities such as PJM in the Mid-Atlantic, the Midcontinent Independent System Operator (MISO) in the Midwest, the California Independent System Operator (CAISO), and the Southwest Power Pool (SPP) act as the air traffic controllers of the power sector. They operate highly complex wholesale electricity markets where generators bid to provide power on a day-ahead and real-time basis, utilizing Locational Marginal Pricing (LMP) algorithms to dispatch the cheapest available power while mathematically ensuring that physical transmission constraints are not violated 211.
Why Is US Electricity Demand Suddenly Surging?
For an astonishing 14-year period between 2008 and 2021, United States electricity demand remained effectively flat, averaging an annual growth rate of just 0.1% 124. This era of stagnation was a remarkable triumph of systemic energy efficiency. The widespread consumer adoption of LED lighting, Energy Star-rated appliances, and enhanced building insulation codes successfully offset the new electricity load added by a growing population and a proliferation of consumer electronics 1214. Utilities grew accustomed to planning for a system where overall load profiles were predictable and static.
That era of predictability is now definitively over.
In 2024, US electricity demand suddenly surged by 3.0%, marking one of the highest percentage jumps this century 124. By the end of 2025, total net electricity generation reached an all-time record of 4.43 thousand terawatt-hours (TWh), representing an additional 2.8% increase over 2024 16. According to the US Energy Information Administration (EIA), retail sales of electricity to ultimate customers increased across all major sectors in 2025, with residential sales rising by 2.2%, commercial sales by 2.9%, and industrial sales by 0.7% . Forecasters project this demand will continue to hit successive record highs, fundamentally altering how utilities and RTOs must plan for resource adequacy in 2026 and 2027 18.
The Arrival of Artificial Intelligence and Data Centers
The commercial sector is currently experiencing historic, localized load growth driven primarily by the generative artificial intelligence (AI) boom. AI training and inference require computing power that consumes immensely more electricity than traditional cloud storage and web hosting. The construction of new, hyperscale data centers - alongside the concurrent rise in cryptocurrency mining operations - is forcing grid planners to radically revise their demand forecasts upward 691920.
This demand is not evenly distributed across the country. It is highly concentrated in regions with favorable tax policies, land availability, and fiber-optic infrastructure. For example, the EIA expects the highest load growth to occur in the ERCOT and PJM regions, where forecast growth of annual electricity load is expected to average 10% and 3%, respectively, between 2025 and 2027 . In the West, the Western Electricity Coordinating Council (WECC) recently reported that due to massive expansions of data centers and manufacturing, annual demand is forecast to grow an astonishing 20.4% over the next decade, more than double the growth forecast just two years prior 20.
The Electrification of the Economy
Simultaneously, policies aimed at deep economic decarbonization have accelerated the adoption of electric vehicles (EVs) and electric heat pumps. This trend represents a structural shift of energy consumption away from direct fossil fuel combustion - such as burning gasoline in internal combustion engines or combusting natural gas in home furnaces - and transferring that exact energy requirement directly onto the electric grid 671219. While this improves overall thermodynamic efficiency and reduces localized emissions, it requires the grid to deliver significantly more total terawatt-hours, further straining local distribution networks.
Industrial Reshoring and Manufacturing
Adding a third layer to the demand surge is a profound shift in industrial policy. The construction of massive new domestic manufacturing facilities - particularly gigafactories for lithium-ion batteries, semiconductor fabrication plants, and clean energy component assembly lines - has reversed a decades-long trend of declining or stagnant industrial electricity use in the United States 16. The EIA notes that beyond manufacturing, the industrial sector's demand is also rising due to the increasing electrification of operations within the oil and natural gas extraction sectors 22.
What Powers the United States Today?
To meet this surging, multi-front demand, the United States relies on a rapidly shifting portfolio of energy generation sources. While public discourse often frames the energy transition as a simple, linear battle between fossil fuels and green energy, the physical reality involves a highly complex interplay of commodity economics, state policy, federal tax law, and grid physics.
An analysis of the decadal shift in the US electricity generation mix reveals a dramatic crossover. While coal accounted for roughly 39% of total generation in 2014, it fell precipitously to just 15% by 2024. Conversely, combined renewable sources steadily climbed, ultimately surpassing coal for the first time in 2024 to become the second-largest energy source, while natural gas maintained its dominant share, fluctuating around 40% to 43% of the total mix.
Natural Gas: The Dispatchable Backbone
Natural gas remains the undisputed heavyweight champion of the US power grid. In 2024, natural gas accounted for roughly 43% of all US electricity generation 124. While its total market share experienced a slight percentage decline to approximately 40% in 2025 due to a massive influx of new renewable capacity coming online, the absolute consumption of natural gas for power generation remains near historic highs in sheer volume 1618.
The dominance of natural gas is a relatively recent phenomenon, born primarily from the hydraulic fracturing (fracking) boom of the 2010s, which unlocked vast, inexpensive domestic shale gas reserves. Combined-cycle natural gas power plants are highly prized by grid operators because they provide firm, "dispatchable" power. Unlike the sun or the wind, gas plants can be turned on, turned off, or ramped up and down quickly to precisely match fluctuating consumer demand 23. In regions experiencing acute demand shocks from data centers, such as PJM and ERCOT, utilities are planning significant additions of new natural gas generation to satisfy the rigid 24/7 power requirements of these facilities, with gas generation in ERCOT projected to increase 23% between 2025 and 2027 22.
The Terminal Decline of Coal
The rise of inexpensive domestic natural gas, combined with subsidized renewable energy and tightening environmental regulations, has devastated the economics of coal-fired electricity. In 2014, coal was responsible for roughly 39% of the electricity generated in the United States, operating as the undisputed baseload power source 24. A mere decade later, in 2024, coal's share had plummeted to an all-time low of 15% 124.
While a slight rebound to 17% occurred in 2025 - driven primarily by winter cold snaps that drove up natural gas prices and necessitated emergency coal dispatch - the long-term trajectory is a structural, terminal decline 18. Forecasters at the EIA expect that ongoing scheduled plant retirements will lead to US coal-fired generation declining by an average of 5% annually over the next two years, driving its share back down to 15% by 2027 . As solar generation floods the market during daytime hours, it increasingly displaces coal, rendering aging coal plants uneconomical to operate or maintain 45.
The Ascendance of Wind and Solar Power
The most profound and visible shift in the modern grid is the rapid expansion of zero-marginal-cost renewable energy. In a historic milestone, wind and solar combined produced 17% of US electricity in 2024, surpassing coal generation for the very first time 45. When factoring in conventional hydropower, biomass, and geothermal energy, total renewable generation accounted for roughly 25% of the national mix in 2024 12. While the percentage share hovered around 24% to 26% into 2025 and 2026 due to the denominator effect of massive overall demand growth, the absolute volume of renewable terawatt-hours continues to expand aggressively 18.
Solar power, in particular, is undergoing global exponential growth. Between 2015 and 2025, global solar generation expanded more than tenfold, and by 2025 it was responsible for meeting 75% of the net rise in global electricity demand 6. Domestically, the US grid added a record 36 gigawatts (GW) of new solar capacity in 2024 alone, representing a staggering 81% of all new power capacity added to the grid that year 4. Much of this expansion is heavily concentrated in sun-drenched states; Texas recently surpassed California in total utility-scale solar capacity, adding a nation-leading 7.4 GW in the first nine months of 2025 alone 94.
Wind generation has grown at a steadier pace, consistently accounting for roughly 10% of total US electricity generation 12427. However, because wind and solar are fundamentally "variable" or "intermittent" resources - meaning they only generate power when meteorological conditions allow - integrating them into a grid that demands perfect, second-by-second reliability presents unprecedented engineering and market design challenges 728.
The Stagnation of Nuclear Power
Nuclear power currently provides approximately 18% of US electricity, serving as the nation's largest single source of zero-carbon baseload power 124. Unlike variable wind or solar, nuclear plants run continuously, nearly 24 hours a day, 7 days a week, providing critical grid inertia and voltage support.
However, the commercial nuclear industry has largely stagnated over the last two decades. Building new conventional nuclear plants in the US has proven prohibitively expensive and plagued by decade-long regulatory and construction delays. In fact, only three new commercial reactors have come online in the US since 1998, with the recent completion of Vogtle Units 3 and 4 in Georgia providing a minor bump to nuclear output 4. Instead of attempting to build new mega-projects, the industry is increasingly focused on extending the operating licenses of existing reactors, pursuing capacity "uprates" to squeeze slightly more megawatt output from old infrastructure, and exploring the unprecedented restart of recently decommissioned facilities, such as the Palisades power plant in Michigan 429.
A Snapshot of the US Electricity Mix
To quantify the velocity of these market changes, it is useful to examine the raw percentage breakdown of how the United States generated its electricity across the past decade, highlighting the structural displacement of coal by gas and renewables.
| Energy Source | 2014 Share 24 | 2024 Share 124 | 2025 Share (Est.) 41618 | Market Trend & System Outlook |
|---|---|---|---|---|
| Natural Gas | ~27% | 43% | 40% | Plateauing as a relative percentage, but continuing to grow in absolute volume to serve data center load. |
| Nuclear | ~19% | 18% | 18% | Stagnant overall capacity; industry focus remains entirely on life extensions and uprates rather than new builds. |
| Coal | ~39% | 15% | 17% | Terminal structural decline; briefly bumped in 2025 due to weather patterns, but expected to resume falling. |
| Wind | ~4% | 10.5% | ~10% | Steady, mature growth; highly concentrated in the Midwestern MISO and SPP grids, and ERCOT. |
| Solar | <1% | 7% | ~8% | Exponential growth trajectory; the fastest-growing source of new capacity additions nationwide. |
| Hydro / Other | ~10% | 6.5% | 7% | Stable but vulnerable capacity; generation is highly dependent on annual rainfall and regional drought conditions. |
How Do Regional Grids Handle Renewable Integration?
Because the US grid is highly fragmented into discrete regional markets, the physical challenges of the energy transition look completely different depending on local geography. The realities of regional weather patterns dictate the specific engineering and economic problems that local grid operators face daily.
California and the Deepening "Duck Curve"
In California and the broader Western Interconnection, the rapid proliferation of solar power has created a severe operational phenomenon known throughout the industry as the "Duck Curve" 731.
Grid operators must constantly balance total power supply against the "net load," which is defined as the total consumer electricity demand minus the power generated by variable renewables like solar and wind 31. In a grid heavily saturated with solar panels, the sun rises and floods the transmission system with electricity right at midday. This massive influx of free, zero-marginal-cost solar power drives the net load required from traditional, dispatchable power plants drastically down, creating a deep "belly" in the daily demand curve 7318.
The physical reality of this challenge is illustrated by plotting the net load across a typical spring day over successive years. Historical data from the California Independent System Operator (CAISO) demonstrates that in the spring of 2015, the lowest midday net load reached approximately 15 gigawatts around 2:00 PM. As solar capacity continually expanded, this midday 'belly' steadily deepened. By the spring of 2023, the net load had plummeted to 0 gigawatts at approximately 1:00 PM. Consequently, as the sun sets, operators must execute an extraordinarily steep ramp-up of dispatchable generation to meet the evening demand peak 7.
This dynamic creates two massive systemic problems 33: 1. Grid Stress and Ramp Rates: When the sun sets in the late afternoon, solar generation drops to near zero exactly as residents return home from work, turn on air conditioners, and plug in EVs. The grid suddenly requires massive amounts of power. To keep the lights on and maintain the 60-hertz frequency, conventional natural gas plants must ramp up their output at extreme, unprecedented speeds to form the steep "neck" of the duck curve 318. 2. Economic Cannibalization: Because solar floods the market at noon, wholesale electricity prices frequently drop to zero or even go negative to incentivize consumption. This destroys the fundamental economics of traditional dispatchable baseload plants. If these plants cannot earn revenue during the day, they may be forced into early retirement, leaving the grid dangerously vulnerable when the sun goes down and their firm capacity is desperately needed 33.
The Midwest and Great Plains: Taming the Wind
While the West Coast wrestles with the sun, the Midwest (managed by MISO) and the Great Plains (managed by SPP) wrestle with the wind. The central US boasts some of the highest-quality onshore wind resources in the world 2834. In SPP, wind frequently accounts for massive portions of the mix, representing 45% of total generation during the spring 2025 quarter 9.
Integrating heavy wind penetration poses a completely different challenge than solar. Wind does not follow a predictable, diurnal pattern like the daily duck curve. It often blows strongest at night when consumer demand is lowest, and it can suffer from highly unpredictable multi-day lulls - sometimes called "wind droughts" - or sudden, massive surges 283436. Some industry analysts refer to these unpredictable, jagged net-load charts created by wind volatility as the "Smilin' Gator" curve 28.
To survive a severe, multi-day wind drought, Midwestern grid operators cannot rely solely on short-duration battery storage, which typically discharges over four hours; they must retain vast amounts of dispatchable fossil fuel capacity or build massive transmission interties to import power from distant regions where the wind is currently blowing 343637. Consequently, reserve capacity margins in wind-heavy regions like SPP are dwindling to what system officials describe as "dangerous" levels, dropping from 24% excess generating capacity in 2020 to a projected slim margin of 5% by 2029 37.
Texas (ERCOT): The Lone Star State's Island Grid
The ERCOT grid, which covers most of Texas, operates as a deliberate electrical island. Because it barely interconnects with the massive Eastern or Western interconnections, it cannot easily import emergency power from neighboring states when its own generation fails 2.
Despite this isolation, Texas is currently experiencing an unprecedented clean energy boom. It leads the nation in adding both commercial data center load and utility-scale solar capacity 94. In the first nine months of 2025 alone, wind and solar combined met an astonishing 36% of ERCOT's massive overall electricity demand .
However, because ERCOT cannot lean on its neighbors via transmission imports, it has had to innovate rapidly and rely heavily on market price signals to manage the severe intermittency of its renewable fleet. In 2024, Texas deployed massive amounts of utility-scale battery storage - accounting for 47% of all new generation capacity added to the ERCOT grid - specifically designed to capture excess midday solar generation and rapidly discharge it during the treacherous evening ramp-up 9.
The Transmission Bottleneck: Why We Cannot Just Build More Cables
If the wind blows fiercely in the Great Plains and the sun shines relentlessly in the Desert Southwest, but the massive demand centers are located in the East and on the coasts, the obvious engineering solution is to build long-distance, high-voltage transmission lines to connect the supply to the demand 673.
The exhaustive National Transmission Planning Study (NTP), released by the US Department of Energy, modeled nearly 100 future grid scenarios and concluded that to achieve a highly decarbonized and reliable power grid, the contiguous US transmission system must at least double in size by 2050 6. The National Renewable Energy Laboratory (NREL) modeling indicates that to reach interim goals by 2035, total transmission capacity would need to grow to 1.3 to 2.9 times current levels 3940. Crucially, the NTP study found that investing in this accelerated transmission expansion would ultimately save American consumers between $270 billion and $490 billion by 2050. These immense savings are generated primarily by reducing the need to build redundant, expensive local power plants and by accessing the cheapest regional fuel sources 641.
Yet, despite the obvious physical need and economic benefits, the United States has almost completely lost its institutional ability to build high-voltage, interregional transmission infrastructure.
The Interconnection Queue and Permitting Purgatory
Building a major transmission line in the US can easily take over a decade of litigation and bureaucracy. Projects must navigate a labyrinth of federal environmental reviews under NEPA, secure rights-of-way from thousands of private landowners, and obtain individual permits from multiple overlapping state, local, and tribal jurisdictions 740. For example, the SunZia transmission project, a 525-kilovolt line designed to carry 3,000 MW of wind power from central New Mexico to load centers in Arizona and California, spent an agonizing 17 years trapped in permitting and siting disputes before construction finally commenced 4042.
This systemic transmission bottleneck has created a massive traffic jam of new power generation projects attempting to come online. Nationwide, there are over 2,000 GW of proposed generation projects - more than 95% of which are clean energy technologies - sitting in bureaucratic "interconnection queues" waiting for grid operators to study whether the transmission system can handle their power 40. The average wait time for a commercial project to get connected to the grid has stretched from less than two years in the early 2000s to nearly four years today 40. Without new transmission highways to carry the electrons, developers simply cannot bring cheap renewable energy to market, stranding billions of dollars in capital.
How Does Federal Tax Policy Shape the Transition?
The physics and economics of the power grid do not exist in a vacuum; they are heavily distorted by the gravity of federal tax policy. In recent years, the energy sector has experienced severe legislative whiplash, fundamentally altering how utilities, developers, and Wall Street investors allocate capital for the future.
The Legacy of the Inflation Reduction Act (2022-2025)
Passed in late 2022, the Inflation Reduction Act (IRA) was heralded as the largest climate and energy investment in US history 43. The legislation flooded the energy market with targeted subsidies, offering highly lucrative, technology-neutral Investment Tax Credits (ITCs) and Production Tax Credits (PTCs) that functionally made solar, wind, and battery storage cheaper to build and operate than traditional fossil fuel plants in many regions. It also offered deep consumer tax credits and rebates for EVs, heat pumps, and home efficiency upgrades, intentionally driving up electricity demand in an effort to decarbonize the broader consumer economy 1429434410.
The Disruption of the One Big Beautiful Bill Act (2025)
On July 4, 2025, the political and economic landscape shifted dramatically when President Donald Trump signed the One Big Beautiful Bill Act (OBBBA). The sweeping budget reconciliation legislation explicitly rolled back many of the IRA's clean energy subsidies to pivot federal support toward an "America-First Energy Policy," heavily favoring domestic fossil fuel production and legacy baseload generation 29464748.
The OBBBA instituted several highly disruptive, immediate changes to the grid's financial incentives:
- The Accelerated Phaseout of Wind and Solar Credits: The law dictates that wind and solar projects will abruptly lose access to the flagship technology-neutral tax credits (Sections 48E and 45Y) if they are placed in service after December 31, 2027 464950. To qualify for a safe-harbor grace period, developers must begin physical construction on these projects by July 4, 2026 4749. This compressed, artificial timeline has forced developers to frantically accelerate their mature pipelines, creating a short-term boom in construction but triggering severe long-term investment uncertainty 4650.
- Foreign Entities of Concern (FEOC) Restrictions: The OBBBA implemented stringent new rules prohibiting developers from claiming lucrative tax credits if their projects involve supply chains tied to a "Prohibited Foreign Entity." If a project relies on components manufactured by a company where a Chinese entity owns 25% or more, or if the project receives "material assistance" from such an entity, it loses its tax incentives 46474951. This strikes directly at the heart of the solar and battery storage industries, which have historically relied heavily on dominant Chinese manufacturing and mineral processing.
- Fossil Fuel and Baseload Support: While aggressively curtailing subsidies for variable renewables, the bill preserved the long-term tax runway for zero-emission baseload power, specifically new nuclear, hydroelectric, and geothermal generation 4752. Furthermore, it massively expanded the 45Q tax credit for carbon capture and sequestration (CCS), specifically altering the rules so that projects using captured CO2 for Enhanced Oil Recovery (EOR) receive the same high credit rate as permanent geologic storage, directly subsidizing and incentivizing increased domestic oil production 295052.
- The End of Consumer Clean Energy Credits: The OBBBA eliminated residential tax credits for electric vehicles (Section 30D), home EV chargers (Section 30C), and residential solar panels (Section 25D) effective at the end of 2025, significantly altering the payback economics for homeowners who planned to electrify their properties 474853.
Comparing the Federal Policy Regimes
The stark contrast between the two legislative frameworks highlights the regulatory risk currently facing the US energy sector.
| Policy Area | Inflation Reduction Act (2022) | One Big Beautiful Bill Act (July 2025) 294647495052 |
|---|---|---|
| Wind & Solar Tax Credits (ITC/PTC) | Long-term, tech-neutral credits intended to provide a stable runway through at least 2032. | Phased out rapidly by Dec 2027; projects must begin construction by July 2026 to qualify for extensions. |
| Supply Chain Rules | Bonus "adder" credits for utilizing domestic content; loose initial foreign entity restrictions. | Strict FEOC bans; total loss of credits if 25%+ of supply chain involves a "Prohibited Foreign Entity." |
| Carbon Capture (45Q) | Higher credit values reserved for permanent geologic storage vs. Enhanced Oil Recovery (EOR). | Raised credit values for EOR to exact parity with geologic storage, boosting petroleum extraction. |
| Nuclear & Geothermal | Supported equally as zero-emission tech-neutral sources alongside wind and solar. | Retained long-term runway; deliberately exempted from the aggressive 2027 phaseout applied to variable renewables. |
| Consumer EV & Solar Credits | Subsidies up to $7,500 for EVs and 30% for home solar systems available through 2032. | Eliminated entirely after December 31, 2025, halting consumer-side demand incentives. |
What Technologies Are Reshaping Grid Operations?
Because building thousands of miles of new high-voltage transmission lines takes over a decade due to permitting constraints, grid operators are increasingly relying on new technologies at the edge of the grid to squeeze more operational efficiency and reliability out of the existing physical system.
Utility-Scale Battery Storage: Shortening the Duck's Neck
To mitigate the severity of the duck curve in California and the intermittency of variable wind generation in ERCOT, utilities are deploying utility-scale lithium-ion battery storage at a staggering pace. In 2024, the US added a record 10 GW of utility-scale battery capacity to the grid, representing an 80% increase from the prior year and achieving a ratio of roughly 1 GW of battery storage deployed for every 3 GW of new utility-scale solar installed 4.
These massive battery installations act as a critical shock absorber for the grid. They charge during the midday solar glut (the duck's belly) when wholesale electricity prices are incredibly low or negative, and they discharge those stored electrons during the steep evening ramp (the duck's neck) when prices peak and grid stress is highest . While four-hour lithium-ion batteries cannot solve the problem of a multi-day winter wind drought in the Midwest, they are highly effective at smoothing out daily solar fluctuations and providing instantaneous frequency regulation.
Demand Response and Virtual Power Plants
If grid operators cannot quickly increase physical generation supply or build new transmission, their only other operational option is to artificially decrease consumer demand. "Demand response" programs actively compensate large industrial users, or aggregations of residential customers, to voluntarily lower their electricity usage during periods of peak grid stress 837.
Through the deployment of smart meters and internet-connected residential thermostats, grid operators can now automatically turn down millions of residential air conditioners by a few degrees or temporarily delay EV charging during a severe heatwave. When networked together by software, these distributed energy resources function as a "Virtual Power Plant" (VPP). A VPP provides the exact same grid-balancing capacity services as firing up a natural gas peaker plant, but without the corresponding carbon emissions, fuel costs, or the need to build a physical power plant 18. In severely capacity-constrained regions like the Southwest Power Pool, aggressively expanding demand response is increasingly viewed by system planners as one of the few viable, immediate ways to bridge the supply gap until new physical generation can be built 37.
Bottom line
The US power grid is currently racing to adapt to a sudden, unexpected surge in electricity demand driven by hyperscale data centers, industrial reshoring, and the widespread electrification of vehicles and buildings. While renewable generation from wind and solar has grown exponentially - recently eclipsing coal generation for the first time in history - integrating these variable resources is fundamentally altering wholesale market economics and severely straining an aging transmission network that remains mired in multi-year permitting delays. Furthermore, the aggressive rollback of clean energy tax incentives under the 2025 One Big Beautiful Bill Act has injected significant policy volatility into the market, and it remains highly uncertain whether developers can deploy enough new dispatchable generation, transmission, and battery storage to ensure long-term reliability before critical financial lifelines expire.