Where Will the US Get New Power Grid Capacity in 2026
In 2026, the United States is adding a record-breaking 86 gigawatts of new utility-scale electricity capacity to the power grid, with solar energy and battery storage accounting for nearly 80 percent of the total. However, an unprecedented surge in demand from artificial intelligence data centers and new domestic manufacturing is swallowing these gains, leading to tighter reliability margins and rising electric bills for consumers across the country.
The Scope of the 2026 Grid Expansion
For nearly two decades, electricity demand in the United States remained remarkably flat. Despite population increases and economic expansion, energy efficiency improvements - such as the widespread adoption of LED lighting, better building insulation, and highly efficient modern appliances - effectively decoupled economic growth from electricity consumption 2. That era of stability has officially ended. To meet a sudden and steep upward curve in power consumption, utility companies, grid operators, and private developers are currently racing to connect new power plants to the electrical grid at an unprecedented scale.
According to the U.S. Energy Information Administration (EIA), developers plan to add a staggering 86 gigawatts (GW) of new utility-scale electric generating capacity to the grid by the end of 2026 1. If these plans are fully realized, this buildout will shatter the previous record of 53 GW set in 2025, which was itself the largest single-year installation of grid capacity since 2002 12.
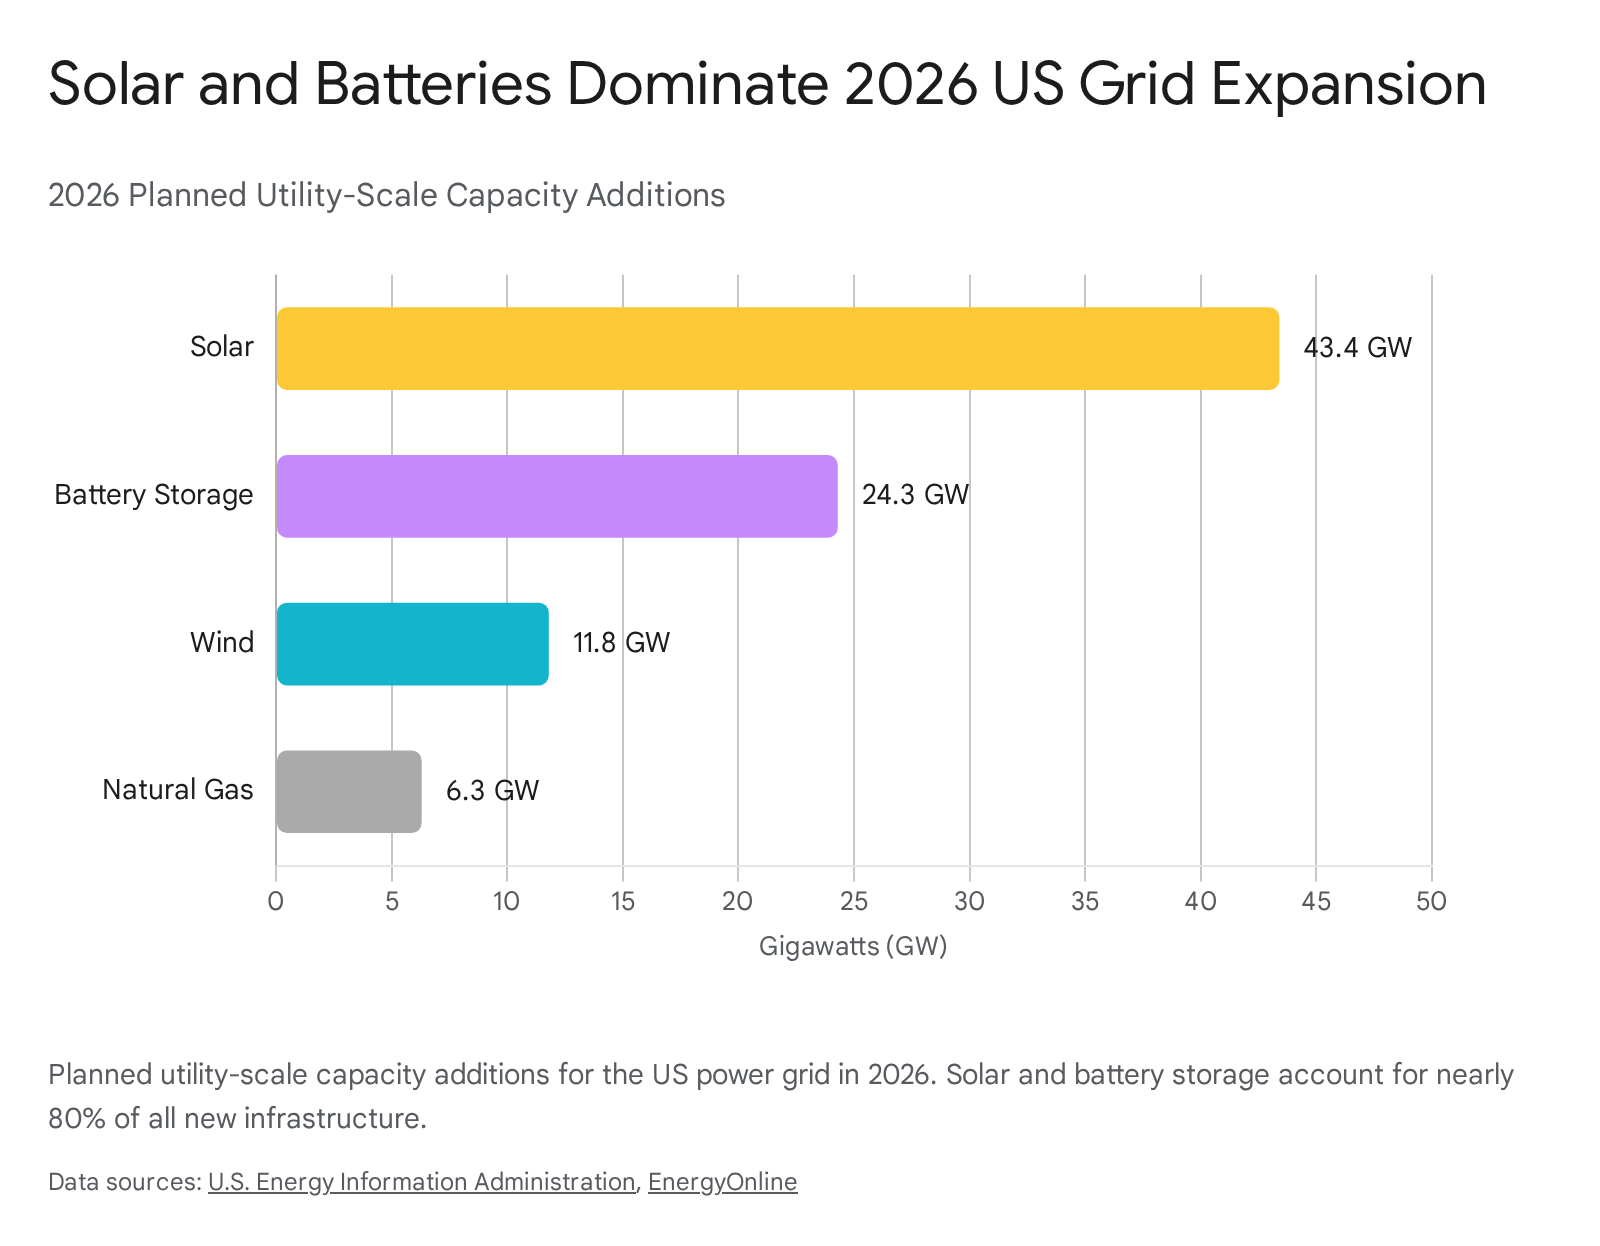
The composition of this new infrastructure represents a fundamental shift in how the United States generates its electricity. Fossil fuels, which dominated grid expansions in previous decades, are taking a backseat to renewable energy and advanced energy storage systems. The planned 2026 capacity additions are heavily skewed toward clean energy technologies: developers anticipate adding 43.4 GW of solar power, which constitutes 51 percent of the total planned additions 1. Battery storage makes up the second-largest share, with 24.3 GW planned, representing 28 percent of the total 1. Wind capacity additions are expected to reach 11.8 GW, or 14 percent, while natural gas follows at a distant 6.3 GW, or just 7 percent of the total buildout 1. Nuclear power and other miscellaneous sources account for a fraction of a percent 13.
Solar power is undeniably the driving force of the current grid expansion. The anticipated 43.4 GW represents an enormous 60 percent increase over the record-setting utility-scale solar capacity added to the grid in 2025 2. This boom is not evenly distributed across the nation. Geographic advantages, regulatory environments, and available land have concentrated development in a few key areas. More than half of this new utility-scale solar capacity is planned for just four states: Texas commands an overwhelming 40 percent share of the national pipeline, followed by Arizona at 6 percent, California at 6 percent, and Michigan at 5 percent 1. The largest single solar photovoltaic project expected to commence operations in 2026 is the Tehuacana Creek 1 Solar and BESS project in Texas, which is designed to add 837 megawatts (MW) of solar generation alongside an additional 418 MW of battery storage 1.
The pairing of solar arrays with massive battery installations is a defining characteristic of the 2026 power build. Because solar panels generate electricity only during daylight hours, grid operators face a daily challenge: power generation peaks at midday when the sun is highest, but consumer demand typically peaks in the early evening when people return from work, turn on household appliances, and activate air conditioning units. Without a way to store the midday surplus, grid operators would be forced to curtail, or waste, the excess solar energy 45. This operational necessity has sparked an explosive boom in grid-scale battery energy storage systems (BESS). Developers plan to add roughly 24 GW of utility-scale battery storage to the grid this year, a significant jump from the previous record of 15 GW added in 2025 12. Unsurprisingly, battery deployments are heavily concentrated in the same states leading the solar charge, with Texas, California, and Arizona accounting for nearly 80 percent of all planned 2026 battery additions 12.
Retiring the Old Guard: Fossil Fuel Decommissioning
To accurately assess the growth of the United States power grid, one must look at the net capacity additions rather than just the gross figures. The total generating capability of the grid is fundamentally a mathematical equation consisting of new capacity coming online minus older plants retiring from service. While developers are successfully plugging 86 GW of new power into the system, older, less efficient, and economically uncompetitive thermal power plants are simultaneously being decommissioned 6.
In 2026, power plant owners and operators plan to retire approximately 11 GW of thermal power capacity from the grid 6. Coal-fired power plants account for the clear majority of these scheduled closures, representing 6.4 GW, or 58 percent of the retiring fleet 6. The remainder consists primarily of older steam-turbine and simple-cycle natural gas units, which total 4.6 GW, or roughly 42 percent of the retirements 6.
Among the most significant closures scheduled for 2026 is the 1,331 MW J.H. Campbell coal-fired plant in Michigan, as well as the 1,231 MW Cumberland Unit 2 in Tennessee 6. On the natural gas side, two aging California plants - AES Alamitos and Huntington Beach, which together possess a combined capacity of 1,368 MW - will mark the largest natural gas retirements of the year 6.
| Category | Fuel Type | 2026 Planned Capacity (GW) | Share of Total |
|---|---|---|---|
| Additions | Solar | + 43.4 GW | 51.0% |
| Additions | Battery Storage | + 24.3 GW | 28.0% |
| Additions | Wind | + 11.8 GW | 14.0% |
| Additions | Natural Gas | + 6.3 GW | 7.0% |
| Retirements | Coal | - 6.4 GW | 58.0% (of retirements) |
| Retirements | Natural Gas (Older Units) | - 4.6 GW | 42.0% (of retirements) |
Data Source: U.S. Energy Information Administration (EIA) 16. Note: Minor additions and retirements from petroleum, biomass, and nuclear represent negligible fractions and are excluded for clarity.
The planned retirements of aging fossil fuel infrastructure so closely mirror the planned additions of new natural gas facilities that the net change in domestic fossil fuel capacity is essentially flat. Because the 6.3 GW of new, highly efficient combined-cycle and combustion turbine natural gas plants is almost entirely offset by the retirement of older gas and coal units, the EIA projects that virtually 100 percent of the net new generating capacity added to the US grid in 2026 will be attributable to renewable energy and battery storage 3712.
However, the retirement schedule for fossil fuel plants is highly fluid and subject to regulatory intervention. In 2025, developers initially anticipated retiring 8.0 GW of coal capacity, but only 2.6 GW actually went offline 8. The U.S. Department of Energy (DOE) stepped in and issued emergency orders under Section 202(c) of the Federal Power Act, directing several large coal plants to temporarily remain available to ensure grid reliability during periods of high demand 89. Plants such as the Brandon Shores facility in Maryland and the South Oak facility in Wisconsin had their retirements delayed to 2026 or beyond as grid operators grew increasingly concerned about losing firm, dispatchable baseload power before sufficient replacement generation could be fully integrated 8.
Capacity vs. Generation: Why 86 Gigawatts Isn't What It Seems
While the raw numbers of the 2026 grid buildout sound historically staggering, energy analysts and grid planners emphasize a critical distinction that is often misunderstood in public discourse: nameplate capacity is not synonymous with actual energy generation.
Nameplate capacity refers to the maximum amount of electrical power a plant could theoretically produce if it ran perfectly at 100 percent output, 24 hours a day, 365 days a year 1011. In reality, no power plant runs constantly. Nuclear plants must occasionally shut down for refueling, natural gas plants require routine maintenance, and renewable sources are entirely dependent on prevailing weather conditions 1011. The ratio of a power plant's actual electrical output over a specific period compared to its theoretical maximum output is known as its "capacity factor" 1011.
Because renewable energy sources like wind and solar are variable, their capacity factors are inherently much lower than those of traditional thermal power plants, which can combust fuel on demand. Understanding these long-term averages is absolutely crucial to grasping the physical reality of the 2026 grid expansion.
| Energy Source | Average US Capacity Factor | Operational Characteristics |
|---|---|---|
| Nuclear | ~91% - 92% | Operates nearly constantly as baseload power, stopping only for scheduled refueling cycles or critical safety maintenance 1011. |
| Natural Gas (Combined Cycle) | ~56% - 60% | Highly dispatchable and efficient; runs frequently as baseload or ramps up quickly to fill supply gaps 1112. |
| Wind (Onshore) | ~34% - 36% | Generates power roughly a third of the time, heavily dependent on seasonal wind patterns and geographic location 101112. |
| Solar (Utility-Scale) | ~23% - 25% | Generates power exclusively during daylight hours, peaking at midday and falling to zero at night 101112. |
| Natural Gas (Simple Cycle) | ~13% - 17% | "Peaker" plants that operate infrequently, only turning on during the highest hours of grid demand when prices spike 11. |
Data Source: U.S. Energy Information Administration (EIA) 10111213.
Because of these mathematical realities, replacing a retiring 1,000 MW coal plant requires significantly more than 1,000 MW of solar panels to achieve the same total energy output over the course of a year. When factoring in a solar capacity factor of roughly 25 percent, it takes roughly four megawatts of solar capacity to replace the total annual energy volume generated by one megawatt of baseload thermal power 10.
Therefore, while the 43.4 GW of solar capacity being added in 2026 is a massive infrastructure achievement, it will ultimately produce far less total electricity on an annual basis than an equivalent buildout of natural gas or nuclear power 1112. This physical constraint perfectly illustrates why the 24.3 GW of battery storage being deployed this year is not just an optional grid enhancement, but an absolute operational necessity. Batteries do not generate new energy; they serve as a time-shifting mechanism, allowing the grid to capture excess solar energy generated at noon - which might otherwise be curtailed - and inject it back into the system during the evening hours when solar generation drops to zero but consumer demand remains high 4514.
The Unprecedented Surge in Electricity Demand
If the United States is building electrical power infrastructure at a record-breaking pace, why are regional grid operators and federal regulators consistently sounding the alarm about potential power shortages? The answer lies in a historic, multi-sector convergence of electricity demand that is rapidly outpacing the speed at which new generation and transmission can be deployed. Three primary drivers have pushed the US grid to its absolute limits in 2026.
The Artificial Intelligence and Data Center Boom
The proliferation of artificial intelligence - particularly the training and deployment of large language models and generative AI - requires vast amounts of computational power. A single modern AI data center can consume as much electricity as 100,000 households; hyperscale facilities currently under construction and entering the interconnection queues may require up to 20 times that amount 1516.
Unlike residential neighborhoods where power usage fluctuates predictably with the rising and setting of the sun, data centers operate 24 hours a day, 7 days a week. They draw a massive, flat "baseload" of power that places constant strain on local grid infrastructure 17. Global data center electricity consumption grew by a steady rate of about 12 percent annually over the last five years, but the AI boom is aggressively accelerating that trajectory 15. The International Energy Agency (IEA) estimates that electricity consumption from AI-focused data centers climbed by 50 percent globally in 2025 alone, vastly outpacing the overall global electricity demand growth of just 3 percent 2.
In the United States, analysts at Goldman Sachs project that domestic data center power demand will surge from 31 GW in 2025 to 41 GW in 2026, and will reach an astonishing 66 GW by 2027 18. This represents a doubling of load in an incredibly compressed timeframe. The Brookings Institution notes that independent projections estimate data center energy consumption could approach 1,050 terawatt-hours (TWh) by 2026, making the sector a larger energy consumer than many developed nations 19. Furthermore, AI developers estimate that by 2027, the computational resources required to train a single frontier AI model will demand five gigawatts of power 19. This localized, highly concentrated demand is fundamentally altering regional grid planning, forcing utilities to scramble to secure enough power to keep these facilities online without jeopardizing residential reliability.
An Industrial Manufacturing Renaissance
Simultaneous with the digital demand shock, the United States is experiencing a massive boom in domestic, heavy industrial manufacturing. Spurred by federal industrial policy - specifically the incentives bundled within the Inflation Reduction Act (IRA) and the CHIPS and Science Act - billions of dollars in private capital have been mobilized to onshore critical supply chains 20282122.
Since 2022, the semiconductor sector has attracted approximately $200 billion in private investments for the construction of new fabrication facilities ("fabs"), while the electric vehicle battery sector has drawn nearly $75 billion 20. As of early 2025, companies had announced 380 clean technology manufacturing facilities across the country since the passage of the IRA 21.
These advanced manufacturing facilities are incredibly energy-intensive. For example, the planned expansion of the TSMC semiconductor plant in Arizona is projected to eventually consume over 1 GW of electricity 20. Similarly, the 45 domestic battery manufacturing plants announced across the country are estimated to require over 5,200 MW of power to operate 20. Because these factories take years to build and require massive, continuous baseload power to run sensitive fabrication equipment, they are directly competing with AI data centers for limited grid interconnection slots.
Broad Electrification and Climate Goals
The third pillar driving demand is the intentional, policy-driven transition away from fossil fuels in daily life. State and federal decarbonization goals are incentivizing the electrification of the broader economy. The gradual adoption of electric vehicles, the shift from residential gas furnaces to electric heat pumps, and the electrification of industrial and port operations are steadily adding new load to the grid from the ground up 232425.
In California alone, the state energy commission projects that base load will grow by 15 GW by 2035 and 20 GW by 2040, driven largely by building and transportation electrification mandates 23. When combined with the massive influx of data centers and the onshoring of manufacturing, the US grid is facing a demand landscape that planners simply did not anticipate a decade ago.
A Tale of Three Grids: Regional Flashpoints
The United States power grid is not a single, unified entity; it is a complex patchwork of regional networks, each facing entirely different regulatory environments, resource mixes, and operational challenges. Examining the three largest and most dynamic regional grids highlights exactly how the 2026 power build is playing out on the ground.
ERCOT (Texas): The Epicenter of Explosive Growth
The Electric Reliability Council of Texas (ERCOT), which operates the isolated grid responsible for 90 percent of the state's electric load, is currently the undisputed epicenter of US energy expansion 2635.
Texas is experiencing a perfect storm of electricity demand. A booming state population, a thriving industrial sector, and a massive influx of hyperscale data centers and cryptocurrency mining operations have pushed the state's power needs into uncharted territory 26353637. ERCOT's system-wide load grew by 5 percent in 2025, and forecasts from the EIA indicate a further 9.6 percent jump in 2026 3527.
To meet this insatiable demand, Texas is building renewable infrastructure at a dizzying pace, far outstripping any other state. In 2026, ERCOT accounts for roughly 40 percent of all planned utility-scale solar additions nationwide and an astounding 53 percent of all planned battery storage capacity 239. The ERCOT grid entered 2026 with 13.9 GW of commercially operational battery storage, surpassing California for the first time 143928.
This rapid deployment is driven by ERCOT's unique market structure. Unlike other regions, ERCOT operates an "energy-only" merchant market. There are no guaranteed capacity payments to keep plants on standby; instead, generators are paid only for the electricity they produce, and wholesale prices are allowed to spike dramatically during periods of scarcity 3529. This high-risk, high-reward environment highly incentivizes developers to build fast-responding battery storage to capture massive revenues during brief moments of grid stress. In late 2025, ERCOT implemented a major market redesign known as Real-Time Co-Optimization with Batteries (RTC+B), which allows batteries to simultaneously bid into both energy and ancillary service markets, further industrializing the role of storage on the grid 1429.
However, this rapid transition carries immense risks. Because the state relies so heavily on intermittent renewables to meet its soaring demand, ERCOT expects its summer peak reserve margins to enter negative territory by 2026 26. This means the grid will rely entirely on near-perfect performance from its new solar and battery assets, as well as voluntary demand response from large industrial consumers, to avoid localized rolling blackouts during extreme heat waves.
CAISO (California): The Battery Pioneer
The California Independent System Operator (CAISO) serves as the global proving ground for how a modern, heavily renewable grid operates in real time. Because California aggressively built out solar power over the last decade, it regularly experiences the "duck curve" - a phenomenon where the state produces far more solar energy during midday hours than consumers can actually use. This oversupply leads to negative wholesale power prices and forces operators to curtail, or throw away, excess clean energy 4530.
To solve this mismatch, California pioneered the grid-scale battery revolution. Starting from a modest 500 MW in 2020, CAISO rapidly expanded its battery fleet to roughly 17,000 MW by late 2025, providing enough capacity to cover roughly a third of its peak system load 414.
In 2026, these batteries act as the central pillar of California's grid reliability. They execute daily "intraday arbitrage," charging up when midday solar is cheap and abundant, and discharging into the grid during the critical hours of 5:00 PM to 9:00 PM as the sun sets and consumer demand peaks 430. While ERCOT briefly challenged CAISO for total installed battery capacity, California continues to mandate massive storage additions to meet its ambitious goal of a 100 percent zero-carbon grid by 2045 41439.
Furthermore, CAISO is evolving its market mechanics. In 2026, it is rolling out its "Slice of Day" resource adequacy framework, which forces utilities to prove they have enough power secured for every specific hour of the day, rather than just meeting a generalized monthly target 29. In May 2026, CAISO is also scheduled to launch the Extended Day-Ahead Market (EDAM), which will tightly integrate neighboring Western states into California's pricing structure, allowing for more efficient sharing of renewable resources across state lines 30.
PJM (Mid-Atlantic): The Supply Crunch and Price Shocks
PJM Interconnection is the largest wholesale electricity market in the United States, managing the flow of power across 13 states from Illinois to New Jersey, plus Washington D.C. 4331. Unlike Texas or California, PJM's narrative in 2026 is defined by acute supply constraints, regulatory bottlenecks, and massive price shocks.
PJM's territory encompasses "Data Center Alley" in Northern Virginia, the densest concentration of internet infrastructure on the planet. Driven by aggressive AI expansion, PJM's peak load forecast for the 2026-2027 delivery year jumped by an unprecedented 5,400 MW 43. However, while demand is skyrocketing, PJM has severely struggled to bring new power plants online to meet it. The region's interconnection queue - the administrative waitlist for new projects seeking to connect to the grid - has been notoriously bogged down for years, stranding thousands of megawatts of potential solar and battery projects in bureaucratic limbo. Concurrently, older coal and gas plants continue to retire 54331.
The result of this severe supply-demand mismatch is a dramatic financial shock. In July 2025, PJM conducted its annual capacity auction for the 2026-2027 delivery year. In this market, power plants bid for guaranteed payments to remain on standby during grid emergencies. Because supply was so tight, the final clearing price hit a record $329.17/MW-day - a 22 percent rate hike from the previous year, effectively maxing out the pricing ceiling approved by federal regulators 43. Despite securing 134,311 MW of capacity at these exorbitant prices, PJM finalized the auction with a buffer of just 139 MW over its strict reliability requirement, leaving the Mid-Atlantic grid with an uncomfortably tight margin of error 43.
The Transmission Bottleneck: Getting Power Where It's Needed
Building massive new solar farms, wind arrays, and data centers is only half the battle; the electricity must physically travel from where it is generated to where it is consumed. The US high-voltage transmission system - widely considered the Achilles' heel of the clean energy transition - is struggling to adapt to the new geographic realities of power generation 323334.
The nation's most abundant, low-cost renewable resources are frequently located in remote, rural areas - such as the wind-swept plains of the Midwest or the deserts of the Southwest - that are hundreds of miles away from the major coastal cities and industrial hubs that demand the power 34. Historically, transmission planners looked roughly a decade into the future. By 2026, regional operators are being forced to adopt 20- to 30-year planning horizons to account for the immense lead times required to permit, finance, and physically build interstate high-voltage lines 32. A recent National Transmission Planning Study conducted by the Department of Energy concluded that the US may need to double the size of its transmission system by 2050 to meet decarbonization targets, an effort that requires unprecedented coordination 34.
Generational Megaprojects Breaking Ground
Despite severe permitting hurdles, 2026 marks the culmination of several generational transmission megaprojects that have been trapped in regulatory purgatory for decades. The most prominent example is the SunZia Wind and Transmission project. Billed as the largest clean energy infrastructure project in United States history, SunZia pairs a massive 3.5 GW wind farm in central New Mexico with a 550-mile, 525 kV high-voltage direct current (HVDC) transmission line that carries the power westward to markets in Arizona and California 353637.
The SunZia project highlights the excruciating timelines of American infrastructure development. After 17 years of initial planning, intense regulatory fights, redesigns from AC to DC power, and environmental lawsuits from conservationists and indigenous groups like the Tohono O'odham Nation over the routing through the San Pedro Valley, the $11 billion project is finally slated to begin commercial operations in mid-2026 353637. Once fully operational, it will deliver enough clean energy to power one million homes annually 363852.
Other major inter-regional lines are also advancing. Projects like the Champlain Hudson Power Express - a $2.9 billion underwater HVDC cable bringing hydropower from Quebec to New York City - and various 765 kilovolt (kV) backbone expansions in the MISO region are pushing forward to relieve congestion 3239. Additionally, the Department of Energy has identified 10 preliminary National Interest Electric Transmission Corridors (NIETCs), a designation designed to fast-track permitting in areas where consumers are harmed by a lack of transmission capacity 54.
Local Opposition and the NIMBY Challenge
The primary obstacle to grid expansion in 2026 is no longer technological engineering; it is social and political resistance. High-voltage transmission towers can stand up to 165 feet tall, requiring wide, clear-cut rights-of-way that dissect private property, agricultural farmland, and historic conservation areas 5540.
As utility companies propose tens of billions of dollars in new transmission lines specifically to support the massive load growth of AI data centers, local opposition has become fierce. For example, the proposed "Valley Link" transmission project in Virginia - designed largely to connect new data center loads in the PJM territory - has sparked intense backlash from advocacy groups like the Piedmont Environmental Council and the local Farm Bureau 40. Residents across nine counties are fighting the project over concerns regarding eminent domain takings, depressed property values, and the visual impact on historic battlefields and rural landscapes 5540.
This localized resistance creates a profound tension. On one hand, there is a national economic mandate to build out AI infrastructure and renewable energy to maintain global competitiveness; on the other hand, there is a fierce local desire to preserve communities from the industrialization required to support that grid. Resolving this "Not In My Backyard" (NIMBY) conflict is one of the defining political challenges of the 2026 power buildout 554041.
The Financial Impact on American Households
For the average American consumer, the historic 2026 grid buildout translates directly into higher monthly household expenses. The long era of stagnant, cheap electricity has firmly ended, and the costs of modernizing the grid are flowing down to retail utility bills.
According to the EIA's Short-Term Energy Outlook, residential electricity prices across the United States are expected to rise by an average of nearly 5 percent in 2026, reaching an average of 18.2 cents per kilowatt-hour . Wholesale electricity prices - the rates utilities pay to generators on the open market - are rising even faster. The EIA forecasts the national load-weighted average wholesale price to reach $51/MWh in 2026, an 8.5 percent increase over 2025 3742. In high-demand regions like the ERCOT market in Texas, wholesale prices are projected to spike by a massive 45 percent, driven by summer scarcity pricing 374262.
These widespread rate increases are driven by a combination of compounding factors: 1. Massive Infrastructure Costs: Utilities are passing the multi-billion-dollar capital costs of building new high-voltage transmission lines, upgrading local substations to handle data centers, and hardening the grid against wildfires directly to ratepayers via the "delivery" portion of their bills 27404344. 2. Natural Gas Volatility: Because natural gas still fuels roughly 40 percent of the US power grid, its commodity price heavily dictates overall market electricity rates. Increased liquid natural gas (LNG) exports abroad have tightened domestic supply, pushing gas prices higher to an estimated $4 per MMBtu in 2026 36426265. 3. Capacity Market Fees: In regulated markets like PJM, the record-high $329/MW-day capacity auction prices act as a non-negotiable insurance premium for grid reliability. These costs are passed directly to end-users, with PJM officials estimating a 1 to 5 percent increase on retail energy bills starting in June 2026 purely from capacity fees 43.
In California, the financial impact is particularly acute. The state's average residential electricity rate is approaching 35 cents per kWh, roughly double the national average 245. Southern California Edison (SCE) customers are facing a projected 12.9 percent rate increase in 2026 alone to cover infrastructure and procurement costs 243. Furthermore, starting in March 2026, major California investor-owned utilities are rolling out mandatory fixed monthly charges of approximately $24 to cover base infrastructure maintenance, a fee that customers must pay regardless of how much actual energy they consume 44.
Summer 2026 Reliability: Will the Grid Hold?
As the United States approaches the summer of 2026, grid reliability remains a highly precarious balancing act. The North American Electric Reliability Corporation (NERC), the federal authority tasked with monitoring continental grid stability, has issued stark warnings in its long-term assessments: two-thirds of the United States faces elevated or high risks of potential energy shortfalls during periods of extreme heat this summer 674669.
While the 75 GW of net summer capacity additions expected to be online by mid-year have slightly improved the baseline outlook compared to previous years, extreme weather remains the ultimate wildcard 46. Prolonged, widespread heat waves spike air conditioning demand exactly when the grid's infrastructure is most physically stressed. Furthermore, ongoing droughts and low snowpack in the Western United States have severely curbed the output of vital hydroelectric dams, removing a crucial source of flexible, dispatchable power 4647.
In Texas, the grid faces heightened risks specifically during the early evening hours. As the sun sets and the massive fleet of solar panels drops offline, temperatures - and residential cooling demand - remain high, requiring natural gas peaker plants and battery storage to perfectly execute a massive ramp-up in generation to prevent rolling blackouts 6771.
Ultimately, grid operators in 2026 are engaged in a high-stakes race against time. They must physically interconnect historic volumes of solar, wind, and battery storage fast enough to outpace the insatiable energy demands of the AI revolution and domestic manufacturing, all while navigating regulatory bottlenecks, extreme weather events, and an aging transmission system that was built for a completely different era of electricity.
Bottom line
The 2026 US power build is defined by historic contradictions. The grid is adding a record 86 gigawatts of new capacity - the vast majority from clean solar, wind, and battery storage - representing an incredible technological transition. However, an unprecedented surge in electricity demand driven by AI data centers, domestic manufacturing, and widespread electrification is rapidly swallowing these capacity gains, leaving grid operators with uncomfortably tight reserve margins. While these massive infrastructure investments are absolutely necessary to modernize the system, the financial burden of this transition is falling squarely on consumers through rising monthly bills and new fixed charges, while the physical reliability of the grid remains vulnerable to extreme summer weather.