Why Rents and Mortgages Are Still Stuck High in 2026
Heading into 2026, prospective homebuyers and weary renters globally were promised a year of financial relief, with central banks widely expected to slash interest rates and alleviate the severe affordability crisis that defined the post-pandemic era. Instead, an unforeseen geopolitical shock in the Middle East has reignited inflation fears, freezing central bank policy and leaving global housing markets trapped in a paralyzing state of record-high property values and stubbornly elevated borrowing costs.
The 2026 Market Paradox: A Stalled Recovery
For real estate professionals, economic analysts, and everyday households, 2026 was supposed to be the long-awaited "comeback year" for global housing. Central banks across the developed world had spent the latter half of 2024 and 2025 signaling the end of their aggressive, inflation-busting rate-hiking cycles. Markets were aggressively pricing in a steady cadence of rate cuts that would finally bring down the cost of mortgages and unfreeze a dormant property market 1223.
However, housing affordability has not only failed to improve but has, in many regions, deteriorated further. The core of this crisis lies in a structural macroeconomic disconnect. Home prices have largely retained, and in some cases expanded upon, their massive pandemic-era gains. Simultaneously, the cost of debt has remained unexpectedly elevated. To navigate the housing market in 2026 requires understanding a complex, interlocking web of geopolitical risks, localized supply shortages, shifting demographics, and profound changes in the availability of global credit. The pain is ubiquitous, but the specific mechanisms trapping buyers and renters vary dramatically from the suburbs of Sydney to the high-rises of Tokyo.
The Geopolitical Shock: The Middle East and Global Mortgages
To understand why a local mortgage remains prohibitively expensive in 2026, one must first look toward global energy markets and international geopolitics. Early in the year, military engagements involving the United States, Israel, and Iran created severe disruptions in and around the Strait of Hormuz 225. Because this maritime route is responsible for a massive share of the global oil supply, the conflict immediately altered the trajectory of global inflation.
When energy prices spike due to supply chain fears, the cost of manufacturing, transporting, and delivering goods rises across the board. This feeds directly into core inflation metrics. Central banks, terrified of triggering a second wave of persistent inflation just as they were preparing to declare victory, abruptly altered their forward guidance. The transmission mechanism from global conflict to local housing affordability operates through a direct and unforgiving chain of economic reactions.
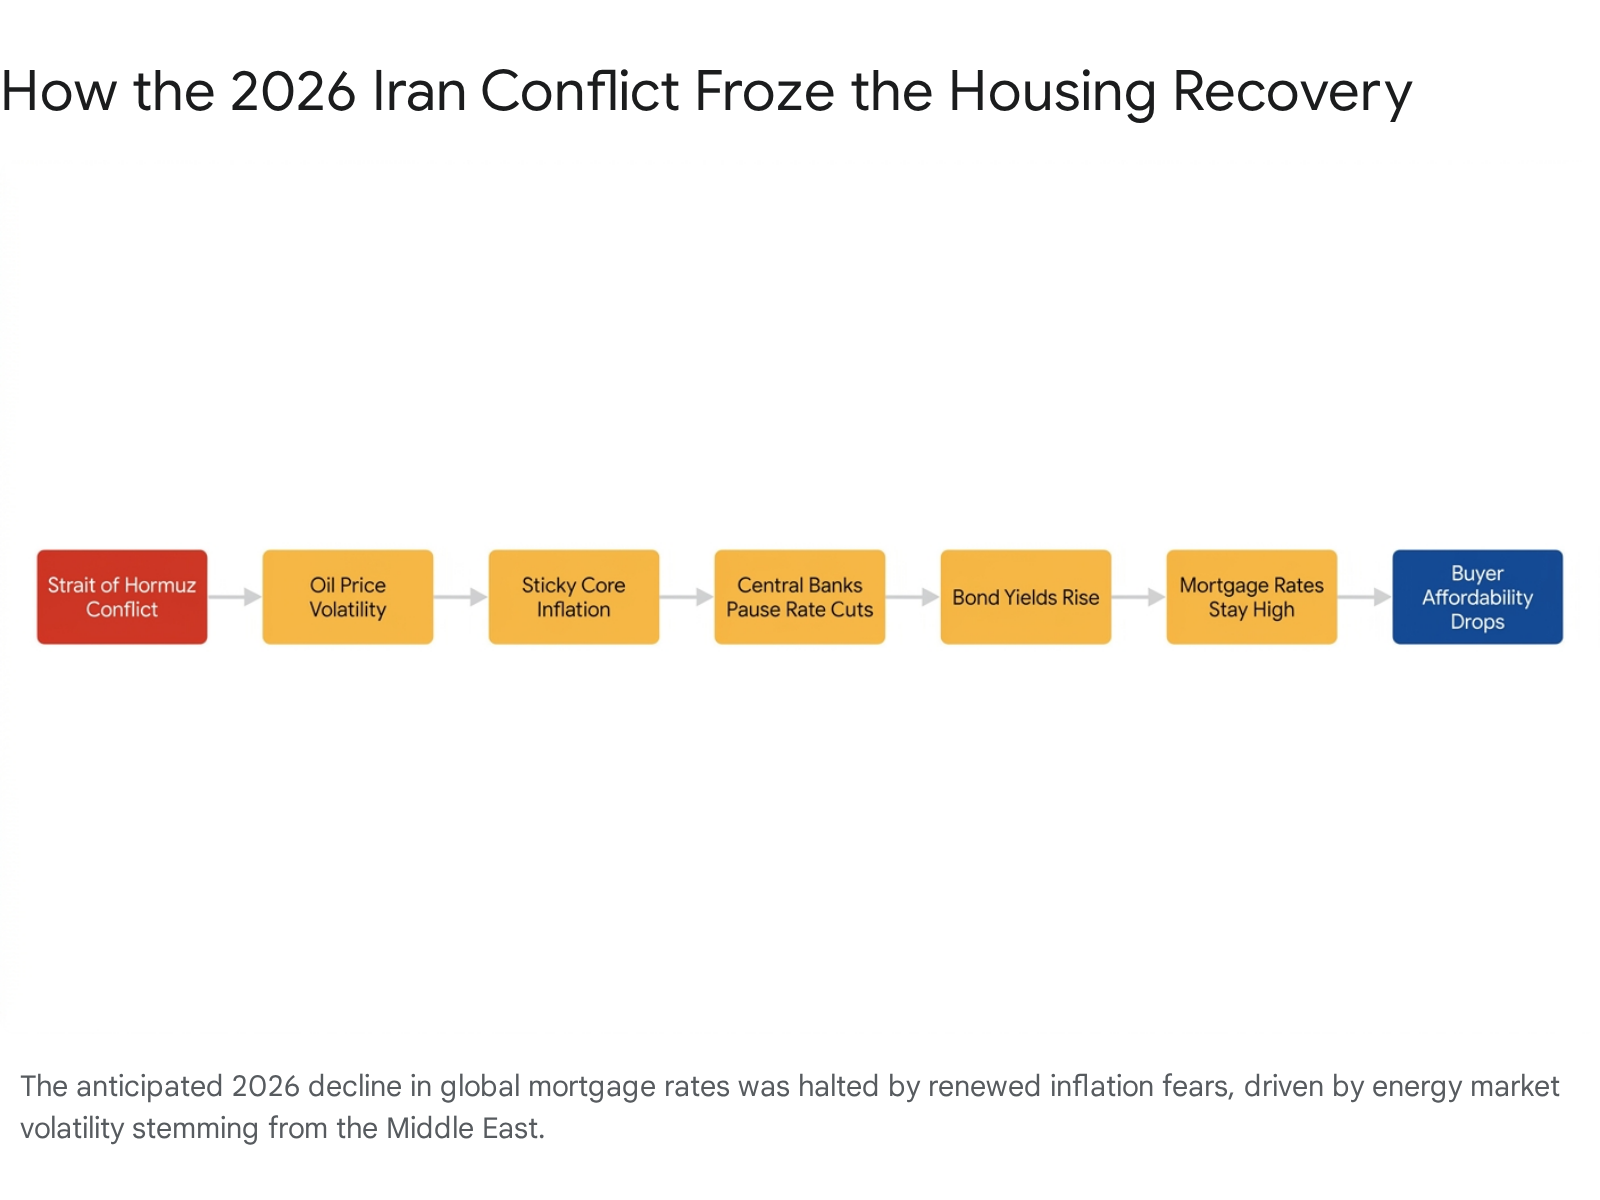
First, energy shocks keep inflation "sticky." Institutions like the United States Federal Reserve, the Bank of England, and the Reserve Bank of Australia all explicitly cited the Middle East conflict as a primary risk to their inflation targets during their spring meetings 3456. Federal Reserve Vice Chair for Supervision Michelle Bowman noted that while initial supply disruptions might seem temporary, an extended energy shock could broaden into more persistent price pressures, fundamentally shifting the central bank's approach to the balance of risks 5.
Second, central banks execute a hawkish pivot. Expectations for a series of steady rate cuts in 2026 quickly evaporated. By mid-May 2026, financial markets were pricing in a near 70% probability that the U.S. Federal Reserve would execute zero rate cuts for the remainder of the year, a stark reversal from expectations just months prior 2. The Reserve Bank of Australia actually raised its cash rate to 4.35% in May 2026 specifically to combat these renewed inflationary pressures 4710.
Third, bond yields surge in response to central bank signaling. Mortgage rates are not set directly by central banks; they are generally priced against long-term government bond yields, such as the 10-year U.S. Treasury or UK Gilts. As global investors realized that central banks would be forced to keep policy rates "higher for longer," these bond yields surged as investors demanded higher returns for tying up their capital 311.
Finally, mortgages become more expensive on the retail level. In the United States, average 30-year fixed rates climbed back into the mid-6% range during the critical spring selling season, effectively torching the anticipated recovery 211. In the United Kingdom, five-year fixed-rate mortgages saw an effective 1 percentage point increase in cost compared to early-year projections 3. In Japan, the five major megabanks hiked their benchmark 10-year fixed products to new all-time highs for the modern era following a surge in Japanese government bond yields 12.
As one real estate analyst aptly summarized, the housing market in 2026 is caught in a painful vice between long-term structural improvements and sudden, severe short-term geopolitical instability 2.
The Global Affordability Matrix
Housing affordability is no longer a localized issue confined to specific high-demand coastal cities; it is a synchronized global crisis. However, the exact nature of the financial pain varies significantly depending on the structure of local lending markets, historical zoning policies, and the baseline relationship between property values and median incomes.
The Elite Quality Index (EQx), utilizing its multidimensional Housing Affordability Index (HAI) for 2026, reveals a striking geographic pattern in global real estate. Western and Southern European nations generally perform better on housing accessibility, while major Anglo-Saxon economies (such as the United States, the United Kingdom, Canada, and Australia) and high-cost Asian hubs consistently cluster at the bottom of the affordability rankings 13.
Importantly, the HAI model developed by researchers demonstrates that a high homeownership rate is not necessarily a sign of broad economic prosperity. In many cases, an exceptionally high homeownership rate actually indicates that local rental markets are either entirely unaffordable or structurally unavailable. This dynamic forces citizens to take on massive, life-altering debt simply to secure basic shelter, treating homeownership as an inescapable financial mandate rather than a wealth-building choice 13.
Comparing the Core Anglo-Saxon Markets
To understand the depth of the affordability crisis, it is useful to compare the core English-speaking economies. These nations share similar cultural expectations regarding homeownership but feature vastly different mortgage structures. The following table synthesizes the state of housing across four major Anglo-Saxon economies in early to mid-2026.
| Metric | United States | Canada | United Kingdom | Australia |
|---|---|---|---|---|
| Average/Median Home Price | $420,300 USD (Median) 14 | $695,412 CAD (Avg) 15 | £268,000 GBP (Avg) 89 | $922,838 AUD (Median) 10 |
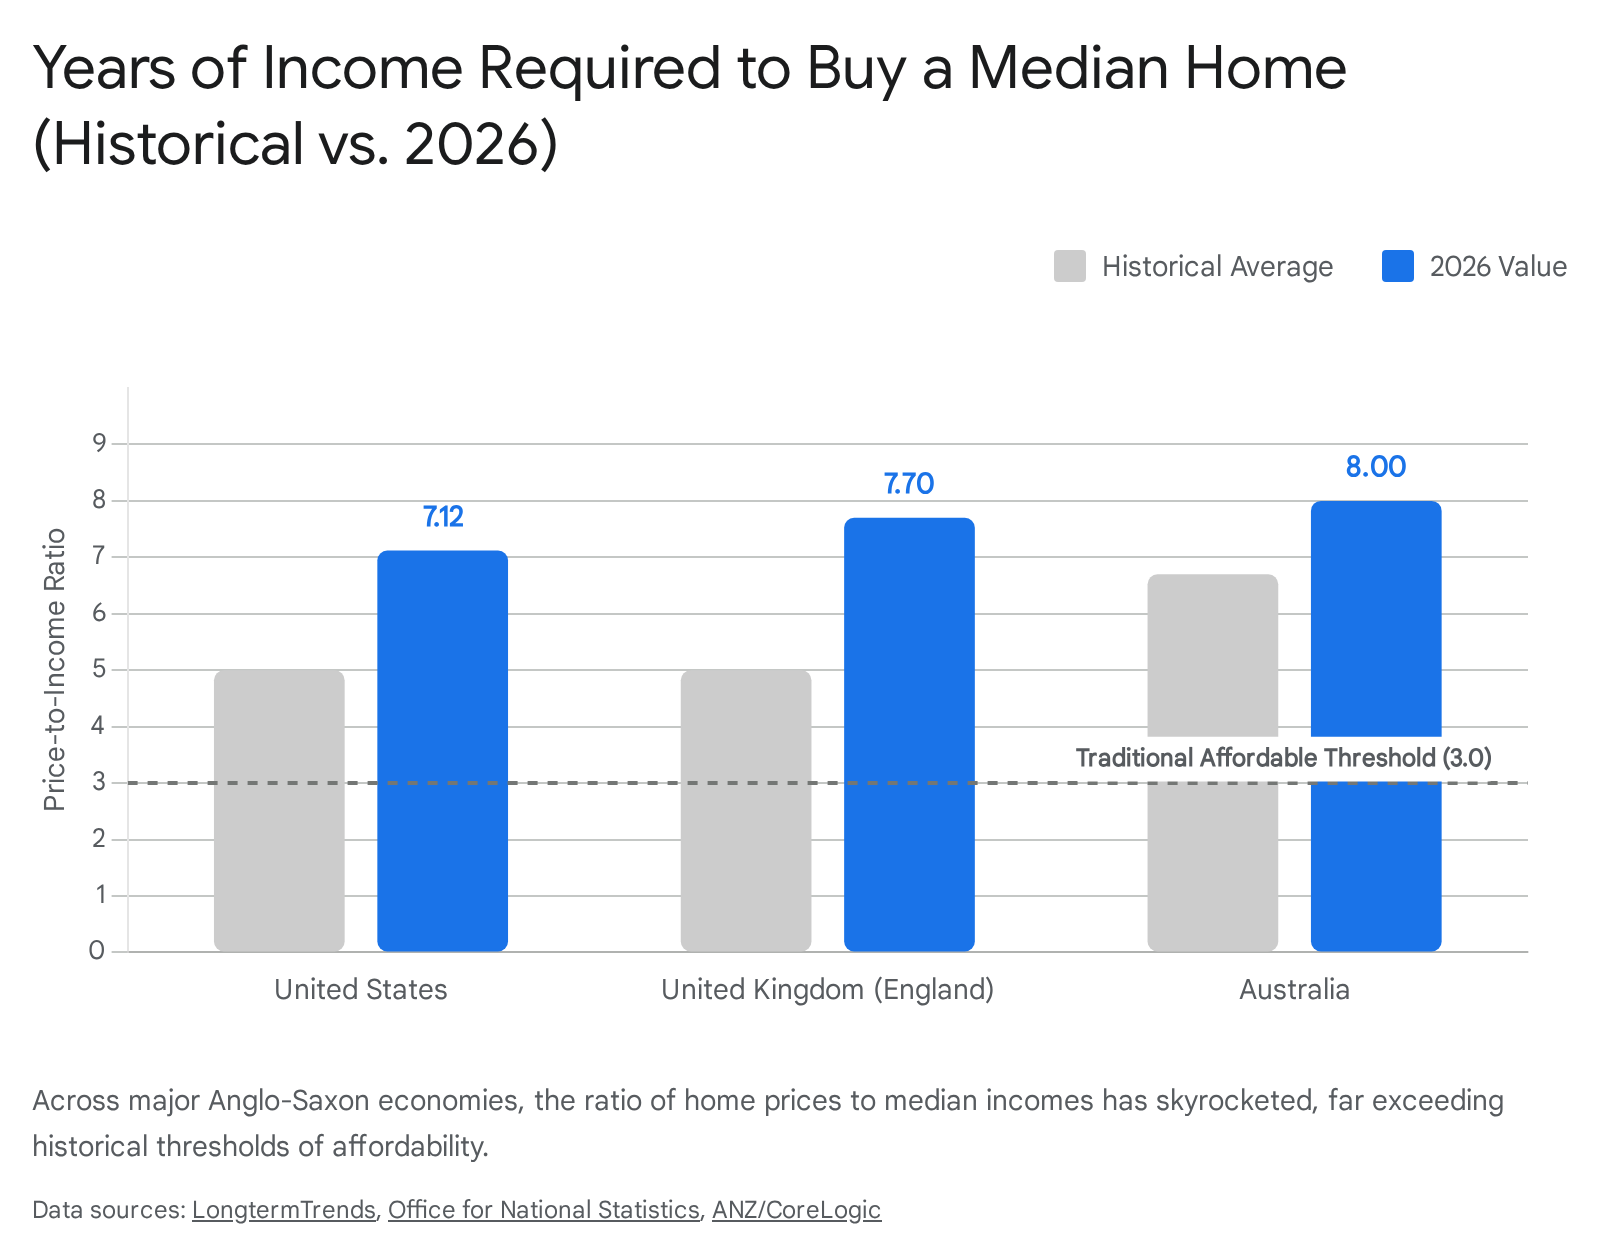
| Price-to-Income Ratio | 5.08 to 7.12x 1411 | ~8.0x+ (varies heavily by city) 12 | 7.7x (England) 13 | 8.0x to 8.9x 1423 |
| Benchmark Mortgage Rate | ~6.44% (30-year fixed) 2 | 4.09% (5-year fixed, best) 15 | ~5.00% (5-year fixed, avg) 15 | 5.92% (Avg outstanding) 16 |
| Mortgage Payment as % of Income | ~35-40% for new buyers | 52.3% (National Avg) 12 | Varies, highly stressed | 45.0% to 50.6% 1423 |
| Central Bank Policy Rate | 5.25% - 5.50% (Expected hold) 5 | 2.25% (May 2026) 2627 | 3.75% (May 2026) 517 | 4.35% (May 2026) 710 |
(Note: Exact figures fluctuate monthly based on localized data reporting; this data represents Q1/Q2 2026 snapshots and relies on blended national averages that often obscure extreme un-affordability in major metropolitan centers).
The United States: The Lock-In Effect and the Widening Wealth Gap
In the United States, the story of 2026 is one of a deeply frozen, two-tiered market characterized by an impenetrable barrier between those who already own property and those who wish to buy. The fundamental issue driving this crisis is the extreme and historical divergence between home price appreciation and household wage growth.
Between 2019 and 2024, the median U.S. home price surged 31%, climbing from $321,500 to $420,300 14. During this exact same five-year window, median household incomes rose just 22%, from $68,700 to $83,730 14. This meant that in just half a decade, home prices grew nearly one and a half times faster than the wages required to pay for them.
Taking a longer historical view, the disconnect becomes even more severe. Since 1980, U.S. home prices have climbed an astonishing 551%, while incomes have grown only 373% 14. If household incomes had actually kept pace with the appreciation of home prices over the last four decades, the median American household would be earning $115,224 today, rather than the actual reality of $83,730 14.
Consequently, the national home-price-to-income ratio sits at 5.08, and by some measures utilizing the Case-Shiller index - which tracks the price changes of existing single-family homes using a repeat-sales method to provide a quality-controlled view of the market - the ratio is as high as 7.12 1411. This is nearly double the 2.6 ratio that financial experts historically recommend as the maximum threshold for housing to be considered safely affordable 14. Historically, an American home cost around 5 times the yearly median household income; pushing past 7 is an anomaly previously only seen at the absolute peak of the 2006 housing bubble 11.
The Golden Handcuffs of Low Rates
Despite these staggering prices and the highest mortgage rates in two decades, the United States is not experiencing a massive wave of forced selling, foreclosures, or price crashing. The primary reason is a phenomenon known as the "lock-in effect," which is unique to the U.S. market's reliance on the 30-year fixed-rate mortgage.
During the depths of the COVID-19 pandemic, millions of American homeowners either purchased new properties or refinanced their existing loans, locking in 30-year fixed mortgage rates between 2.5% and 4.0%. According to U.S. Census Bureau data comparing the 2015-2019 period to the 2020-2024 period, mortgaged households' median monthly costs (including the mortgage payment, property taxes, utilities, and insurance) actually remained remarkably flat at $1,963 18. In many high-value counties across the nation - particularly in states like New Jersey, New York, and Maryland - homeowners' monthly costs actually declined due to advantageous pandemic-era refinancing 18.
Because existing homeowners are perfectly comfortable servicing their cheap debt, they refuse to list their homes for sale. Selling would require them to abandon a 3% mortgage and re-enter the market to finance a new home at 2026's rate of roughly 6.44% 2. This dynamic chokes off the supply of existing homes for sale, starving the market of inventory. This artificially restricts supply, keeping prices near record highs for first-time buyers, who are forced to absorb both the record-high sticker prices and the elevated borrowing costs without any of the equity cushion enjoyed by existing owners.
Canada: The 2026 Mortgage Renewal Shock
While homeowners in the United States enjoy the protection of 30-year fixed rates, the Canadian housing market operates on a structurally different foundation, exposing it to acute and immediate interest rate pain in 2026. The vast majority of Canadian mortgages operate on five-year terms, meaning the interest rate is only locked in for a maximum of 60 months before the borrower must renegotiate with their lender at prevailing market rates.
This structure means that loans originated at the absolute bottom of the interest rate cycle in 2020 and 2021 are now maturing in the high-rate environment of 2025 and 2026. According to the Canada Mortgage and Housing Corporation (CMHC), approximately 1.2 million mortgages were scheduled to renew in 2025 - the largest single-year cohort on record 30. The 2026 cohort is facing a similarly massive renewal wave. Borrowers who secured rock-bottom rates between 1.5% and 2.5% during the pandemic are now being forced to renew at five-year fixed rates currently hovering between 3.79% and 4.29% 30.
The financial shock of this adjustment is severe. For a Canadian household with a $500,000 outstanding mortgage balance originally signed at 1.75%, renewing at 4.00% translates to an estimated payment increase of $573 per month, assuming a standard 25-year remaining amortization 30.
Stretched Serviceability and the Stress Test
This renewal wave is slamming into a population already carrying an immense, historically unprecedented debt burden. Total outstanding residential mortgage debt in Canada reached $2.3 trillion CAD in late 2025 30. Mortgage debt now represents approximately 74.5% of all Canadian household debt, and equates to roughly 73% of the nation's total Gross Domestic Product (GDP) 30. A decade ago, mortgages represented a much smaller 67% share of household debt 30.
Overall housing affordability in Canada remains deeply stretched. The national average home price in April 2026 was $695,412 CAD 1531. Nationally, the Mortgage Payment as a Percentage of Income (MPPI) sits at an alarming 52.3% 12. To put this in localized perspective, in the notoriously expensive market of Vancouver, the price of a typical representative home requires a staggering 72.0% of the median pre-tax household income just to service the monthly mortgage payment 32. Even in comparatively affordable markets like Montreal, the burden remains high at 44.1% of income 32.
Despite a slowing domestic economy and cooling local inflation, the Bank of Canada opted to hold its overnight rate steady at 2.25% through May 2026 2627. The central bank's governing council explicitly cited concerns over global trade disruptions and inflationary pressures stemming from the Middle East as reasons to delay any anticipated rate cuts 19.
This monetary policy stance leaves Canadian buyers stuck dealing with a harsh federal "stress test." In Canada, borrowers must prove they can afford their mortgage not at the actual contract rate they are offered, but at a heavily inflated qualifying rate. Mortgages are stress-tested at the higher of the standard qualifying rate (currently 5.25%) or the borrower's contract rate plus 2% 26. With the lowest available high-ratio 5-year fixed rates sitting at roughly 4.09% in the spring of 2026, borrowers must prove to lenders they could survive interest rates exceeding 6%, severely curtailing their maximum purchasing power and locking many first-time buyers out of the market entirely 26.
The United Kingdom: A Tale of Two Tenures
In the United Kingdom, the housing narrative of 2026 is defined by a stark, widening inequality between those who own their homes outright and those who are trapped in the private rental sector.
The Bank of England (BOE) held its base rate at 3.75% following its May 2026 monetary policy meeting 517. During his public remarks, BOE Governor Andrew Bailey noted that while domestic inflation had shown some signs of softness, the central bank was actively tolerating slightly above-target inflation in the short term. This tolerance was necessary because the external shocks from global oil prices, driven by the conflict in the Middle East, were beyond the BOE's immediate control, and aggressively hiking rates further could crush the real economy 36.
However, Bailey warned that a 60-day ceasefire in the Middle East would not be enough to ease monetary policy, as the underlying risk of energy disruption remained too high 5. Consequently, market expectations of two rate cuts in 2026 evaporated. Swap rates - the financial instruments used by markets to bet on future interest rates - actually began pricing in a potential rate hike to 4% by the end of the year 35.
This prolonged period of higher borrowing costs is devastating for first-time buyers. The average house price in the UK sits at £268,000 8920. However, first-time buyers are typically pursuing homes priced around £254,750. This represents an increase of 4.3% from the previous year, which is nearly three times the headline rate of overall UK house price growth, indicating that the entry-level market is significantly more competitive and overheated than the luxury sector 15. In London, the barrier to entry is even more severe; the average price of a first-time buyer home has crossed the £500,000 threshold for the first time on record 15.
The Renter's Inflation Trap
While outright homeowners are largely insulated from these macroeconomic shifts, renters are bearing the brunt of the crisis. According to the UK's Office for National Statistics (ONS), overall household costs, as measured by the Household Costs Index (HCI), rose 3.6% in the year to March 2026 35. However, parsing the data by tenure type reveals a heavy disparity: private renters are experiencing notably higher inflation rates than homeowners. Mortgagors and outright owner-occupiers experienced the lowest annual inflation rate of all tenure types at 3.6% 35.
Conversely, average UK monthly private rents increased by 3.4% to £1,377 by March 2026 8. In a vicious economic cycle, high mortgage rates prevent renters from buying homes, keeping them trapped in the rental market. This sustained demand allows landlords to pass their own increased borrowing and property maintenance costs down to tenants. Rising rents continue to absorb an ever-larger share of renters' disposable income, systematically destroying their ability to save the massive deposits required to transition into homeownership 35.
Australia: The Collapse of the Single-Income Buyer
If housing affordability is strained in the Northern Hemisphere, it is fundamentally broken in Australia. The latest data from late 2025 and early 2026 paints a grim picture of a market where the concept of homeownership is structurally detaching from local wages.
The national median dwelling value in Australia stands at $922,838 AUD, with the median value across the combined capital cities exceeding $1,014,401 AUD 10. Meanwhile, modeling from the ANU Centre for Social Policy Research suggests the gross median household income is approximately $101,000 AUD 14. This pushes the national dwelling-value-to-income ratio to an astonishing 8.0x 14. When looking exclusively at detached houses rather than units or apartments, the ratio climbs to 8.9x 23.
The Deposit Barrier and Credit Saturation
The primary barrier to entry in the Australian housing market is no longer just the monthly mortgage repayment, but the sheer volume of capital required to enter the market in the first place. Assuming a generous 15% annual savings rate out of gross income, it now takes the median Australian household 10.6 to 12 years to save a standard 20% deposit for a median-valued dwelling 1423. In ultra-expensive major capitals like Sydney, saving a deposit takes up to 13 years of disciplined saving 14.
Once a buyer actually secures a loan, the serviceability burden is immense. Driven by a Reserve Bank of Australia (RBA) cash rate that was hiked to 4.35% in May 2026 4710, more than half (50.6%) of the median household income is required to service a new home loan on a median-valued dwelling 1423.
A deep historical analysis reveals the structural mechanisms of how Australia reached this point of extreme un-affordability. Prior to the deregulation of the Australian banking sector in the 1980s, credit was strictly rationed based on an applicant's savings history. Banks required 12 to 24 months of consistent deposits, and the typical household faced a strict $25,000 loan limit 36. This severe restriction on credit kept property prices artificially low, anchoring median prices around $32,000 against average earnings of $8,000 36.
As banks deregulated throughout the late 1980s and 1990s, they began factoring dual incomes into their borrowing assessments. As borrowing capacity tripled due to lower interest rates and the inclusion of second incomes, property prices rapidly adjusted upward to absorb these new, higher maximum bids 36. Today, the second income in a household is no longer a path to a better, more luxurious home; it is a strict, mathematical prerequisite for market entry 36.
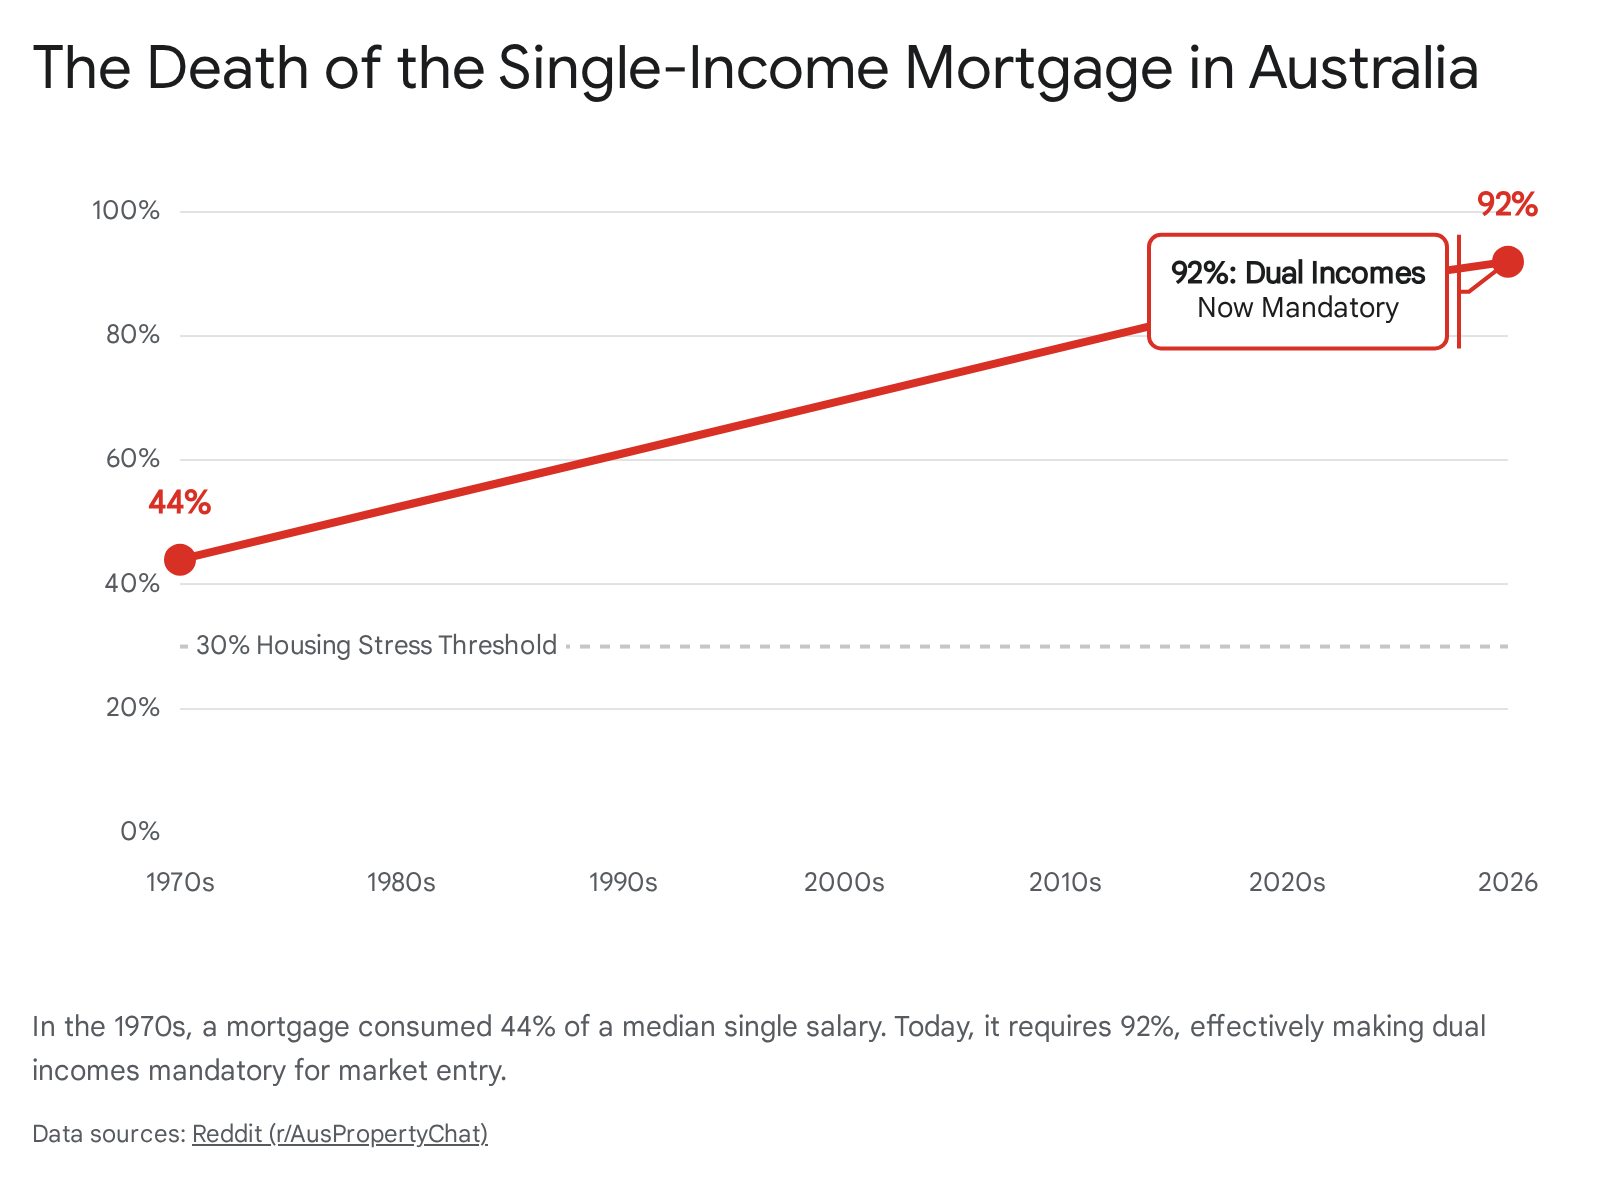
Single-income earners qualify for loans that are 42% smaller than dual-income households with the exact same combined earnings, effectively locking single individuals out of the Australian property market entirely unless they possess significant generational wealth 36.
Demographic Paradoxes: Why Aging Populations Don't Equal Cheap Homes
A common economic assumption is that shrinking, aging populations should naturally lead to an abundance of cheap, accessible housing. However, real-world data from nations like Germany and Japan in 2026 proves that housing markets are driven by highly localized urban demand, construction costs, and credit availability, rather than national birth rates.
Japan: The Era of Zero Interest Ends
Japan is experiencing severe demographic decline, a trend that has resulted in approximately 9 million vacant homes - known as akiya - scattered across the nation 2138. These abandoned properties account for roughly 13% of all residential stock and are heavily concentrated in rural and declining peripheral regions 38. A conventional, high-level economic view would suggest that this massive oversupply should be causing property values to plummet nationwide.
Instead, the Japanese real estate market is radically bifurcated. While rural homes rot, the capital is booming. Tokyo is experiencing a sustained "central-city boom," with prime wards seeing sharp price gains. In 2025, national land prices rose 2.7% - the strongest gain recorded in 34 years 38. Central Tokyo apartments regularly command massive premiums, surpassing 120 million JPY in the most sought-after wards 38. This urban boom is driven largely by institutional investors and foreign buyers seeking safe-haven assets and exploiting favorable currency exchange rates. In 2025 alone, foreigners accounted for 27% of all property purchases in Japan, up from 21% just five years prior 38.
Crucially, the Bank of Japan (BOJ) is finally dismantling decades of ultra-loose monetary policy. In late 2025 and early 2026, the BOJ raised its policy rate to 0.75%, effectively ending Japan's famous era of zero-interest rates 3940.
This monetary tightening has created a highly stratified, two-tiered mortgage market. Highly qualified Japanese citizens and permanent residents can still access variable mortgage rates between 0.3% and 0.8% 22. However, foreign buyers and non-permanent residents are seeing variable rates pushed higher into the 0.8% to 1.4% band due to banks pricing in perceived flight risk 22. Furthermore, benchmark 10-year fixed rates offered by Japan's five major megabanks have surged to over 3.25%, marking the highest borrowing costs the nation has seen since the 1990s 1223.
Germany: The Two-Tiered Rent Trap
In Germany, where homeownership rates are traditionally much lower than in the Anglo-Saxon world, the affordability crisis manifests directly and painfully within the rental market.
Following aggressive rate hikes by the European Central Bank to combat continental inflation, German mortgage rates stabilized between 3.5% and 4.0% for 10-year fixed loans in early 2026 4344. While this might seem affordable compared to the United States, it effectively killed the purchasing power of the German middle class, pushing a wave of prospective first-time buyers back into the rental market. In major economic hubs like Berlin, Munich, and Hamburg, rental demand is now vastly outstripping supply 45.
Berlin's population is approaching 3.9 million and is expected to reach 4 million by 2040, yet the city completes only about 16,000 new apartments annually, falling well short of its 20,000-unit target 43. This severe shortage has created a massive, market-breaking discrepancy between legacy tenants and new movers. State-owned housing companies and large institutional portfolio holders charge an average of €7.00 to €8.50 per square meter for existing tenants 24. However, a tenant signing a new lease for an apartment on the open market in 2026 will face asking rents of €15.80 per square meter, with newly constructed, privately financed apartments asking over €20.73 per square meter 2447.
This massive gap paralyzes the housing market. Older individuals or empty-nesters living in large, rent-controlled apartments refuse to downsize, because a new, much smaller apartment on the open market would actually cost them significantly more than their current arrangement. This stasis prevents young, growing families from accessing appropriately sized housing, artificially restricting the available supply of family homes.
The Supply-Side Illusion: Why We Can't Just "Build More" Quickly
A popular political talking point across all these affected nations is that simply deregulating zoning and rapidly increasing housing supply will crash prices and instantly restore affordability. While increasing the aggregate supply of homes is absolutely necessary for long-term market health, the harsh economic realities of 2026 dictate that new construction cannot provide immediate price relief for average buyers.
The primary barrier to building affordable housing is severe construction inflation. In Japan, builders report that construction material and labor costs are roughly 25% to 29% higher than they were in early 2021, drastically reducing the profitability of new builds 39. In Berlin, the gap between the cost of an existing apartment and a new-build apartment now exceeds €2,000 per square meter purely due to the exorbitant cost of modern construction and energy-efficiency compliance 43.
When the underlying costs of lumber, concrete, skilled labor, and land financing are sitting at record highs, developers physically cannot build "affordable" homes and still turn a profit. Consequently, the vast majority of new supply entering these global markets is priced at a premium to offset development costs. While this adds to the overall housing stock, it does little to alleviate the immediate, crushing cost pressures on first-time buyers or lower-income renters in 2026.
Bottom line
The global housing affordability crisis in 2026 is the result of a macroeconomic trap: pandemic-era liquidity permanently inflated property values, while subsequent geopolitical conflicts - particularly the Middle East crisis - forced central banks to keep the cost of debt highly restrictive to fight off energy-driven inflation. For the foreseeable future, housing markets will likely remain gridlocked. Existing homeowners with fixed low rates will stay put, restricting the supply of available homes, while first-time buyers and renters will continue to bear the brunt of inflation and high borrowing costs. Ultimately, true affordability will not return until there is a sustained resolution to global supply chain and energy conflicts, allowing central banks the economic cover required to meaningfully reduce interest rates.