How Affordable Is Housing in 2026
The United States housing market in 2026 is defined by a deep bifurcation between buyers and renters. While the rental market has seen over two years of consecutive price declines driven by a surge in apartment construction, prospective homebuyers face median home prices near $400,000, mortgage rates hovering around 6.4%, and an unprecedented explosion in "hidden" carrying costs like insurance and property taxes. Ultimately, achieving homeownership now demands a six-figure household income, fundamentally reshaping the geographic and generational boundaries of the American middle class.
The State of Housing Affordability in 2026
Housing affordability is typically measured by a standard threshold: a household should spend no more than 30 percent of its gross income on housing-related expenses, including rent, mortgage payments, utilities, taxes, and insurance 12. When a household exceeds this 30 percent mark, it is classified as "cost-burdened." Those spending more than 50 percent are considered "severely cost-burdened" 1. The cascading effects of severe cost burdens are profound; research demonstrates that low-income families paying over half their income toward housing spend 42 percent less on healthcare and 39 percent less on food than their peers in affordable units 1.
The Macro View: Tracking the Affordability Index
The Federal Reserve and the National Association of Realtors track the macroeconomic balance of earning power and home prices through the Housing Affordability Index (Fixed). An index value of 100 indicates that a family earning the national median income has exactly enough money to qualify for a mortgage on a median-priced home, assuming a 20 percent down payment .
By April 2026, the index sat at 110.6, meaning the typical earner technically had just over the minimum income required to qualify 4. While this figure suggests a functioning market, historical data demonstrates a consistent and severe downward trend in purchasing power over the last decade. In January 2013, the index reached a record peak of 212.8, indicating that median earners had more than double the income necessary to buy a home 4. As prices and rates surged, affordability evaporated, plunging to an all-time record low of 91.6 in June 2024 before managing a slight recovery by 2026 4.
The Math of Homeownership: Prices and Mortgages
The cost of acquiring a home in the United States remains historically elevated. As of April 2026, the median home price nationwide was $396,173, reflecting a 2.4 percent year-over-year increase 5. This upward trajectory is corroborated by the Federal Housing Finance Agency's U.S. House Price Index, which steadily climbed to 709.05 by the close of 2025 3. To put this in historical perspective, the average U.S. sale price in 1971 was roughly $25,225 - equivalent to approximately $195,000 when adjusted for 2024 inflation 4.
Interest Rate Realities
The residential 30-year fixed-rate mortgage - a product created during the Great Depression by the Federal Housing Administration to expand homeownership - is the primary engine of the U.S. housing market 8. After dropping to record lows of under 3 percent in 2021, rates surged as the Federal Reserve battled inflation, peaking near 8 percent in late 2023 8.
By May 2026, mortgage rates had settled into a new stabilization band around 6.43 percent, slightly lower than the 2025 average of 6.66 percent and the 2024 average of 6.90 percent 8. Despite this slight easing, the combination of high principal balances and 6.4 percent interest translates to steep monthly obligations. The national median mortgage payment for conventional loan applicants reached $2,166 in April 2026 9. To comfortably afford a median-priced home in this rate environment, financial analysts estimate that prospective buyers need an annual household income of nearly $117,000 4.
The "Lock-In" Effect and Supply Constraints
These carrying costs have created a bifurcated reality among existing homeowners and prospective buyers. The Federal Reserve notes that the median monthly mortgage cost for households that moved in 2023 or 2024 was $2,020, compared to just $1,500 for the overall population of homeowners 5. This massive $500 monthly premium strongly disincentivizes long-time homeowners, many of whom locked in 3 percent rates during the pandemic, from selling their properties. This phenomenon suppresses housing inventory and keeps property prices artificially high 5.
The Hidden Burden: Non-Mortgage Costs Escalate
Even if a buyer secures a manageable principal and interest payment, the true cost of homeownership extends far beyond the mortgage. In 2026, non-mortgage expenses have reached record highs, fundamentally altering affordability calculations and catching many homeowners off guard.
Data from recent market analyses indicates that the typical U.S. homeowner now spends $15,979 per year - roughly $1,325 per month - on "hidden" costs 1112.
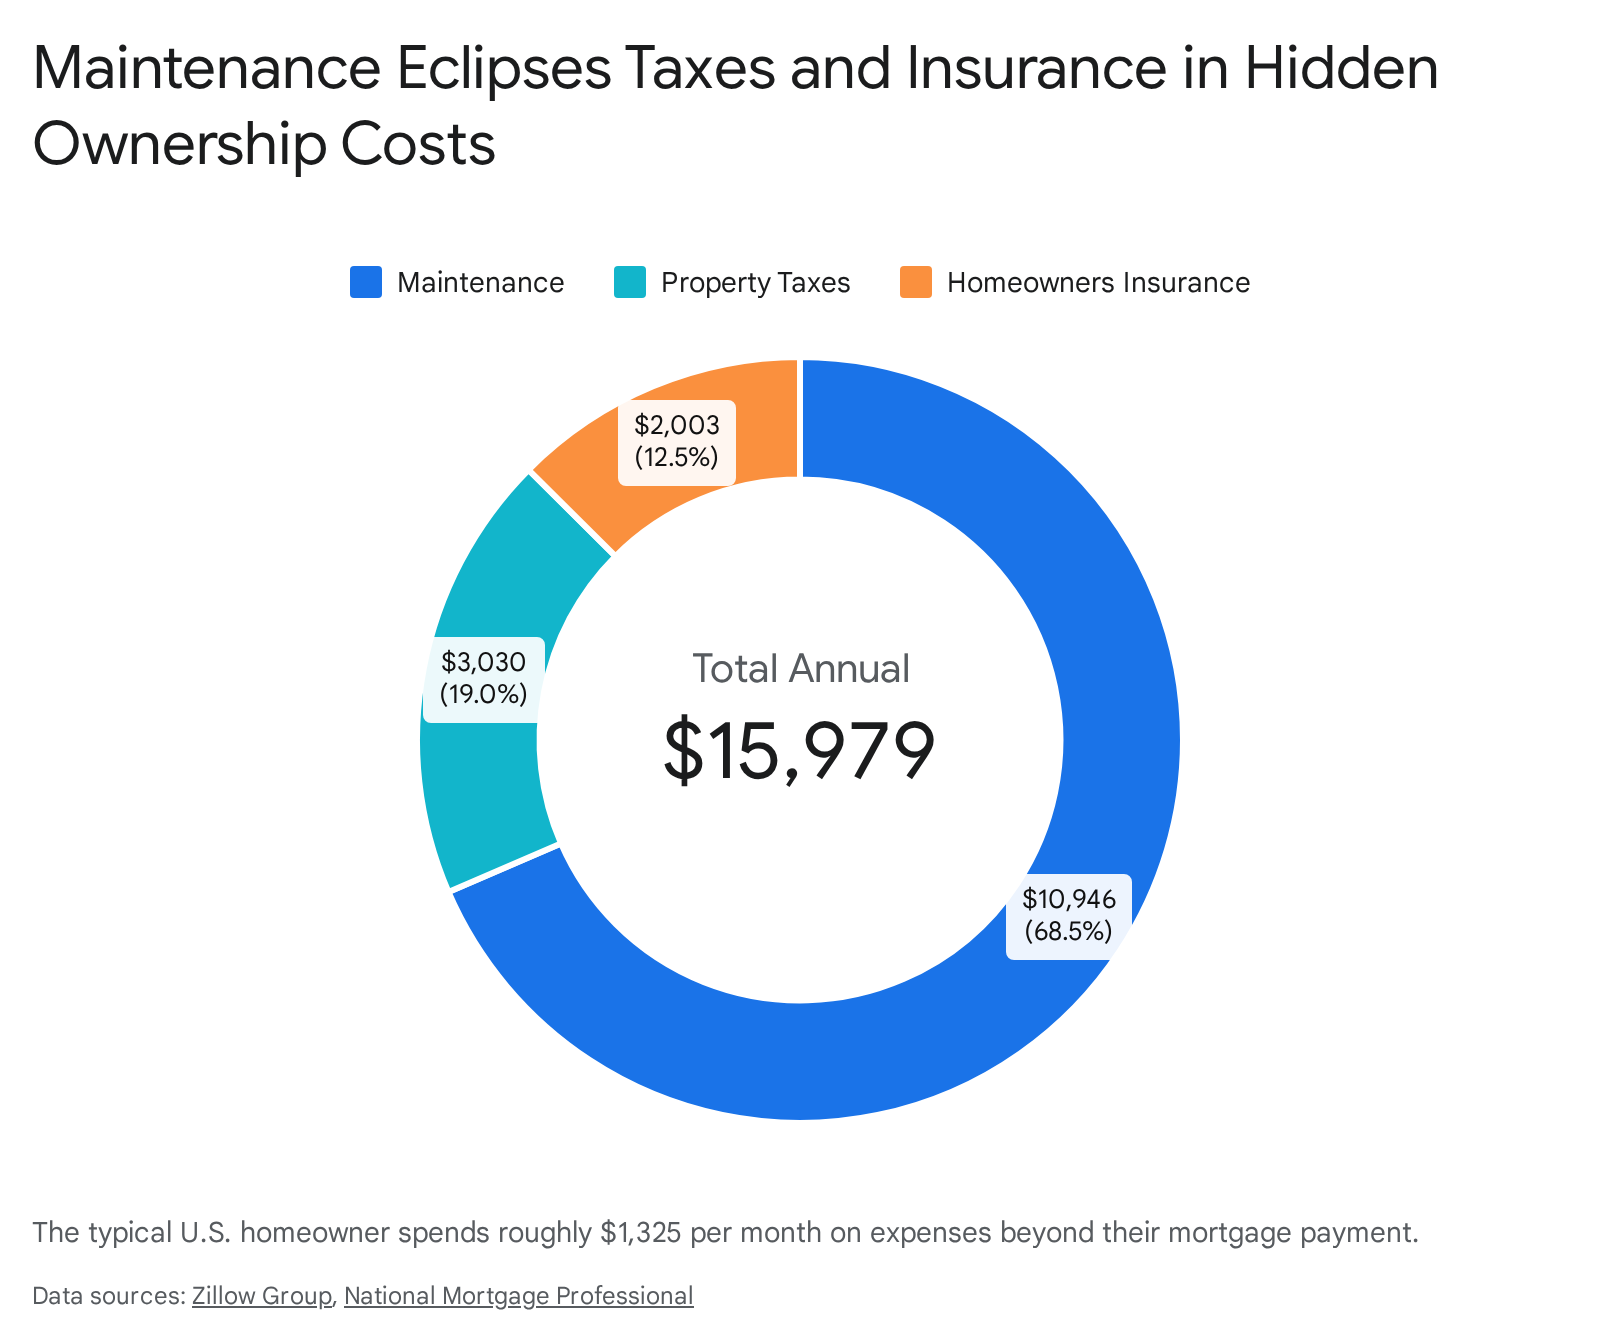
These peripheral expenses increased by 4.7 percent year-over-year into early 2026, significantly outpacing the 3.8 percent rise in household incomes during the same period 1112.
Drivers of Hidden Costs: Maintenance, Taxes, and Insurance
Property taxes and homeowners insurance routinely account for an average of 21 percent of a monthly mortgage payment, as these costs are typically escrowed into the loan 13. Property taxes generally range from 0.8 percent to 2.5 percent of a home's value annually 14. In states like New Jersey, the median property tax bill can reach $9,000 annually, while in lower-tax states like Hawaii, the average is closer to $2,000 6.
However, the most disruptive element in this equation is homeowners insurance. Nationwide, insurance premiums surged by 48 percent between early 2020 and late 2025 1112. In 2025 alone, severe storms, hurricanes, and wildfires cost insurance agencies $101.3 billion, losses that were immediately passed onto policyholders 6.
In coastal and climate-vulnerable regions, the situation is increasingly volatile. In Miami, Florida, annual insurance costs average $4,607 - a staggering 72 percent spike over a five-year span 12. Similar jumps have occurred in New Orleans (79 percent), Tampa (69 percent), Sacramento (59 percent), and Atlanta (58 percent) 12. These soaring costs act as a strict barrier to entry for aspiring buyers and severely strain families already operating at the margins of affordability 12.
Regional Extremes: The Geography of the Housing Market
Because real estate is inherently localized, national averages fail to capture the reality on the ground. A $2,500 monthly housing budget yields vastly different lifestyles across the country. At 2026 interest rates, a $2,500 monthly payment generally secures a loan amount of approximately $400,000, assuming typical property taxes 16.
The geographic disparities are severe. The highest median home values recorded recently include Nantucket County, Massachusetts ($1.73 million), Teton County, Wyoming ($1.69 million), and San Mateo County, California ($1.60 million) 17. At the opposite end of the spectrum, the lowest median values are found in Stonewall County, Texas ($50,680), and McDowell County, West Virginia ($53,500) 17.
These valuation differences dictate the average monthly mortgage burden state by state. The table below illustrates the stark contrast between the most expensive and most affordable jurisdictions for homebuyers:
| Rank (Cost Burden) | State / District | Median Monthly Mortgage Payment | Market Dynamics 511 |
|---|---|---|---|
| Highest | District of Columbia | $3,181 | Extremely high demand, limited space, premium urban pricing. |
| 2nd Highest | California | $3,001 | Constrained supply, high base property values, high tech-sector wages. |
| 3rd Highest | Hawaii | $2,937 | Geographic isolation, high construction material costs, scarce land. |
| ... | ... | ... | ... |
| Lowest | West Virginia | $1,272 | Older housing stock, lower population density, lower median incomes. |
While coastal hubs consistently rank as the most expensive, recent data indicates that Midwestern and Southern metros are experiencing the sharpest relative increases in new mortgage payments. Among the 100 largest U.S. metros, cities like Akron, Ohio (10.7 percent increase), Toledo, Ohio (9.7 percent increase), and Augusta, Georgia (8.9 percent increase) saw the largest jumps in mortgage burdens year-over-year into 2026 18.
The Rental Relief: A Market in Transition
While homeownership costs have skyrocketed, the rental market has provided a rare bright spot for housing affordability. Following aggressive, double-digit rent growth during the pandemic years of 2021 and 2022, the market reversed course. By September 2025, the U.S. had recorded its 26th consecutive month of year-over-year rent declines for properties with zero to two bedrooms 19.
This cooling effect is almost entirely supply-driven. Apartment complexes commissioned during the pandemic-era housing boom came online at record levels throughout 2024 and 2025, creating a surplus of inventory that forced landlords to compete on price to fill vacancies 20.
Rent Prices and Affordability Gains
Depending on the tracking methodology, the national median asking rent in early 2026 hovered between $1,379 (according to ApartmentList) and $1,607 to $1,703 (according to Rent.com and Realtor.com) 192021. Crucially, rents have remained roughly 3 to 5 percent below their all-time highs set in August 2022 192021.
This price stagnation, combined with steady wage growth, has visibly improved renter affordability. In late 2025, the national rent-to-income ratio fell to 23.4 percent according to Realtor.com data, down from 24.9 percent the year prior 19. Moody's Analytics tracked a similar improvement, noting the ratio had declined to 28.1 percent, nearing pre-pandemic norms after hitting a historic peak of 29.2 percent in late 2022 22.
The divergence between the cost of renting and buying is stark. At the end of the first quarter of 2026, the Mortgage Bankers Association reported that the national mortgage-payment-to-rent ratio fell to 1.35 9. While this represents a slight narrowing of the gap, buying remains 35 percent more expensive than renting a comparable property on a monthly basis.
Income Dynamics and Demographic Disparities
Housing affordability is ultimately a function of local earning power. According to American Community Survey data utilized in 2026, the U.S. median household income is approximately $80,734 to $81,604, depending on the specific rolling average applied 237. However, this aggregate figure masks severe geographic and demographic disparities.
Median incomes range from a high of $109,870 in the District of Columbia and $104,828 in Massachusetts, down to just $59,127 in Mississippi 237. What defines a "middle class" income therefore swings wildly depending on the zip code. In San Jose, California, a household must earn between $98,817 and $296,452 to be considered middle class 25. In contrast, in cities like Cleveland, Ohio, and Buffalo, New York, a household can achieve middle-class status earning just under $35,000 a year 25.
The Generational and Racial Squeeze
Younger buyers face the steepest climb into the market. Generation Z borrowers spend an average of 24.5 percent of their monthly income on new mortgage payments, compared to 20.3 percent for Millennials and 18.2 percent for Generation X 18. Alarmingly, 32 percent of Gen Z borrowers spend 30 percent or more of their income on their mortgage, rendering them technically cost-burdened from the moment they close on their homes 18.
Racial income gaps also deeply influence housing outcomes. The national median income for Asian households is $116,503, while non-Hispanic White households earn a median that is generally higher than the national average. In stark contrast, Black households earn a median of $55,157 7. In major markets like Los Angeles County, 51 percent of Native American households and 50 percent of Latinx households earn below 50 percent of the Area Median Income, severely limiting their access to both the rental and buyer markets without aggressive public subsidy 8.
The Policy Gap: Subsidized Housing and Vulnerable Populations
For the lowest-income populations, the private market is entirely out of reach. The U.S. Department of Housing and Urban Development (HUD) relies on Fair Market Rents (FMRs) to calculate subsidy limits for programs like Section 8 Housing Choice Vouchers 279. HUD calculates these limits using a rolling average of American Community Survey data paired with rent inflation factors 10.
However, a persistent lag remains: because FMRs are based on historical data, they frequently trail behind real-time market rent changes. For 2026, HUD mandated that public housing authorities in metropolitan areas adopt Small Area FMRs (SAFMRs), which set rent limits at the ZIP-code level rather than the broader metro level, aiming for more targeted pricing 279. Despite this, owners and agents report a widening gap where published FMR limits fall short of actual asking rents, making it difficult to place voucher-holding families into available units 9.
The Local and Global Housing Crisis
The lack of affordable housing is an escalating systemic failure. In Los Angeles County, a recent Outcomes Report indicated that the region needs to add 485,667 affordable homes simply to meet the current demand among renter households earning at or below 50 percent of the Area Median Income 1. While the county managed to reduce this shortfall by roughly 2 percent since 2024, it is simultaneously at risk of losing 8,650 existing affordable homes over the next five years due to expiring covenants and conversions to market-rate units 1.
Globally, the situation is classified as a humanitarian emergency. According to the UN-Habitat World Cities Report 2026, up to 3.4 billion people worldwide live without secure, safe, and adequate housing, with over 1 billion individuals residing in informal settlements and slums 11. Driven by macroeconomic pressure, rapid urbanization, and decades of policy inaction, the report estimates that approximately 64 million people were evicted globally between 2003 and 2023 11. The structural issues seen in the U.S. market - zoning constraints, supply deficits, and wage stagnation - are highly visible, localized symptoms of a worldwide failure to treat housing as a fundamental human infrastructure requirement.
Bottom line
In 2026, the housing market is defined by a stark divergence between renting and buying. Renters are experiencing relief due to a historic apartment construction boom that has steadily suppressed asking rents and improved rent-to-income ratios. Conversely, prospective homeowners face a punishing financial environment characterized by median prices near $400,000, sticky interest rates around 6.4 percent, and rapidly escalating hidden costs like insurance and taxes that add nearly $16,000 in annual burdens. Until single-family supply constraints ease or wage growth significantly outpaces asset inflation, homeownership will remain a severe financial strain for all but the highest earners.