Credit Card Debt Statistics and Trends for 2026
Total U.S. credit card debt reached a staggering $1.25 trillion in the first quarter of 2026, driven by an era of record-high interest rates and a prolonged squeeze on household budgets. With average annual percentage rates (APRs) hovering above 21.5%, borrowers are increasingly relying on revolving credit to finance basic survival necessities like groceries and utilities. Consequently, severe delinquency rates have spiked to levels unseen since the 2008 financial crisis, revealing a sharply fractured economy where lower-income consumers and smaller regional banks are bearing the brunt of the financial strain.
The State of U.S. Credit Card Debt in 2026
The macroeconomic landscape of 2026 is defined by a consumer base that has grown deeply reliant on credit. Following years of stubborn inflation and aggressive rate hikes by the Federal Reserve, the sheer volume of revolving debt has fundamentally altered the financial security of the average American household.
Reaching the Trillion-Dollar Milestone
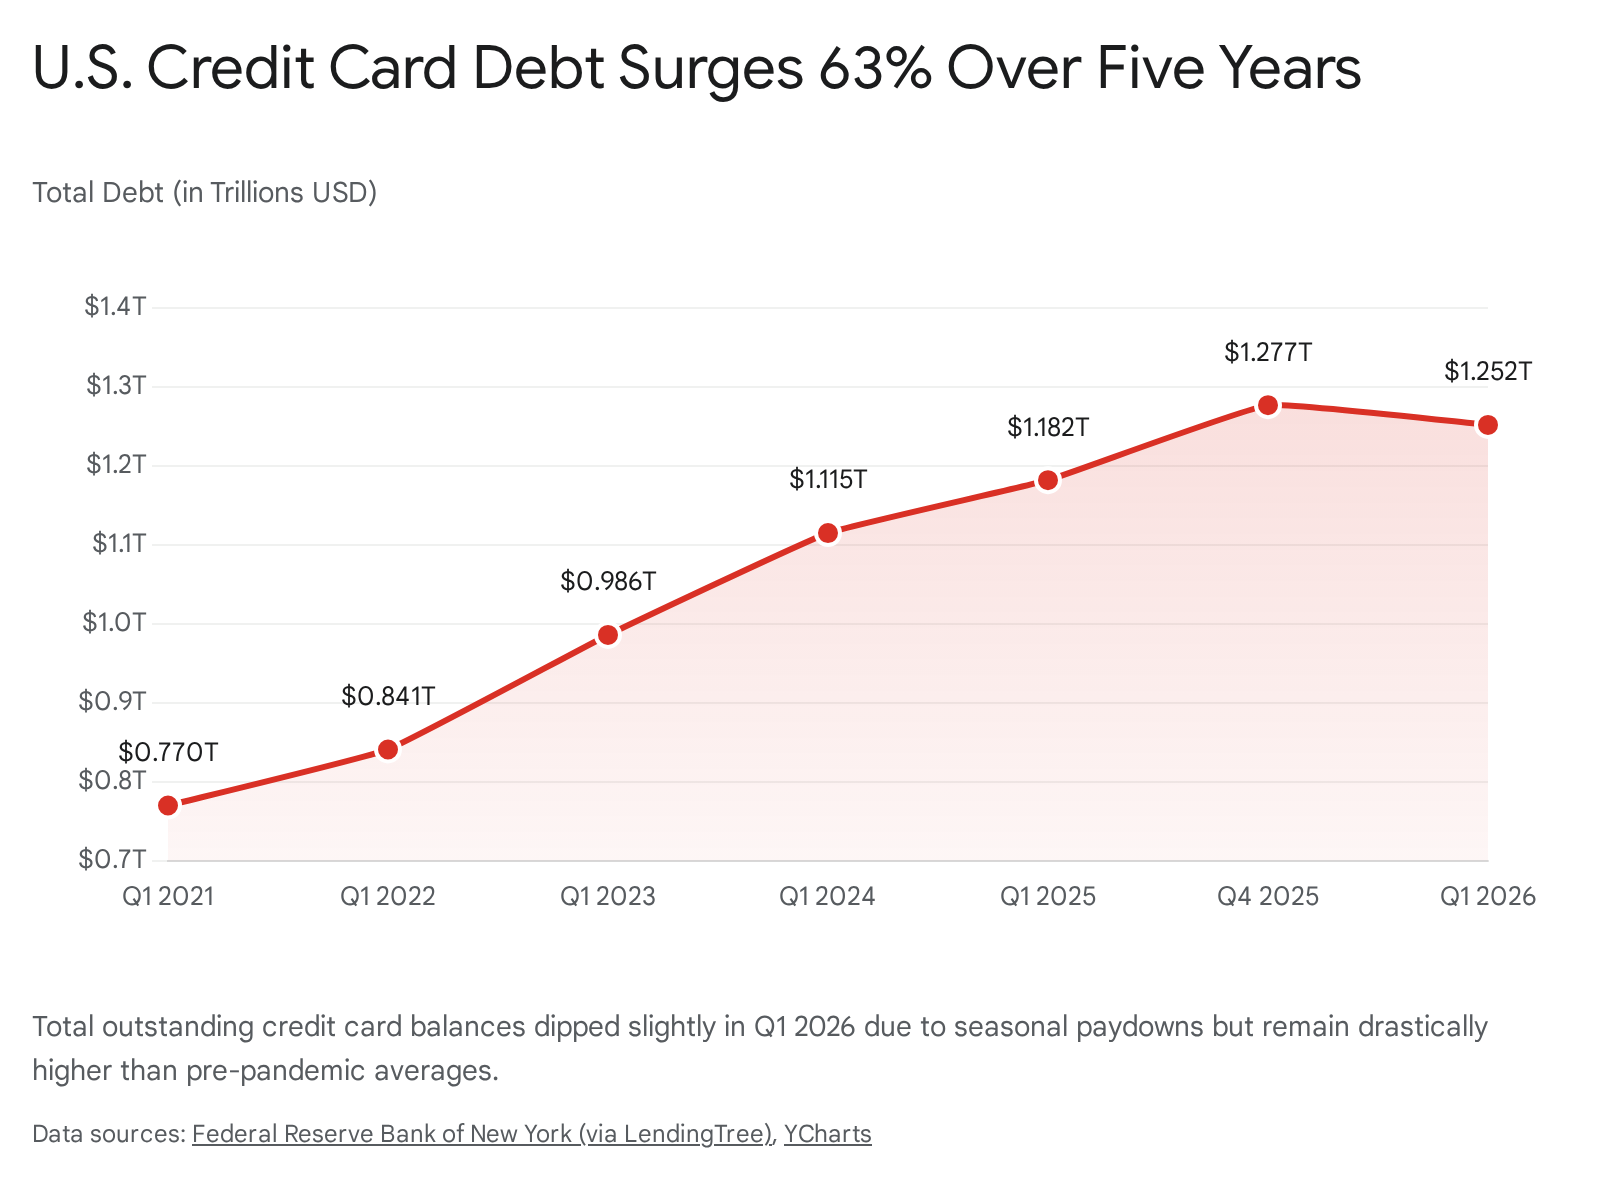
According to the Federal Reserve Bank of New York's Quarterly Report on Household Debt and Credit, total outstanding credit card balances stood at $1.252 trillion in the first quarter of 2026 12. While this represents a slight seasonal decline of 1.96% from the all-time record of $1.277 trillion recorded in the fourth quarter of 2025, the broader trajectory remains sharply upward 22.
Historically, credit card balances consistently fall between the fourth quarter of one year and the first quarter of the next as consumers use year-end bonuses or tax refunds to pay down holiday spending 2. Even with this anticipated first-quarter contraction, the overall debt load remains monumental. Credit card debt has surged by 63% since bottoming out at $770 billion during the pandemic-era low of Q1 2021 12. Today, Americans owe $325 billion more on their credit cards than they did during the pre-pandemic peak in late 2019 12.
This credit card surge is part of a wider expansion in consumer liabilities. Total household debt across all categories - including mortgages, auto loans, and student loans - climbed to $18.8 trillion by early 2026 34. Mortgage balances alone account for $13.19 trillion of that figure, while auto loans reached $1.69 trillion and student loans stood flat at $1.66 trillion 65.
The Household Burden: Averages and Realities
At the individual level, this trillion-dollar macroeconomic metric translates to severe household strain. According to credit reporting agency TransUnion, the average credit card debt per American borrower was roughly $6,519 to $6,715 entering 2026 69. When aggregated by household, the numbers are even steeper. Federal Reserve and consumer credit data indicate that average household credit card debt now hovers between $10,668 and $11,500, depending on the precise measurement methodology and the inclusion of inactive accounts 11.
These averages tell only part of the story, as debt is not distributed evenly. Over 175 million consumers currently carry a balance, but the duration of that debt is lengthening 9. A 2026 Bankrate survey revealed that 61% of cardholders carrying balances have been in debt for at least a year, up from 53% in 2024 78. Furthermore, 31% of debtors have carried their balances for at least three years, and 21% have been in revolving debt for five years or more 7. This shift indicates that credit card debt is transforming from a short-term cash flow buffer into a chronic, long-term financial burden that families struggle to escape.
Methodological Shift: The Transition to VantageScore 4.0
When analyzing 2026 consumer debt data, it is crucial to note a significant methodological change at the institutional level. Beginning with the Q1 2026 Quarterly Report on Household Debt and Credit, the Federal Reserve Bank of New York shifted its primary credit scoring metric from the Equifax Risk Score 3.0 to the VantageScore 4.0 model 69.
This transition was driven by the phase-out of the older Equifax model and a broader industry push toward more predictive analytics 9. VantageScore 4.0 incorporates trended credit bureau attributes - looking at historical payment trajectories rather than just a snapshot in time - and utilizes alternative data to score approximately 33 million more people than traditional models 15.
While the aggregate scoring curves of both models are highly correlated and share the same 300-to-850 range, VantageScore 4.0 has proven to be significantly more sensitive to economic stress 915. For instance, comparative analyses show that VantageScore 4.0 identified up to 49% more mortgage defaults leading into the pandemic period than older legacy models 15. Consequently, as the New York Fed and the Federal Housing Finance Agency (FHFA) fully integrate this model in 2026, researchers have a sharper, more accurate lens through which to view impending consumer defaults before they fully materialize 1510.
What Is Driving 2026's Record Interest Rates?
The sheer volume of credit card debt in 2026 is compounded by the staggering cost of carrying it. Inflation dynamics and monetary policy have fundamentally altered the borrowing environment, punishing consumers who cannot pay their statement balances in full each month.
Average APRs Across the Industry
Credit card annual percentage rates (APRs) operate as a combination of the Prime Rate - which is directly influenced by the federal funds rate set by the Federal Reserve - plus a profit margin set by the issuing bank 11. Because credit cards represent unsecured debt (meaning they are not backed by collateral like a house or a car that the bank can repossess), issuers charge a premium risk margin that currently averages between 12% and 13% 11.
As of May 2026, the average APR across all active credit card accounts stood at 21.00% 12. However, this figure includes consumers who pay their bills in full and never actually incur interest charges. For accounts that are actively assessed interest, the average rate sits higher, at 21.52% 1213.
For consumers attempting to open new accounts, the borrowing environment is even more hostile. Average APRs on new credit card offers climbed to 23.79% in May 2026, effectively ending a brief seven-month stretch of minor rate cooling 112. For borrowers with lower credit scores (subprime borrowers), maximum variable rates on new offers regularly push past 27% 12.
Interest rates vary significantly based on the type of card and the institution issuing it. Credit unions historically offer much lower rates than major commercial banks because their non-profit structure allows them to pass savings directly to members 20.
| Credit Card Category | Average APR (May 2026) | Low-End Rate Profile |
|---|---|---|
| Overall New Offers | 23.79% | 20.17% |
| Cash Back & Rewards | 23.81% | 20.18% |
| Travel Rewards Cards | 23.66% | 19.31% |
| Student Cards (Bank) | 22.29% | 17.49% |
| Credit Union Cards | ~14.72% | 12.20% |
| Secured Cards | 26.13% | 26.13% |
Data aggregated from 2026 LendingTree and Experian market reports. Exact rates remain dependent on individual creditworthiness and daily prime rate fluctuations 1220.
The Impact of 21% APRs on Household Budgets
The mathematics of debt repayment at a 21.52% APR are highly punitive. In standard financial modeling, the APR is calculated by factoring in the periodic interest rate against the principal balance over a 365-day year, often compounding daily on credit cards 14.
In practical terms, a household carrying $10,000 in credit card debt pays approximately $2,100 per year strictly in interest charges 22. This means that for families already stretched by the rising structural costs of housing, groceries, and insurance, more than $175 a month evaporates without reducing the principal balance by a single cent 2215.
Analysts refer to this dynamic as "renting the debt." According to the Consumer Bankers Association, while credit card interest is generally a smaller line item in a typical household budget compared to housing or healthcare costs, it severely depletes liquid cash reserves 1524. Roughly 40% of households have less than $1,000 in liquid savings, meaning any unexpected expense - a medical bill or car repair - is immediately placed on a high-interest credit card, creating a self-perpetuating cycle of financial erosion 15.
Macroeconomic Factors Keeping Rates Elevated
The current debt environment is heavily influenced by a persistent gap between wages and living costs. Heading into 2026, roughly two-thirds of U.S. consumers reported living paycheck to paycheck 16. While overall wage growth has occasionally outpaced inflation in aggregate, these gains are not distributed equally. As of mid-2026, prices for basic necessities have remained elevated, with inflation re-accelerating slightly to 3.8% in April 2026 17.
The Federal Reserve has consequently maintained a cautious approach to rate cuts 17. Because the underlying federal funds rate remains high, the Prime Rate stays elevated at roughly 6.75%, establishing a high floor for all consumer borrowing 11. Even if the Federal Reserve were to institute modest rate cuts later in 2026, banks build wide profit margins into their credit card products and rarely pass rate reductions onto consumers quickly, meaning credit cards will remain an expensive financing tool for the foreseeable future 18.
A Tale of Two Economies: Delinquency Trends in 2026
The most alarming statistic in the 2026 credit landscape is the rate at which Americans are falling behind on their payments. Aggregate 30-day delinquencies (early-stage late payments) remained relatively tame at around 2.94% in late 2025, buoyed by a strong labor market 2. However, serious delinquencies - balances that are 90 days or more past due - have spiked dramatically, revealing deep pockets of financial distress.
The Surge in Serious Delinquencies
In the first quarter of 2026, the share of credit card balances at least 90 days past due climbed to 13.1%, up from 12.3% a year earlier 22. This marks the highest quarterly reading since 2011, making it the most severe delinquency environment since the immediate aftermath of the 2008 financial crisis 22.
Crucially, the New York Fed noted that the volume of newly delinquent accounts was largely unchanged from the previous year. This suggests the surge in serious delinquency is not a sweeping wave of new defaults, but rather an intensification of the problem among existing struggling borrowers who have completely run out of financial runway 22.
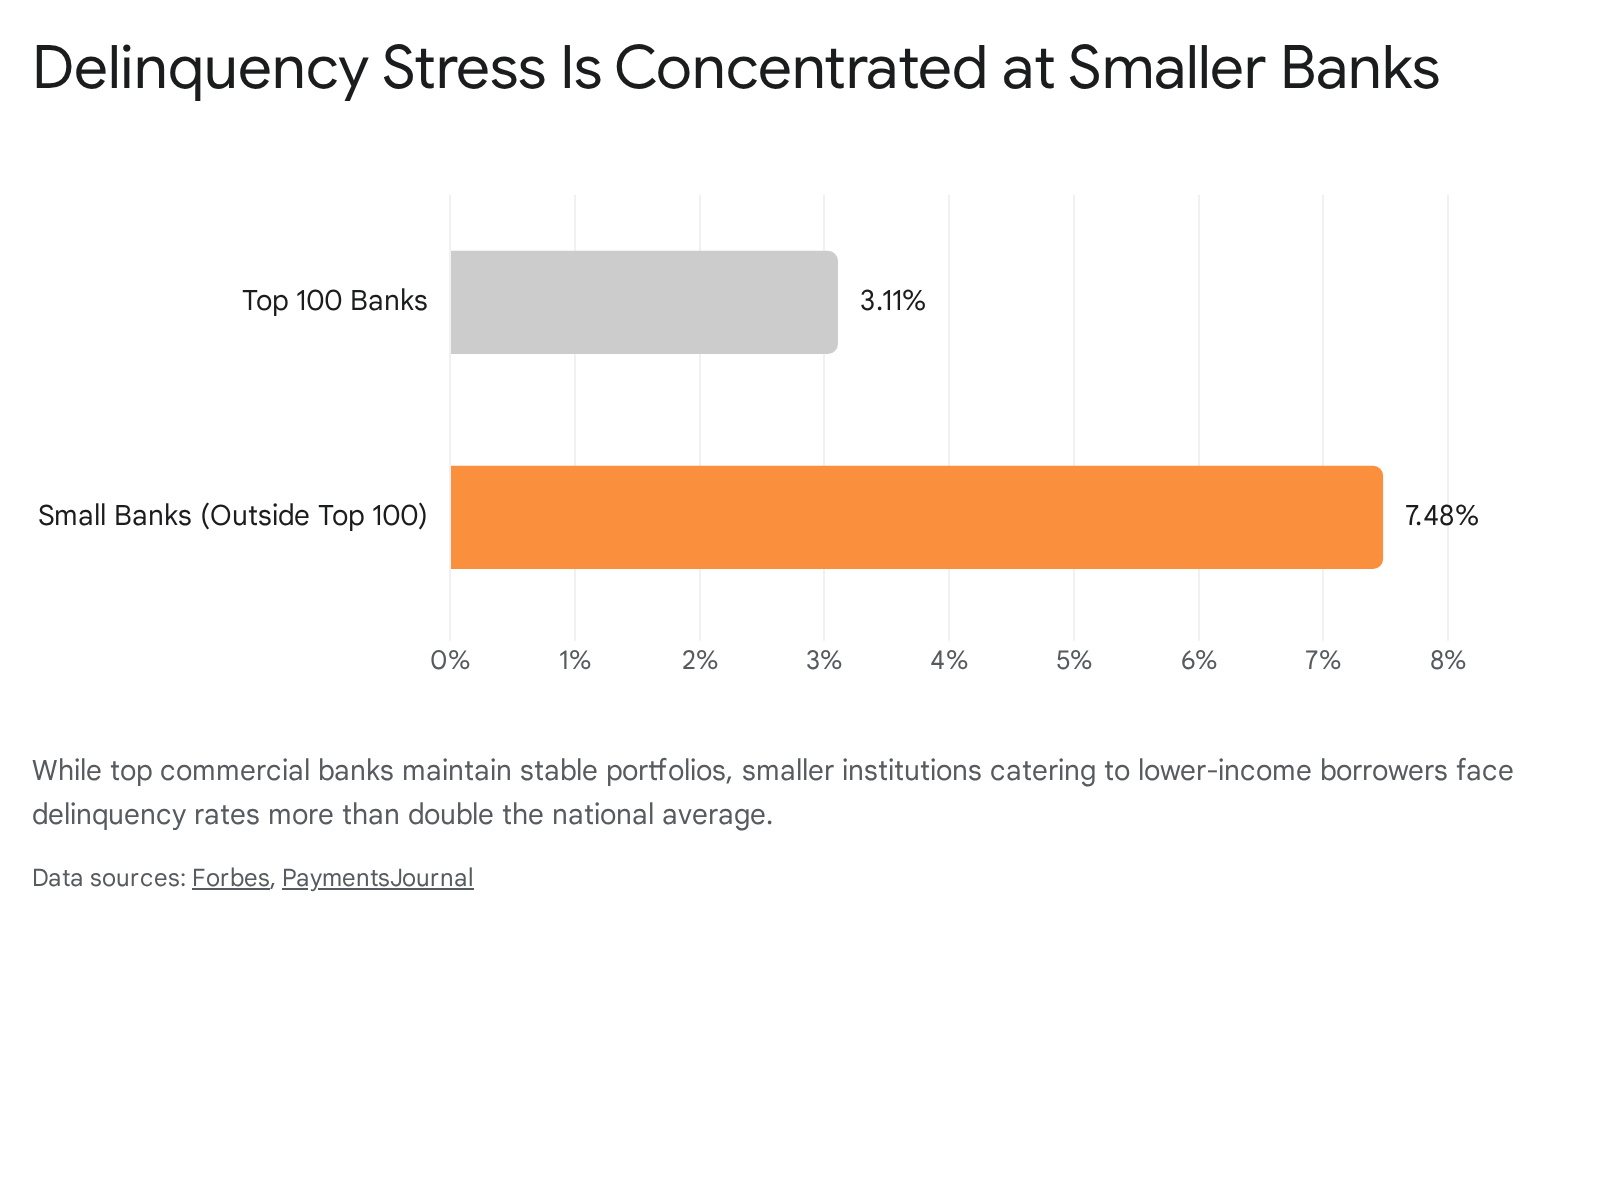
The Bifurcation Between Large and Small Banks
A surface-level reading of national delinquency averages conceals a severe economic bifurcation. The stress in the credit market is highly localized, breaking sharply along lines of income and the size of the issuing institution.
Among the top 100 commercial banks by asset size, the credit card delinquency rate sits at a manageable 2.92% to 3.11% 128. These mega-banks issue 95% of all credit cards in the U.S. and generally cater to higher-income, prime borrowers 28. They also possess massive collection capacities, call centers, and advanced origination analytics that allow them to screen out higher-risk customers effectively 28.
However, at smaller regional banks outside the top 100, the delinquency rate has surged to between 6.43% and 7.48% 128. These smaller institutions cater disproportionately to lower- and middle-income consumers who have exhausted their pandemic-era savings and are increasingly using credit to survive 1.
This bifurcation highlights a broader trend known as "survival debt." A clear indicator of this desperation is the evolving use of Buy Now, Pay Later (BNPL) services. Historically utilized for discretionary retail shopping, BNPL is increasingly used to finance necessities. By 2026, 29% of BNPL users reported using installment loans to buy groceries - more than double the share from two years prior 1. Nearly half (47%) of these BNPL users made at least one late payment in the past year 1.
The Student Loan Spillover Effect
Another major driver of credit card delinquency in 2026 is the downstream effect of federal student loan payments. Following the end of pandemic-related forbearance programs, many borrowers found themselves unable to balance their newly resumed educational debts alongside their credit card and auto loan obligations 29.
In the first quarter of 2026, the student loan delinquency rate for balances 90+ days past due reached 10.3%, returning to pre-pandemic levels 619. The New York Fed's Liberty Street Economics blog identified a massive spillover effect stemming from this cohort. Among newly defaulted student loan borrowers who also hold credit cards, a staggering 56% were past due on their credit card payments 2231. Furthermore, 40% of these borrowers were simultaneously behind on their auto loans 2231.
While researchers note that defaulted student loan borrowers only account for roughly 2% of the total credit market - meaning they are unlikely to trigger a systemic macroeconomic contagion - their struggles represent millions of individuals experiencing total household balance sheet failure 31.
Demographics: Who Holds the Most Debt?
Debt burdens in the United States are not distributed evenly. Depending on a borrower's age, income bracket, and geographic location, their reliance on revolving credit varies wildly, painting a complex picture of consumer health in 2026.
Generational Divides: Gen X Peaks as Gen Z Accelerates
Generation X (those aged roughly 46 to 61 in 2026) currently bears the heaviest average debt burden of any demographic. According to Experian and TransUnion data, Gen X borrowers carry average credit card balances between $9,600 and $11,380 2220. This cohort is navigating their peak spending years, frequently managing a convergence of major financial obligations: massive mortgage payments, the costs of raising children or paying college tuition, and caring for aging parents 22.
Conversely, while Generation Z (those under 30) holds the lowest overall dollar amount in debt, they are accumulating it at an alarming velocity. Gen Z credit card balances surged by 25.1% over a two-year post-pandemic span 33. TransUnion data reveals that 84% of credit-active Gen Z consumers had at least one credit card in late 2023, compared to just 61% of Millennials at the exact same age a decade prior 21. This heavy early reliance on revolving credit has led to higher baseline delinquency rates for young adults entering the workforce 21.
| Generation | Age Range (in 2026) | Average Credit Card Balance |
|---|---|---|
| Generation Z | 14 to 29 years old | ~$3,493 |
| Millennials | 30 to 45 years old | ~$5,649 to $6,961 |
| Generation X | 46 to 61 years old | ~$9,600 to $11,380 |
| Baby Boomers | 62 to 80 years old | ~$6,795 |
| Silent Generation | 81 and older | ~$3,445 |
Note: Averages represent cardholders with open accounts. Data ranges are aggregated from mid-2025/2026 Experian, TransUnion, and FinanceBuzz estimates 222033.
Regional Disparities and State-by-State Debt
Location heavily influences household debt loads, correlating closely with regional costs of living, state tax burdens, and housing prices. Borrowers in the Northeast and West Coast generally carry the highest absolute balances. Residents in the District of Columbia, Connecticut, Maryland, and New Jersey average well over $9,000 in credit card debt 26.
However, the states experiencing the fastest growth in credit card debt are shifting rapidly. According to a late 2025 analysis by WalletHub, Maine led the nation in consumer debt accumulation, with credit card balances jumping nearly 8% in a single quarter 22. Washington state also saw explosive growth, with average card balances growing by an alarming 11.8% year-over-year 2. Other states seeing double-digit percentage increases in debt include South Dakota, Nebraska, and Wisconsin 2.
Meanwhile, consumers in Southern states such as Mississippi, Arkansas, and West Virginia carry the lowest average balances in the country (ranging from roughly $4,800 to $5,300) 2. However, researchers at the Bank of America Institute note that the South is beginning to experience a slowdown in consumer spending despite strong localized wage growth, suggesting that rising housing costs and an influx of new residents are beginning to erode the region's traditional affordability advantage 23.
Income Disparities and the K-Shaped Consumer
Underpinning both generational and regional disparities is a stark divide based on income. The U.S. is currently experiencing a "K-shaped" credit environment 9. The top 20% of households - often referred to as "super prime" borrowers - have largely absorbed inflation thanks to diversified assets, strong wage growth, and home equity 2924. They are responsible for nearly two-thirds of all consumption and continue to use credit cards primarily for convenience and cash-back rewards, which now make up the leading share of all general-purpose accounts 2425.
In stark contrast, households in the bottom two income quintiles face persistent gaps between their income and their routine expenses 15. For these borrowers, 30-day delinquency rates climbed from roughly 14.9% in mid-2022 to nearly 22.8% by early 2025 11. The Federal Reserve indicates that without significant wage growth for the bottom 80% of earners, the reliance on survival debt will only deepen 2924.
Strategies for Managing Credit Card Debt in a High-Rate Era
With the combination of record principal balances and 21%+ APRs, consumer financial behavior dictates how quickly borrowers can escape debt. In late 2024, the share of credit card accounts making only the minimum payment rose to 11.12% 11.
The Danger of the Minimum Payment Trap
Credit card minimum payments are deliberately set low to keep accounts in good standing while maximizing bank profits. Lenders usually set minimums at 1% to 4% of the total balance, plus any accrued interest and late fees 39. While making the minimum payment prevents late fees and protects a borrower's credit score from taking a devastating hit, it mathematically ensures that the debt will take decades to clear 39.
For instance, if a borrower pays only a 3% minimum on the national average household balance of ~$6,140 at a 20.13% APR, their payment would start at roughly $184 39. Over the first year, their balance would fall to $5,442 - a principal reduction of just $698 - while costing the borrower $1,395 in interest 39. Left unchecked, this repayment schedule would take over 17 years to complete and cost over $7,280 in interest alone, effectively doubling the cost of the original debt 39.
Financial advisors stress that paying only the minimum sets the stage for a "snowball effect" where compound interest rapidly spirals out of control 4026. Furthermore, maintaining a high balance near the card's limit drastically increases credit utilization, which depresses credit scores and leaves borrowers vulnerable to predatory loan products when emergencies arise 40.
Balance Transfers vs. Personal Loans
For consumers seeking to break out of the minimum payment cycle in 2026, the two primary evidence-based strategies are balance transfer credit cards and personal consolidation loans. Both generally require good-to-excellent credit (typically a score above 670) to qualify for favorable terms 42.
| Feature | Balance Transfer Credit Card | Personal Consolidation Loan |
|---|---|---|
| Typical APR | 0% Introductory APR (then jumps to 20%+) | Fixed Rate (historically ~7% to 15%) |
| Promo/Loan Term | 12 to 21 months | 24 to 60 months |
| Upfront Fees | 3% to 5% Balance Transfer Fee | 1% to 5% Origination Fee |
| Payment Structure | Flexible, but must clear balance before promo ends | Fixed, predictable monthly installment |
| Best Used For | Smaller debts that can be paid off aggressively in < 18 months | Larger debts requiring structured, long-term repayment |
Data aggregated from 2025/2026 financial consolidation analysis 4243.
- Balance Transfer Cards: These cards offer an introductory 0% APR on transferred balances for a period of 12 to 21 months 4344. While they usually require an upfront balance transfer fee of 3% to 5%, they allow 100% of the borrower's monthly payment to attack the principal 43. This is the mathematically optimal choice for disciplined borrowers who have the cash flow to aggressively pay off the entire debt within the 0% promotional window 42. However, if the balance is not cleared before the period ends, the remaining debt is subjected to standard high-interest rates, often negating the initial benefit 43.
- Personal Consolidation Loans: A personal loan provides a lump sum to wipe out the credit cards entirely, converting variable-rate revolving debt into fixed-rate installment debt 27. In 2025 and 2026, average rates on two-year personal loans hovered around 11.57% - significantly lower than the 21.5% credit card average 42. Personal loans are structurally superior for borrowers who need the psychological predictability of a fixed payoff date (e.g., 36 or 60 months) or who have accumulated balances too large to clear within a short 18-month balance transfer window 434446.
Regulatory Landscape: The Fate of the CFPB Late Fee Rule
Efforts by federal regulators to reduce the penalty burden on struggling cardholders faced a massive legal defeat in 2025, ensuring that late fees remain a punitive reality in 2026.
In March 2024, the Consumer Financial Protection Bureau (CFPB) finalized a highly publicized rule intended to cap credit card late fees at just $8 2829. The rule applied to large issuers with over one million open accounts - covering 95% of all outstanding balances - and was designed to slash the industry-standard late fee of approximately $32 2829. The CFPB, under then-Director Rohit Chopra, argued the rule would save 45 million Americans an average of $220 per year, cutting industry fee revenues by $10 billion annually 28.
However, the banking industry fought back immediately. The U.S. Chamber of Commerce, the American Bankers Association, and the Independent Community Bankers of America (ICBA) filed a lawsuit in Texas federal court 2930. The industry plaintiffs argued that the CFPB had exceeded its authority under the Credit Card Accountability Responsibility and Disclosure (CARD) Act of 2009. Specifically, they argued that capping fees at $8 removed the deterrent effect necessary to encourage punctual payments and failed to cover the administrative costs banks incur when managing delinquent accounts 30.
Following a change in administration and the appointment of new CFPB leadership, the agency reversed its stance. In April 2025, the CFPB filed a joint motion with the banking plaintiffs, explicitly acknowledging that its $8 rule was legally flawed and violated both the CARD Act and the Administrative Procedure Act 293031. U.S. District Judge Mark Pittman subsequently granted the motion and officially vacated the rule 29.
As a result of this regulatory retreat, credit card late fees in 2026 remain at their higher, inflation-adjusted historical levels. For the 13.1% of consumers currently facing severe 90-day delinquencies, these recurring penalty fees will continue to accelerate the downward spiral of their household finances 22.
Bottom line
U.S. credit card debt in 2026 is defined by historic extremes - both in total aggregate balances ($1.25 trillion) and punitive borrowing costs (averaging over 21% APR). While top-tier borrowers and mega-banks remain relatively insulated, a dangerous bifurcation has emerged, with lower-income households and smaller regional lenders experiencing severe spikes in delinquency driven by persistent inflation and the resumption of student loan payments. For consumers caught in the crossfire of this K-shaped economy, understanding the true cost of minimum payments and taking decisive action via balance transfers or consolidation loans remains the most viable path to financial stability.