Does the Math Favor Renting or Buying in 2026
In 2026, persistently high mortgage rates and flat property appreciation have made renting mathematically superior to buying in most major markets for time horizons under seven years. However, because homeownership acts as a forced savings mechanism that leverages compound growth, buying still generates greater long-term wealth in roughly eighty percent of American cities over a decade. Ultimately, the optimal choice depends entirely on localized price-to-rent ratios, the buyer's expected length of stay, and the renter's strict discipline in investing their cash-flow savings.
The Macroeconomic Housing Landscape in 2026
The United States housing market in 2026 is defined by high friction and a slow transition toward normalization, following the pandemic-era boom that saw home prices surge nearly fifty percent between 2020 and 2022 113. Economists characterize the current environment as the "Great Housing Reset," a prolonged period marked not by a sudden crash, but by stagnant prices, elevated borrowing costs, and shifting affordability metrics 13. For prospective buyers and renters, navigating this landscape requires a fundamental recalculation of historical financial assumptions.
As of mid-2026, the average thirty-year fixed-rate mortgage fluctuates between 6.1 percent and 6.5 percent, a stark contrast to the sub-three percent rates that defined the early 2020s 1234. While the Federal Reserve enacted rate cuts in late 2024 and 2025 to bolster the labor market, long-term mortgage rates - which are intrinsically tied to bond yields - have remained stubbornly elevated 47. This stickiness is driven in part by the federal government's need to refinance roughly ten trillion dollars in debt, alongside massive capital expenditures by technology titans financing artificial intelligence infrastructure, both of which crowd out other debt and maintain high yields 4.
Consequently, home price appreciation has largely flatlined. Major institutions diverge slightly in their exact figures, but the consensus points to a market moving sideways. Zillow forecasts a meager 0.3 percent to 1.2 percent national home value increase for the year, while Redfin predicts roughly 1 percent year-over-year growth 138. This marginal growth means that homes are becoming slightly cheaper in inflation-adjusted terms, especially as wage growth outpaces home-price growth for the first time since the aftermath of the 2008 financial crisis 137.
Despite this slight improvement in real affordability, a staggering sixty-five percent of U.S. households remain priced out of purchasing a median-priced new home, which currently sits near $413,595 5. The National Association of Home Builders notes that even a $1,000 increase in the median home price pushes an additional 156,000 households out of the market entirely 5. At the same time, inventory is slowly creeping up, reaching roughly 4.6 months of supply 10. This provides buyers with slightly more negotiating power and reduces the frequency of intense bidding wars, but the overall cost of capital remains a massive barrier 310.
For renters, the national average rent sits at roughly $1,643 per month, representing a minor 0.3 percent year-over-year increase 6. However, luxury apartment construction in cities like Chicago has pushed localized rents up faster, reflecting a growing demand for high-end rental units from individuals who are priced out of the purchase market 6. Because homeownership costs have skyrocketed while rent growth has stalled, the immediate cash-flow advantage in 2026 belongs squarely to the renter in almost every major metropolitan area 13.
Deconstructing the Myth of "Throwing Money Away"
For decades, the real estate industry relied on a simple axiom to encourage homeownership: renting is merely throwing money away on someone else's mortgage. In 2026, this oversimplified logic has been thoroughly debunked by financial planners and behavioral economists. The reality is that both renting and buying carry significant unrecoverable costs - expenses that do not build equity and cannot be recouped upon the sale of the asset.
When an individual rents, the unrecoverable cost is simply the monthly rent payment plus the cost of renter's insurance. It is a fixed, predictable maximum cost for housing 112. When an individual buys a home, the mortgage payment is merely the minimum they will pay each month. Homeownership comes with a litany of invisible unrecoverable costs, including mortgage interest, property taxes, homeowners insurance, and ongoing physical maintenance 3137.
In a high-interest-rate environment, mortgage interest is the largest silent drain on wealth accumulation. On a $300,000 mortgage at a 6.1 percent interest rate, a buyer will pay roughly $18,300 in interest alone during the first year of amortization 1315. That equates to more than $1,500 per month of "dead money" that goes directly to the lending institution, contributing nothing to the homeowner's equity position 13. Furthermore, homeowners insurance premiums have surged an average of twenty-one percent in recent years, largely driven by climate risks and escalating replacement costs, adding hundreds of dollars to the monthly unrecoverable burden 8.
The Mechanics of the Five Percent Rule
To objectively compare the unrecoverable costs of buying versus renting, modern real estate investors and financial analysts utilize the "Five Percent Rule." This financial heuristic calculates the hidden, unrecoverable costs of homeownership as an annual percentage of the property's total market value 137910.
The rule breaks down homeownership overhead into three core components. First, property taxes consume roughly one percent of the home's value annually on a national average 910. Second, physical maintenance and routine upkeep require an estimated one percent of the property's value per year to prevent degradation 7910. Third, the cost of capital - the opportunity cost of tying a down payment and equity up in an illiquid housing asset rather than investing it in the stock market - accounts for the remaining three percent, modeled on a conservative risk-premium spread 91019.
| Home Value | Annual Property Tax (Est. 1%) | Annual Maintenance (Est. 1%) | Annual Capital Cost (Est. 3%) | Total Annual Unrecoverable Cost | Monthly Breakeven Rent |
|---|---|---|---|---|---|
| $300,000 | $3,000 | $3,000 | $9,000 | $15,000 | $1,250 |
| $400,000 | $4,000 | $4,000 | $12,000 | $20,000 | $1,666 |
| $500,000 | $5,000 | $5,000 | $15,000 | $25,000 | $2,083 |
| $750,000 | $7,500 | $7,500 | $22,500 | $37,500 | $3,125 |
Table 1: Application of the 5% Rule to determine the monthly breakeven point between renting and buying.
To apply the rule in 2026, a prospective buyer multiplies the purchase price of a home by five percent, then divides by twelve to establish the monthly breakeven point. If a buyer is evaluating a $400,000 home, the unrecoverable costs are estimated at $20,000 per year, or $1,666 per month. If the buyer can rent a comparable home in the exact same neighborhood for less than $1,666, renting is mathematically superior from a pure unrecoverable-cost standpoint 7910. If the prevailing local rent is higher, purchasing the property begins to make more financial sense.
Regional Divergence and Price-to-Rent Ratios
Because housing markets are hyper-localized, national averages obscure the reality on the ground. The most effective macroeconomic metric for deciding whether to rent or buy in a specific municipality is the Price-to-Rent Ratio. This ratio is calculated by taking the median home sale price in an area and dividing it by the median annualized rent for a comparable property 1121.
The resulting figure indicates how many years of rent it would take to equal the purchase price of the home outright. Analysts segment these ratios into three broad categories to gauge market favorability. A ratio below 15 generally indicates a market where buying is mathematically favorable, as the cost of purchasing a home is cheap relative to the cost of renting 112112. A ratio between 15 and 20 is considered a toss-up, where the decision should be driven heavily by personal factors, timeline, and lifestyle preferences 21. A ratio above 20 heavily favors renting, signaling that homes are disproportionately expensive compared to the local rental market, and capital may be better deployed in equities 2112.
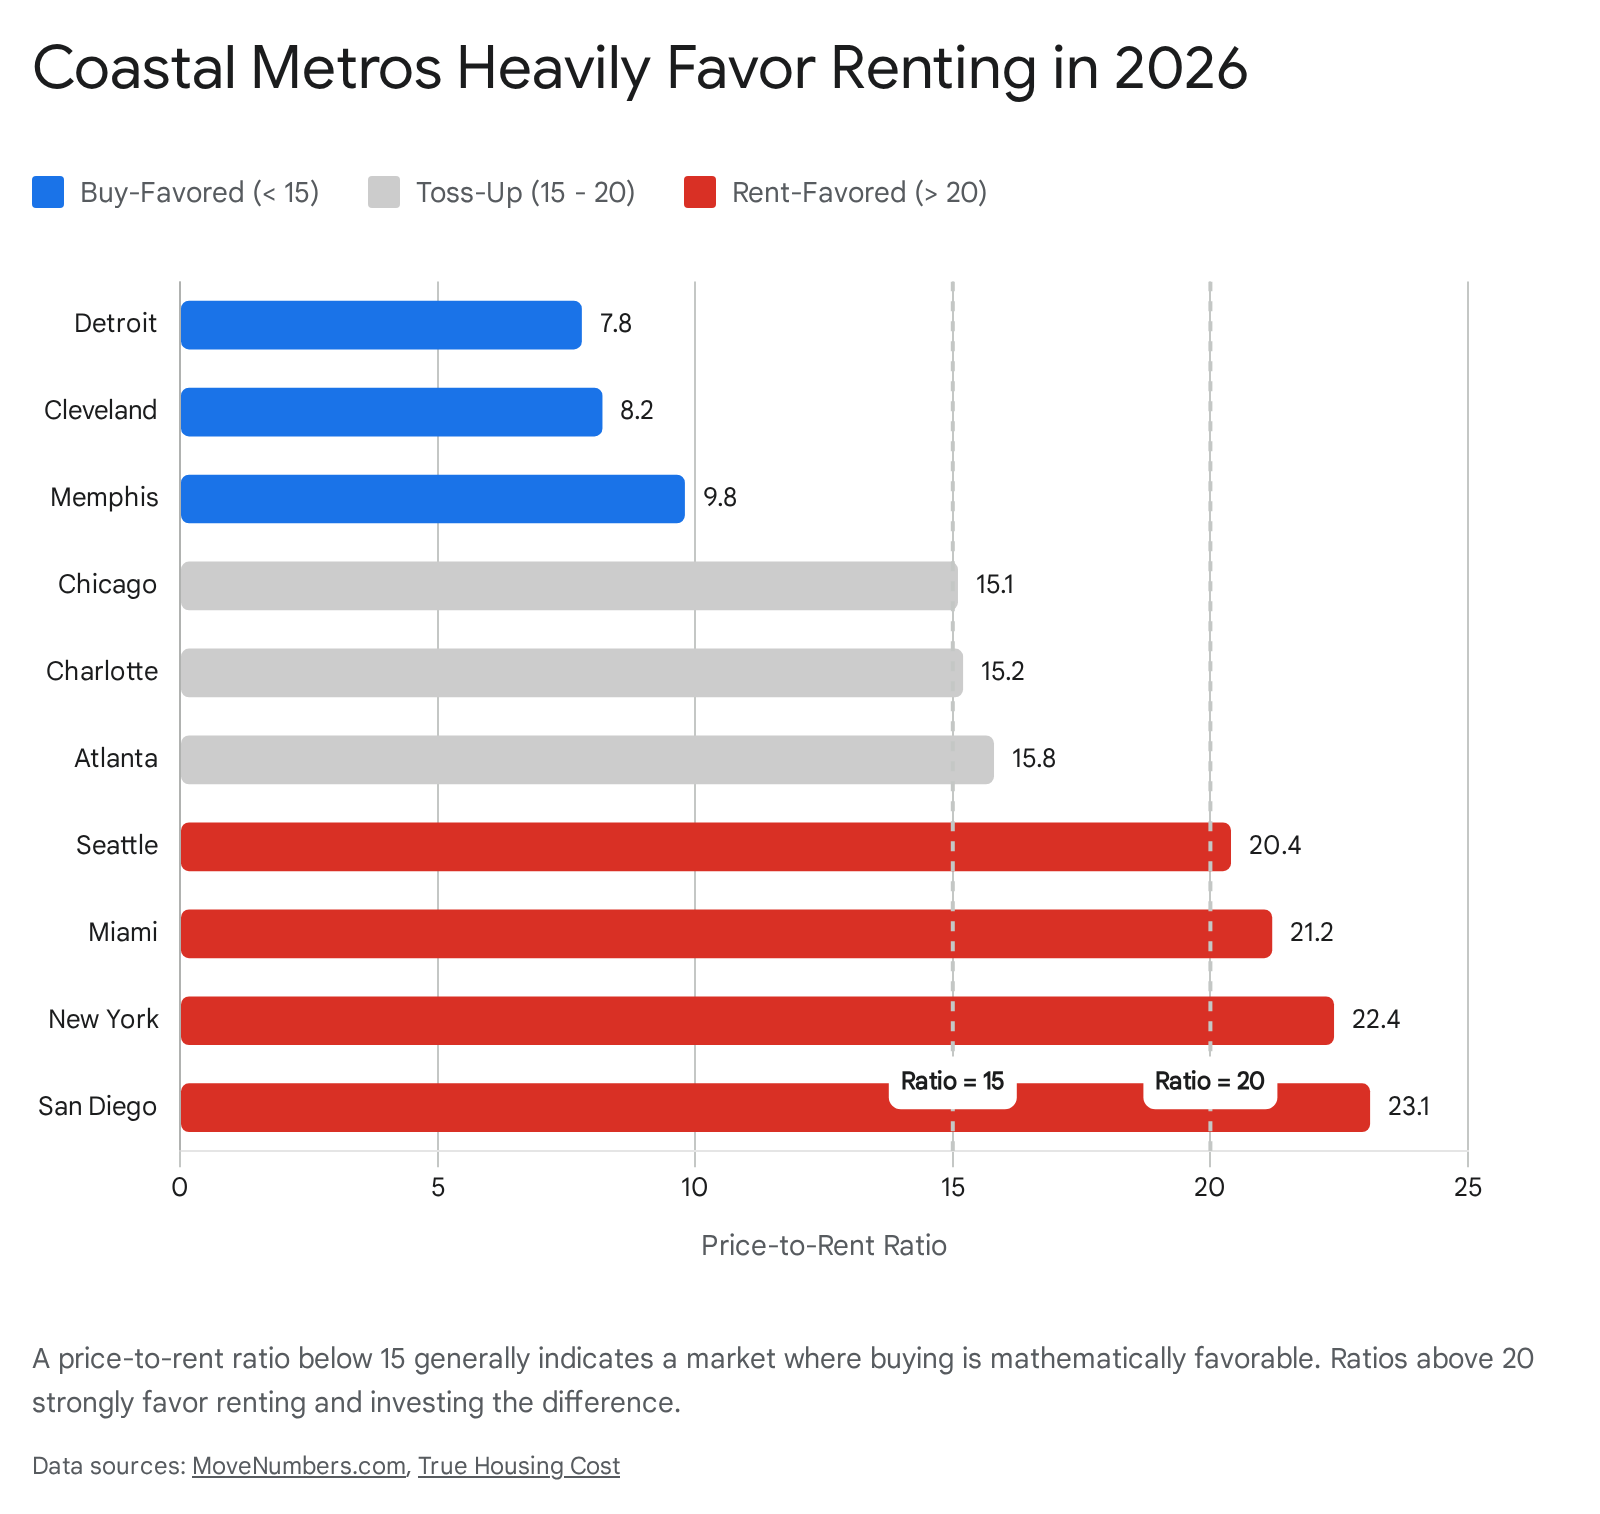
In 2026, the divergence between the Midwest and Rust Belt compared to the Sun Belt and Coastal markets is severe. Cities with stagnant population growth or older housing stock present excellent buying opportunities, while booming technology hubs and coastal havens require buyers to destroy wealth to acquire a home compared to renting 211314.
| Metropolitan Area | Price-to-Rent Ratio | Market Verdict |
|---|---|---|
| Detroit, MI | 7.8 | Strongly Favors Buying |
| Cleveland, OH | 8.2 | Strongly Favors Buying |
| Pittsburgh, PA | 9.5 | Strongly Favors Buying |
| Chicago, IL | 15.1 | Toss-up |
| Atlanta, GA | 15.8 | Toss-up |
| Dallas, TX | 16.1 | Toss-up |
| Denver, CO | 18.4 | Toss-up |
| Seattle, WA | 20.4 | Favors Renting |
| Miami, FL | 21.2 | Favors Renting |
| New York, NY | 22.4 | Strongly Favors Renting |
| San Diego, CA | 23.1 | Strongly Favors Renting |
| Los Angeles, CA | 23.7 | Strongly Favors Renting |
Table 2: Price-to-Rent Ratios by Select U.S. Metros based on early 2026 data 1121.
For households living in a city like Detroit or Cleveland, securing a mortgage is almost universally a superior financial decision, as the monthly cost of owning is actually less than the cost of renting 14. Conversely, in cities like Los Angeles and Seattle, the premium paid to own a home is so extraordinarily high that capital is far better deployed elsewhere, as the ongoing overhead vastly exceeds equivalent rental rates 21.
The Ten-Year Wealth Gap and Renter-Investor Dynamics
While monthly cash flow is a crucial component of household budgeting, true financial analysis requires examining wealth accumulation over a long-term horizon. To answer this, AD Mortgage conducted an exhaustive "10-Year Rent vs. Buy Wealth Study" in early 2026, modeling outcomes across 250 of the most populous U.S. cities 141516.
The study moved beyond the monthly payment debate by tracking two distinct financial paths for an individual who already possesses the capital for a twenty percent down payment. The ownership model assumed the purchase of a median-priced home with a thirty-year fixed-rate mortgage at 6.11 percent, factoring in a 2.5 percent annual overhead for taxes, insurance, and maintenance 141516. The renter-investor model assumed the individual continued to rent a similar property, but aggressively invested their initial down payment capital - along with any monthly cash-flow savings generated by renting rather than paying a mortgage - into an S&P 500 index fund 1516. The stock market returns were benchmarked at a 10.35 percent compound annual growth rate, while home price appreciation was modeled using ten-year localized historical trends 1416.
The findings present a nuanced reality that validates both the pro-homeownership and pro-renting camps, depending entirely on geographic location and individual discipline.
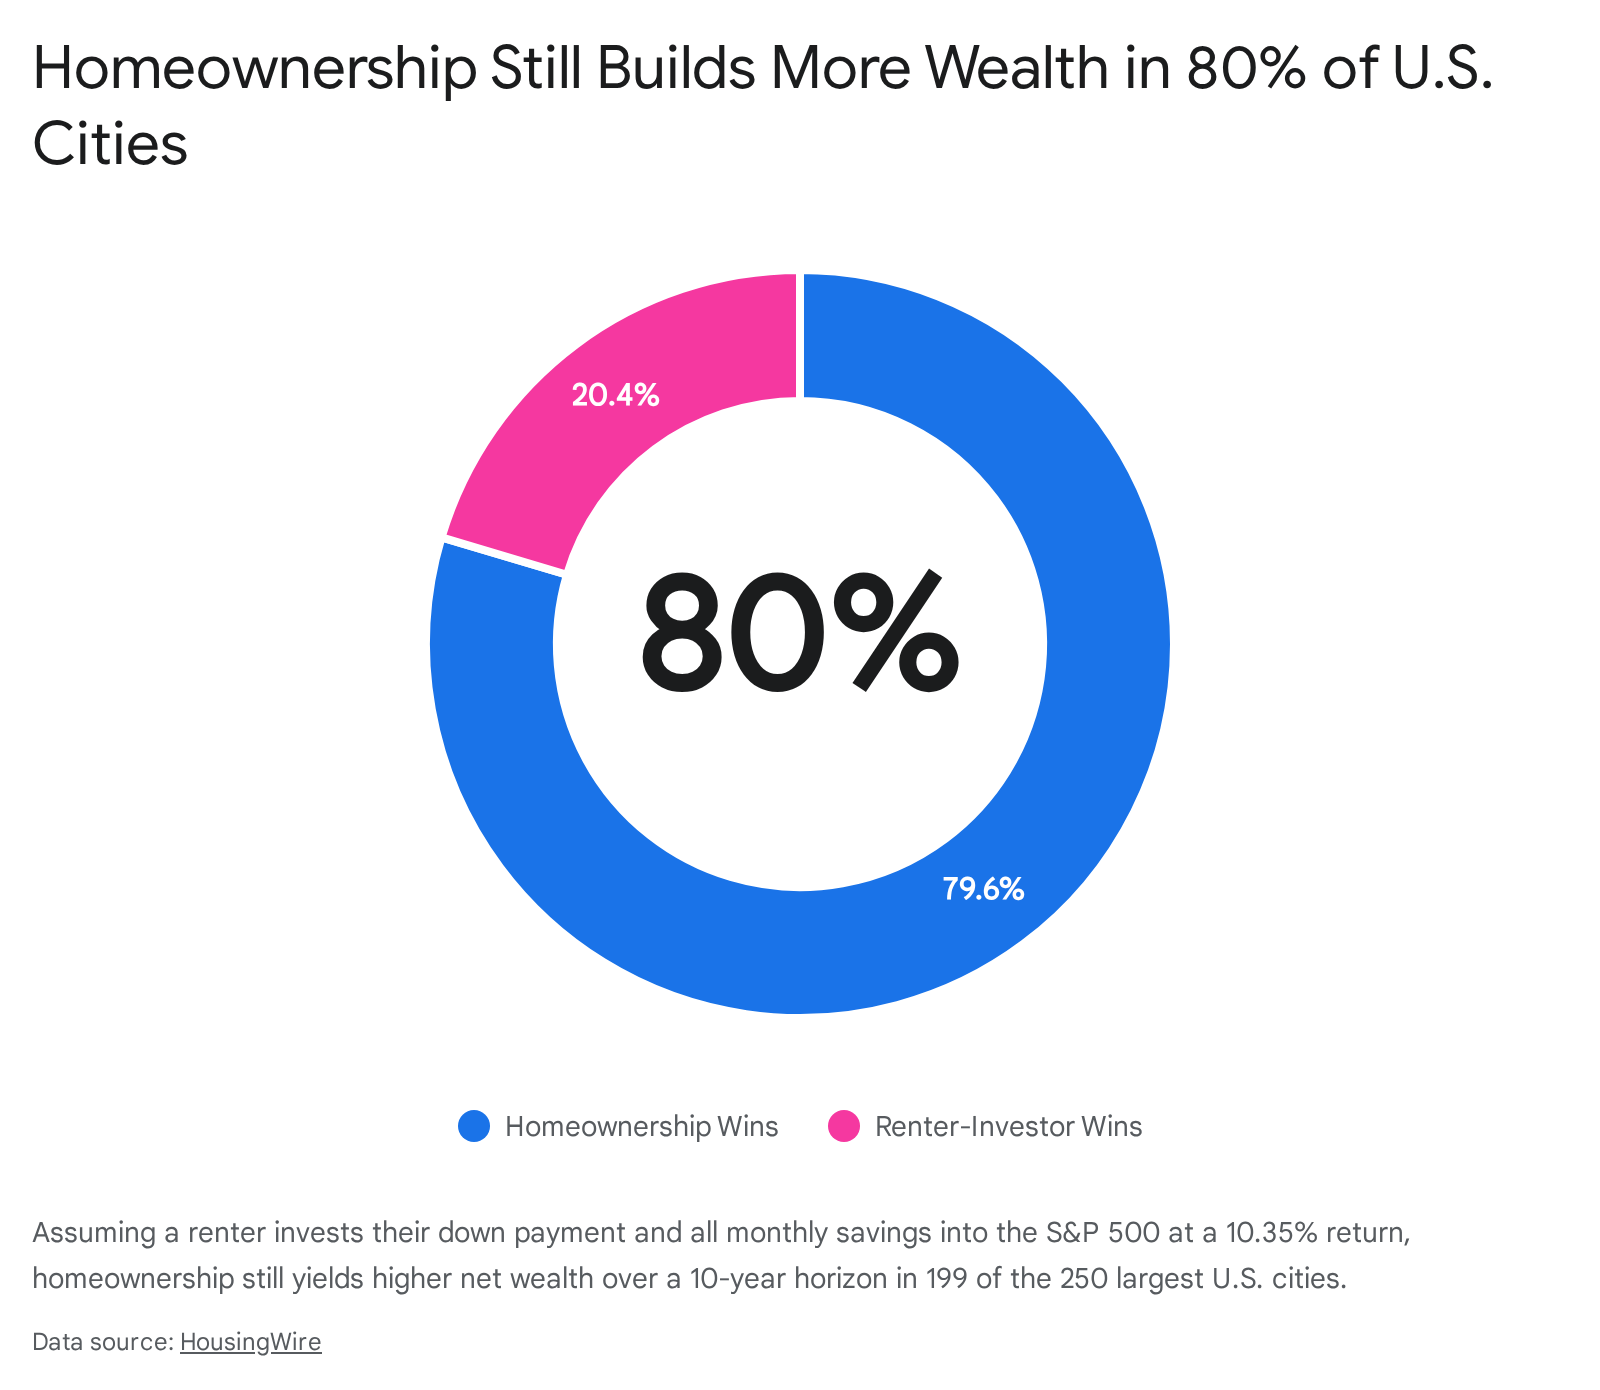
In roughly eighty percent of the cities analyzed (199 out of 250), the homeowner still comes out ahead after ten years, ending the decade with a higher net worth than the renter-investor 14. This dominance is driven by the power of leverage. When an individual buys a $400,000 home with an $80,000 down payment, they receive appreciation on the entire $400,000 asset, not just their initial capital. Even modest two or three percent annual home price growth creates compounding equity gains that are incredibly difficult for an un-leveraged stock portfolio to match 162728.
However, in fifty-one specific markets, the renter-investor path destroys the wealth-building potential of homeownership 14. These are predominantly high-cost, high-ratio coastal markets where the monthly carrying cost of a mortgage vastly exceeds local rents, or low-growth markets where property appreciation drags. In Los Angeles, for example, the study found that a renter who diligently invested their down payment and their monthly rent-to-mortgage savings would end the decade $163,000 richer than if they had purchased a home 14. Similar long-term renter advantages were found in San Jose, San Francisco, Seattle, and Cambridge, Massachusetts 14. Furthermore, low-cost markets in North Dakota also favored renters, driven by relatively modest projected price growth versus the assumed equity market returns 14.
Crucially, the study revealed one absolute baseline: if a renter invests their initial down payment but fails to invest their ongoing monthly cash savings, homeownership wins in all 250 cities analyzed 1415. The renter's mathematical advantage only exists if the cash-flow savings are strictly and consistently diverted into the market.
Behavioral Economics and the Forced Savings Mechanism
This mathematical reality brings the discussion to the psychological cornerstone of housing wealth: the forced savings mechanism. While a spreadsheet can prove that a renter in San Diego will be wealthier by investing in an index fund, behavioral economists note that human beings rarely operate as perfectly rational financial actors 1718.
When a renter saves $1,000 a month by avoiding a mortgage, that capital is highly liquid. Without rigorous discipline, it is frequently absorbed by lifestyle creep, being spent on vacations, vehicle upgrades, or dining out 917. Conversely, a thirty-year fixed-rate mortgage functions as an automatic, compulsory savings account 151920. The homeowner has no choice but to pay their mortgage every month, slowly amortizing the loan and building illiquid equity. Financial illiquidity prevents impulsive consumption.
Macroeconomic data confirms that wealth accumulation for the middle class is almost entirely driven by this dynamic. The Federal Reserve's analysis of household economic well-being indicates that while high-income households achieve wealth through business equity and diversified stock portfolios, the median household's net worth is inextricably linked to housing equity, largely because the mortgage structure forces them to save a portion of their income over decades 192021. Therefore, for individuals who struggle with strict financial discipline, buying a home remains the safest path to wealth creation, regardless of localized price-to-rent ratios.
For highly disciplined investors, however, the opportunity cost of home equity cannot be ignored in 2026. The stock market, driven by heavy capital expenditures in artificial intelligence infrastructure, software, and intellectual property, has delivered robust returns, highlighting the immense difference between liquid and illiquid wealth 222324. When capital is locked in a home, accessing it requires either selling the property or taking out a Home Equity Line of Credit (HELOC). While HELOC rates sit near 7.18 percent in early 2026, borrowing against a primary residence carries a heavy interest burden and puts the collateral at risk if home values decline 2538. By contrast, a diversified stock portfolio provides instant liquidity, allowing the renter-investor to reallocate capital or fund emergencies without the friction of the real estate market 19.
The Death of the Five-Year Rule and Transaction Friction
For generations, the golden rule of real estate was straightforward: if a buyer plans to stay in a home for at least five years, they should buy 39. Historically, five years of steady appreciation was sufficient to absorb the massive friction costs of buying and selling real estate 39. In 2026, due to stalled appreciation and elevated rates, the five-year rule is effectively dead.
Real estate economists now calculate that the financial break-even horizon has stretched to between eight and ten years for the vast majority of new buyers 39. If a consumer purchases a home today and relocates in less than seven years, they are highly likely to lose money compared to renting 283940. This shift is the result of three intersecting friction factors.
First, during the pandemic, buyers could achieve six-figure equity gains in eighteen months, but with national appreciation stalling near one percent, the organic growth needed to offset purchase costs takes significantly longer to accumulate 139. Second, amortization schedules are highly unfavorable in the early years of a high-rate mortgage. At a 6.3 percent rate, the vast majority of the monthly payment goes toward interest, not principal, meaning it takes years before the homeowner builds meaningful equity through payments alone 13.
Third, the sheer weight of closing costs and commissions creates an immediate equity deficit. Buying a home incurs closing costs of two to five percent, covering origination fees, appraisals, title insurance, recording fees, and escrow 414226.
| Closing Cost Category | Typical Cost Range | Description |
|---|---|---|
| Lender Fees | 0.5% - 1.5% of loan | Origination, underwriting, and application processing fees 4244. |
| Title & Settlement | 0.5% - 1.0% of loan | Lender and owner title insurance policies, plus escrow service fees 4244. |
| Prepaids | $1,000 - $4,500+ | Initial cushion for property taxes and the first year of homeowners insurance 4244. |
| Third-Party Fees | $500 - $1,500 | Appraisals, home inspections, and local government recording fees 1542. |
Table 3: Breakdown of typical buyer closing costs which extend the break-even horizon 422644.
This friction has been further complicated by the 2026 Transparency-First Commission Rule. Following landmark antitrust settlements in recent years, buyers are now required to sign written representation agreements outlining their agent's compensation upfront 44. Because sellers are no longer mandated to offer buyer-agent compensation through the Multiple Listing Service, the typical two to three percent buyer's agent fee can easily become an out-of-pocket expense for the purchaser if a seller concession cannot be negotiated 44. On a $400,000 home, this structural change could potentially add an additional $12,000 to the cash-to-close requirement, pushing the break-even timeline out even further 44.
Tax Implications in a High Standard Deduction Era
The mathematical argument for buying historically relied heavily on the mortgage interest deduction, which allowed homeowners to lower their taxable income significantly. However, in 2026, this tax benefit is largely a mirage for the average buyer.
The standard deduction has risen to $29,200 for a married couple filing jointly 15. To benefit from itemizing, a homeowner's combined mortgage interest, charitable donations, and state or local taxes must exceed this high threshold. Furthermore, the State and Local Tax (SALT) cap - which limits the deduction for property taxes and state income taxes to a maximum of $10,000 - severely restricts the tax benefits of homeownership in high-cost states like California, New York, New Jersey, and Illinois 15.
For example, a homeowner in San Francisco with a million-dollar home might pay $12,500 annually in property taxes alone, but they lose $2,500 of that deduction immediately due to the cap 15. While the SALT cap is a subject of ongoing legislative debate regarding its potential expiration at the end of 2025 (which would affect 2026 filings if allowed to lapse), its enforcement has meant that the vast majority of middle-class homeowners simply take the standard deduction 15. Consequently, the tax code currently provides very little distinct financial advantage to owning a primary residence for the average American household.
One minor reprieve in 2026 is the permanent restoration of the Mortgage Insurance Deduction. For buyers with an Adjusted Gross Income below $100,000, Private Mortgage Insurance (PMI) premiums and VA funding fees are once again tax-deductible if they do manage to itemize, lowering the effective cost of low-down-payment mortgages 44.
The Europeanization of the American Housing Market
As the financial and logistical barriers to homeownership climb, the United States is quietly undergoing a cultural shift in its housing norms - a phenomenon industry analysts have dubbed the "Europeanization of American housing" 13. Young Americans, particularly Millennials and Generation Z, are increasingly delaying or abandoning homeownership, either by economic necessity or by active lifestyle choice 13.
In Europe, the cultural mandate to own a primary residence has never held the same weight. Countries like Germany, Switzerland, and Austria have long operated with homeownership rates hovering around fifty percent or lower 1327. In contrast to the U.S., where ownership is viewed as the ultimate financial safety net, European housing markets differ structurally; they feature much larger stocks of subsidized affordable housing, highly regulated tenant protections, and a fundamentally different socio-economic welfare state 2829. In Germany, for instance, where only 43 percent of households own their residence, the rental market is strictly regulated to offer affordable, long-term stability, removing the urgency for young workers to buy a home to secure their future 29.
The United States is beginning to mirror these trends. The American housing mix is diversifying, with build-to-rent communities booming and institutional ownership of rental stock rising to meet the demand of permanent renters 1328. Co-ownership models are also emerging, allowing individuals to purchase fractional shares of properties, further blurring the lines of traditional tenure 13. Furthermore, a significant portion of younger generations cite mobility and lifestyle flexibility as primary reasons for choosing to rent, valuing the freedom to relocate for career opportunities or global travel without the anchor of an illiquid asset 132730.
The Erosion of the American Dream
This shift raises profound questions about whether the "American Dream" is fundamentally changing. Survey data from 2025 and 2026 paints a highly conflicted picture. According to the Archbridge Institute, 69 percent of Americans still believe they have achieved or are on their way to achieving the American Dream, viewing it as a unifying cultural narrative that transcends class and politics 31.
However, when the inquiry is narrowed specifically to housing, pessimism reigns. An IPX1031 study found that 62 percent of Americans believe buying a home in 2026 is entirely unrealistic, up significantly from 49 percent the prior year 32. Among Generation Z respondents, an overwhelming 82 percent stated they could not afford to buy a home, severing the link between hard work and property acquisition 32. Correspondingly, an Entrata survey found that 71 percent of renters believe the definition of the American Dream is actively changing, decoupling holistic success from the possession of a deed 51. The archaic belief that renting is a sign of financial failure is rapidly fading as a new class of high-income lifestyle renters emerges, perfectly content to lease their housing while building wealth in the equity markets 83033.
Psychological Dividends and Residential Stability
While financial mathematics dominate the rent versus buy debate, academic research highlights that housing is deeply tied to psychological well-being. Historically, sociological studies indicated that homeowners experienced higher levels of self-esteem, civic participation, and mental health compared to renters 3435. From a psychological perspective, the perception of the home as a status commodity provided intangible dividends and a sense of rooted belonging 35.
However, modern epidemiological and psychological research adds crucial nuance to this dynamic. A comprehensive review of housing insecurity reveals that the negative mental health impacts historically associated with renting are primarily tied to instability and unaffordability, not the legal status of renting itself 3436. Renters who face constant rent hikes, the threat of eviction, or poor living conditions suffer from measurably higher rates of psychological distress 3436.
Conversely, when researchers control for residential stability, the psychological gap between owners and renters closes almost entirely. Studies show that private renters who maintain stable occupancy in the same unit for five to six years report mental health and psychological well-being scores that are statistically indistinguishable from homeowners 34. The true driver of human flourishing in housing is not the mortgage, but the security of knowing one does not have to relocate against their will. Therefore, for individuals who can secure long-term, stable rental agreements - or live in markets where rent increases are predictable and tenant protections are strong - the psychological pressure to buy a home to achieve peace of mind is drastically reduced 34.
Bottom line
The decision to rent or buy in 2026 is no longer a one-size-fits-all milestone of adulthood, but a highly complex financial calculation. For those living in high-cost coastal markets, or those who plan to move within the next seven years, renting and actively investing the capital savings in the stock market is mathematically the superior path to wealth. However, for those putting down roots in affordable or mid-tier markets, homeownership remains the most reliable engine for middle-class wealth, serving as a powerful forced-savings mechanism that leverages compound appreciation. What remains uncertain is whether the cultural shift toward lifelong renting among younger generations will result in a more economically mobile workforce, or ultimately exacerbate wealth inequality for those who fail to rigorously invest their rental savings.