Why Most Attempts to Go Viral Fail
Most attempts to go viral fail because true person-to-person sharing is a mathematical anomaly, with over 99% of online content cascades terminating after just a single generation. Furthermore, modern social media platforms have shifted away from follower-based distribution toward "interest graphs" that rigorously test content through small initial audiences, algorithmically suppressing any post that does not meet extreme behavioral retention thresholds. Going viral is no longer a matter of building a massive follower count, but rather surviving a brutal, quantitative gauntlet designed to filter out all but the top 1% of digital content.
The Myth of the Viral Cascade
The term "viral" fundamentally misrepresents how information spreads across the internet. In popular culture, going viral is imagined as a biological contagion: one person shares a post with two friends, who each share it with two more, creating a massive, multi-generational chain reaction that exponentially sweeps across the globe. This epidemiological model, often referred to as the Susceptible-Infected-Recovered (SIR) model, assumes that ideas spread evenly through highly connected human networks 123.
However, large-scale empirical studies of digital diffusion networks reveal a much different architectural reality. Pioneering research analyzing over a billion diffusion events on Twitter - tracking the exact propagation structures of news stories, videos, images, and political petitions - demonstrates that the contagion metaphor is deeply flawed 3456. To measure the shape of these phenomena, researchers utilize a metric called "structural virality," which calculates the average shortest-path distance between all pairs of nodes within a sharing cascade 788. A low structural virality score indicates that a piece of content grew through a single massive broadcast, while a high score indicates a deep, multi-generational peer-to-peer chain 456.
The findings completely dismantle the biological contagion myth. Across all domains and platforms, the vast majority of sharing cascades - over 99% - terminate within a single generation 39111011. This means an individual shares a piece of content, their immediate audience sees it, and the sharing stops entirely. Even when content reaches a second or third generation, the average depth of the cascade remains extraordinarily shallow. Complex mathematical modeling of these networks, using multi-type branching processes (MTBP), confirms that the vast majority of social media sharing behaves as a sub-critical cascade, lacking the momentum to sustain exponential growth without continuous external stimulation 211.
Broadcast Popularity vs. True Virality
If 99% of cascades die immediately, how do certain videos or articles accumulate tens of millions of views? The data indicates that massive scale is almost entirely driven by broadcast popularity rather than structural virality 346.
When a piece of content achieves massive popularity, it is usually because a central "hub" - such as a celebrity, a major news outlet, or a massively popular digital creator - broadcasts a link to a vast audience. Tens of thousands of people may re-share the post directly from that original source, but the secondary audience rarely re-shares it further 3. The resulting structural map looks less like a branching tree and more like a single hub with tens of thousands of spokes.
While high structural virality does occasionally occur - most notably in the spread of polarized political misinformation, emotional petitions, or extreme outrage - it remains a statistical outlier 71110. A study on political communication found that true multi-step viral cascades are more likely to cross ideological boundaries and foster political diversity, but these complex contagions represent a minuscule fraction of everyday internet activity 1011. For the average creator or brand, the assumption that posting "highly shareable" content will naturally spark a massive chain reaction ignores the structural reality of how information degrades in social networks.
The Mathematics of Attention: The Power Law
If success is not determined by contagious, person-to-person sharing, what dictates the winners and losers of the digital attention economy? The answer lies in the mathematical distribution of human attention and the algorithms that govern it.
Human intuition is heavily biased toward the normal distribution, colloquially known as the bell curve. In a normally distributed environment, most outcomes cluster around a predictable average, with a few extreme highs and lows trailing off symmetrically. People naturally assume that a moderate amount of effort will yield a moderate, average level of success 1415.
The internet, however, completely defies the bell curve. Digital networks operate on a power-law distribution, frequently referred to as a heavy-tailed or fat-tailed distribution 14121819. In a power-law environment, the concept of an "average" outcome is a mathematical illusion. Instead, a minuscule fraction of the participants captures almost all the rewards, while the vast majority share virtually nothing. When plotted on a graph, a power-law distribution resembles a steep hockey stick lying on its side: a near-vertical spike representing the elite top performers, followed by an incredibly long, flat tail of content that receives practically zero engagement 1518.
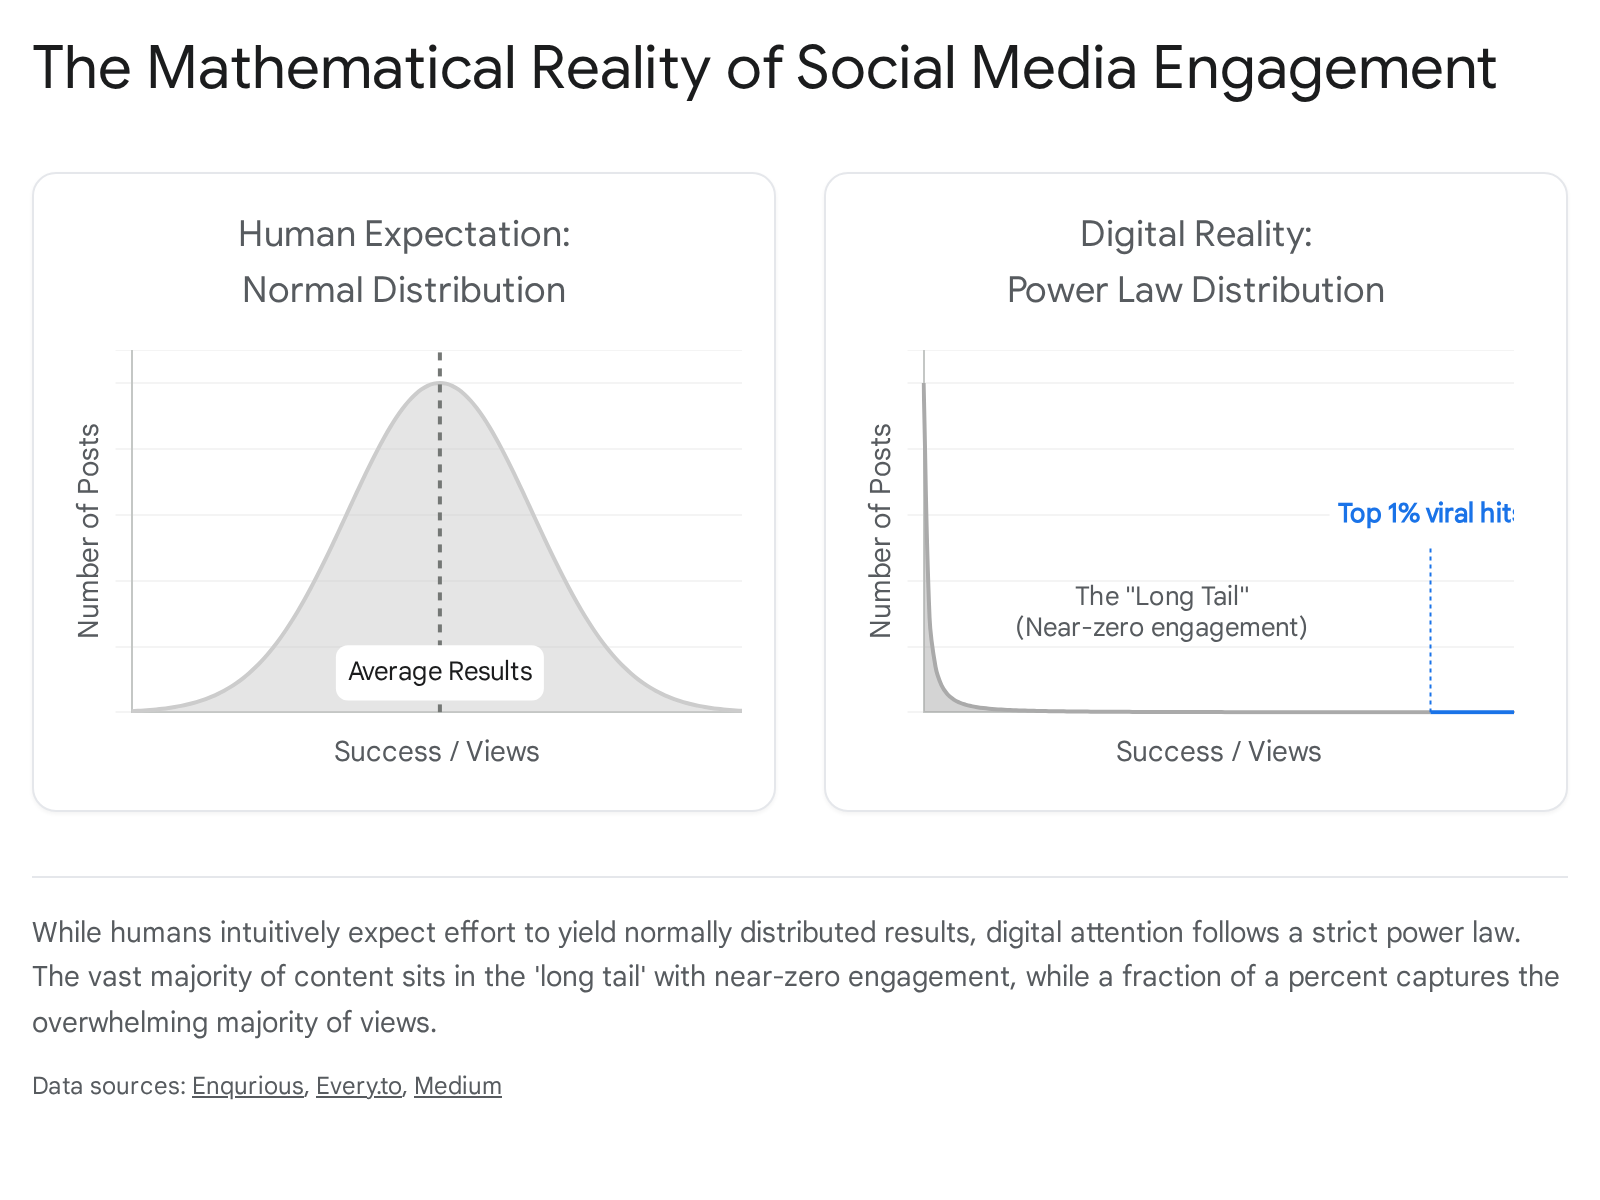
The 1% Rule and Attention Inequality
This extreme imbalance is visually staggering when quantified. Sociological analyses of online communities consistently validate the "1% rule" (often expanded to the 90-9-1 principle). This heuristic dictates that in any digital ecosystem, 90% of users are passive lurkers who solely consume content, 9% are sparse contributors who occasionally comment or engage, and a mere 1% of the population acts as the super-creators who generate the vast majority of the network's visible activity 2013.
Further research into attention inequality reinforces this disparity. Calculating the Gini coefficient - a statistical measure traditionally used for wealth inequality - researchers examined attention distribution across large samples of social media accounts. They found that attention inequality significantly outpaces global wealth inequality. The top 20% of users command over 96% of all followers, 93% of all retweets, and 93% of all mentions, leaving the bottom 80% effectively invisible in the digital landscape 22.
Preferential Attachment and the Winner-Take-All Market
The heavy-tailed nature of internet fame is not accidental; it is driven by a phenomenon known in network science as preferential attachment, or the "rich get richer" effect 23. In a strongly connected society, individuals use the actions of others as heuristics for quality. If a video already has a million views, an algorithm assumes it is highly valuable and pushes it to millions more, while a brand new video with zero views struggles to prove its worth 24.
When algorithms aggressively prioritize high-engagement content, they create a positive feedback loop that rapidly starves competing content of visibility. This environment coalesces into a "winner-take-all market" (WTAM) where the absolute best piece of content does not merely receive slightly more attention than the second-best piece; it monopolizes the entire audience's attention 192425.
For creators trying to go viral, failing to understand this statistical reality leads to chronic burnout. Many approach content creation through the lens of a binomial distribution, acting as if every published post is a coin flip with a reasonable chance of success. Mathematically, the probability of an average user experiencing a viral tail event is incredibly low (e.g., a 1% chance per post). Reaching the extreme head of the power-law curve requires an extraordinary volume of trials combined with content optimization that explicitly satisfies the network's algorithmic demands 26.
The Great Shift: From Social Graphs to Interest Graphs
The mechanics determining which content ascends to the peak of the power law and which languishes in the long tail have undergone a tectonic shift over the past several years. To understand why modern viral attempts fail, one must understand the transition from the "social graph" to the "interest graph."
The Era of the Social Graph (Pre-2020)
Historically, platforms like the original Facebook, early Twitter, and standard Instagram operated almost entirely on a social graph. A social graph is a computational map of explicit human relationships, tracing the connections between users, their friends, their family, and the specific accounts they manually chose to follow 142829.
In the social graph era, reach was a direct byproduct of audience accumulation. If a brand spent years building an audience of one million followers, they possessed a guaranteed distribution channel. When they published a post, the algorithm would reliably place that content into the feeds of a significant percentage of those one million users 2829. Success in this era was achieved by steadily networking, cross-promoting, and accumulating subscribers to build a permanent, owned audience.
The Rise of the Interest Graph (2020 - Present)
That era has ended. Driven by the explosive global rise of TikTok and subsequently adopted by YouTube (Shorts), Instagram (Reels), and even professional networks like LinkedIn, the underlying architecture of digital distribution transitioned to the interest graph 282930313233.
An interest graph maps behavioral patterns rather than interpersonal relationships. It utilizes sophisticated machine learning models to track exactly what a user watches, how long they watch it, the topics they linger on, and the audio patterns they engage with, using these signals to predict latent preferences 31153536. In an interest-driven ecosystem, the content feed is heavily populated with posts from accounts the user does not follow 313637.
In this new paradigm, explicit follows are downgraded to weak signals. The dominant signal is immediate behavioral retention 33. The platforms have effectively evolved from social networking tools into predictive entertainment engines 283116.
| Feature | The Social Graph (Pre-2020 Paradigm) | The Interest Graph (Modern Paradigm) |
|---|---|---|
| Primary Distribution Vector | Explicit personal connections (friends, followed accounts, networks) 2829. | Implicit user behavior (watch time, dwell time, saves, completion rates) 313339. |
| Content Discovery Method | Limited largely to an immediate network and direct shares from peers 2932. | Democratized; served directly to strangers based on predictive behavioral modeling 293640. |
| Value of Follower Count | Crucial; represented a guaranteed baseline of reach and permanent distribution 41. | Marginal; merely provides a small initial test audience to gauge immediate content quality 333742. |
| Core Creator Strategy | Long-term audience accumulation, relationship building, and community management 28. | Hook engineering, pattern interruption, and optimizing for high-retention algorithmic gates 303342. |
| Primary Platform Examples | Early Facebook News Feed, standard chronological Instagram Feed 282931. | TikTok For You Page, YouTube Shorts, Instagram Reels, Algorithmic LinkedIn 3031323943. |
For brands, marketers, and content creators, the interest graph is a paradox of democratization and extreme fragility. On one hand, it completely levels the playing field; an unknown account with zero followers can achieve ten million views overnight if their content perfectly aligns with the behavioral patterns of a specific interest cluster 394044. The distribution is based on pure content meritocracy.
On the other hand, past success guarantees absolutely nothing about future reach. A global brand with three million followers can publish a high-budget video that receives barely a thousand views if the content fails to hook the audience in the opening seconds 3741. In the interest graph, you are only as visible as the algorithmic retention rate of your most recent upload.
The Algorithmic Gauntlet: Phased Distribution
The mechanism that powers the interest graph - and the exact reason why most viral attempts fail - is a rigorous evaluation protocol known as "phased distribution" or the "explore-exploit" model 3945.
Social media platforms no longer broadcast new uploads to an entire follower list simultaneously. Instead, every single piece of content is treated as an unverified hypothesis that must survive a brutal, multi-staged mathematical gauntlet. If the content fails at any gate, its distribution is permanently halted 3945.
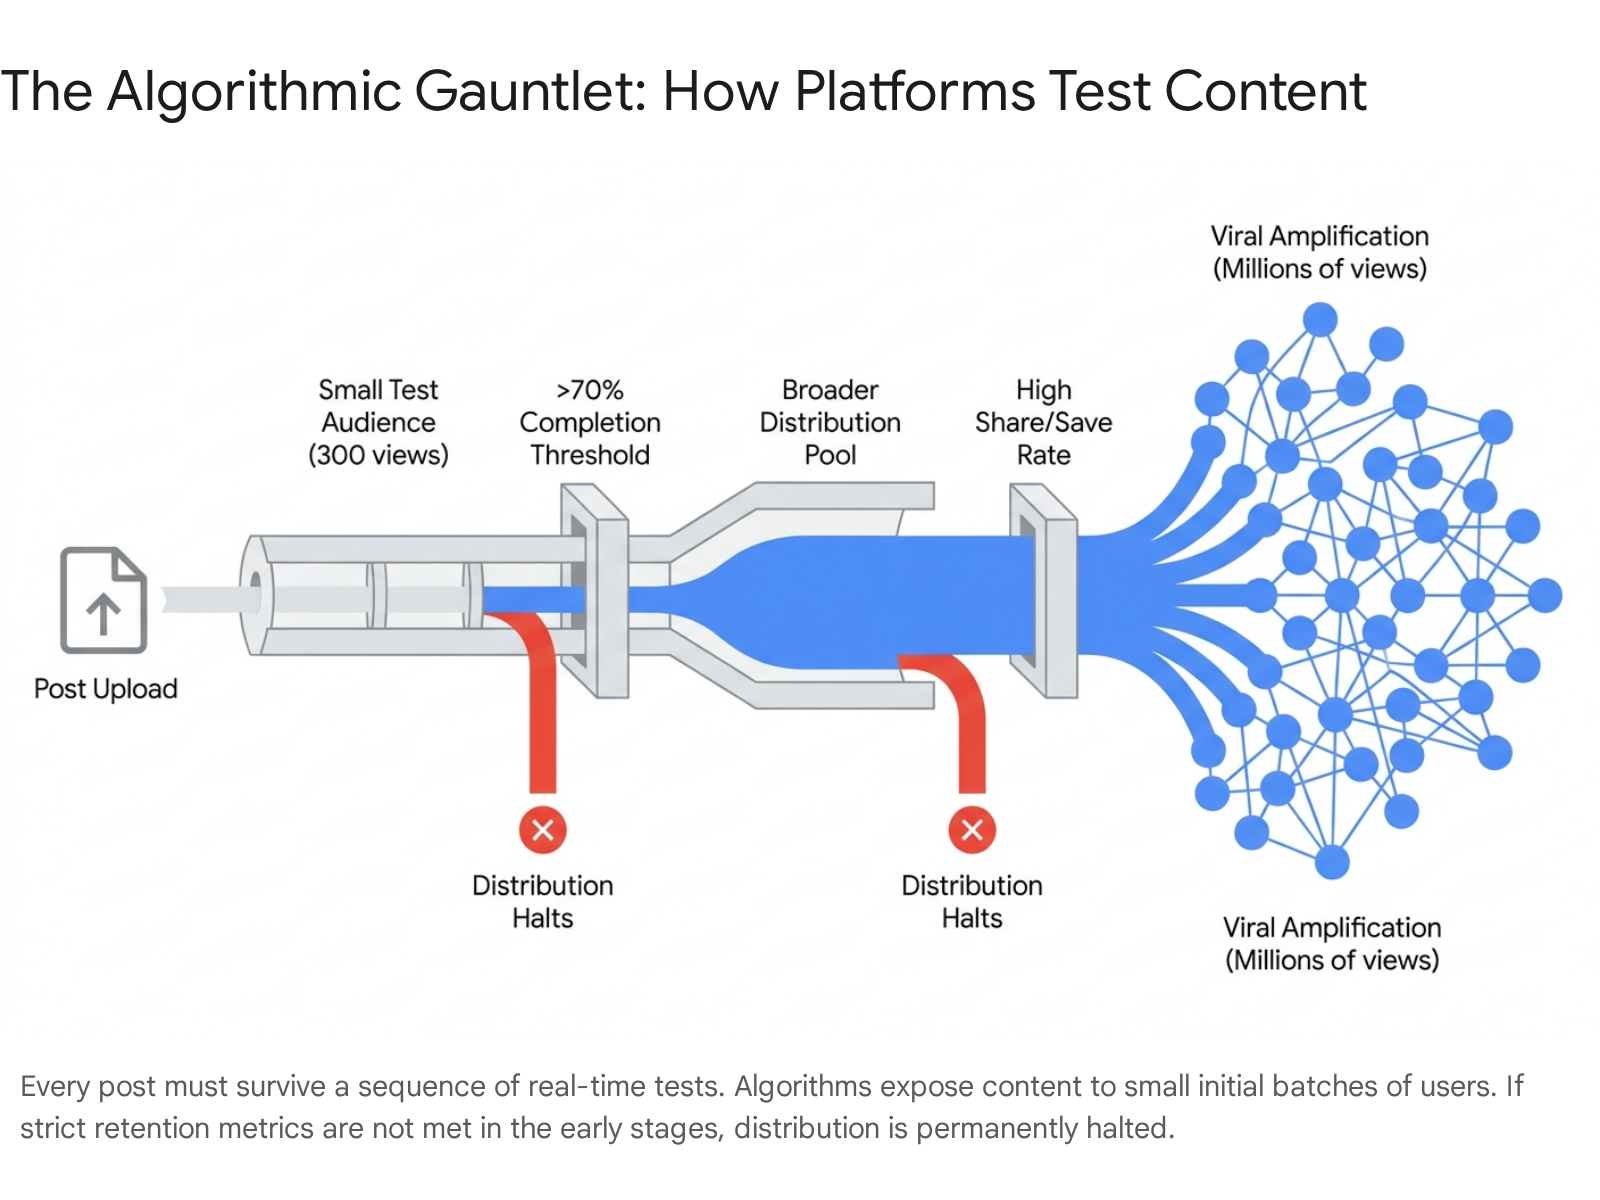
Phase 1: The Initial Test Audience (The Explore Phase)
When a creator hits publish, the algorithm places the content into an exploratory testing pool. The post is exposed to a tiny sample audience - often ranging from a few hundred to a few thousand viewers, depending on the platform 404546.
In a major algorithmic shift observed across 2025 and 2026, platforms like TikTok and Instagram have begun defaulting to "follower-first testing." Before unleashing a video to the broader interest graph, the system seeds the content to a subset of the creator's existing followers to establish a baseline quality metric 39. If a creator has purchased fake followers, or if their audience is highly disjointed, the test audience will immediately swipe away, signaling to the algorithm that the content is irrelevant, killing the post before it ever reaches non-followers 3947. For brand-new accounts with zero followers, the test audience is assembled using semantic analysis of the video's keywords, on-screen text, and visual elements to match it with likely interested users 3940.
Phase 2: The Retention Gate
During the test phase, the algorithm is not merely counting views; it is aggressively tracking micro-behaviors. The survival of the post depends entirely on passing specific, unforgiving statistical thresholds. Across almost all major short-form platforms, the single most critical metric is percentage completion rate and watch time 163943.
The failure to meet these thresholds is why the vast majority of viral attempts collapse. Data indicates that for viral distribution on platforms like TikTok, a video must achieve a completion rate of approximately 70% (a benchmark that was raised from roughly 50% in 2024) 3943.
Human attention is highly volatile. Internal data from Meta shows that users make a subconscious "stay-or-scroll" decision in approximately 1.7 seconds 16. Consequently, the first three seconds of a video determine between 65% and 84% of its total retention success 43. If a creator begins a video with a slow introduction, a branded logo screen, or a meandering narrative, the test audience will instantly swipe away. The algorithm interprets this mass abandonment as a definitive low-quality signal, and the post is designated to the power-law tail.
Phase 3: Amplification and Deep Engagement (The Exploit Phase)
If a piece of content demonstrates elite retention metrics, it graduates to the "exploit" phase. The algorithm begins exposing the content to exponentially larger waves of non-followers 394546.
At this stage of distribution, passive metrics like traditional "likes" lose their algorithmic weight. To sustain momentum and achieve true virality, the content must trigger high-intent, deep engagement signals 163948. Platforms prioritize actions that indicate extreme user value: * Shares (DMs): Sending a video directly to another user via direct message is the ultimate algorithmic currency. It proves the content is compelling enough to facilitate social connection. Meta algorithms reportedly weight sends 3 to 5 times higher than standard likes 311649. * Saves: Bookmarking a post signals high utility and signals intent for repeat consumption, telling the algorithm the content has lasting value 394817. * Rewatches: Looping a video multiple times provides a massive algorithmic boost, often weighted heavily as a sign of deep fascination or dense informational value 4318.
If a post cannot sustain these deep engagement ratios as the audience pool scales outward, the algorithm determines the content has exhausted its relevant audience fit, and the distribution tapers off into a plateau 3945.
Platform-Specific Mechanics of Viral Failure
While the overarching explore-exploit model applies broadly, the nuance of why content fails varies based on the specific engineering architectures of individual networks in 2026.
TikTok's Batch Testing and Micro-Virality
TikTok operates on a highly compartmentalized batch testing model. The platform serves content to staggered cohorts of users, rigorously analyzing performance after each batch to calculate the size of the subsequent wave 43. This structure allows for delayed virality, where videos can suddenly explode weeks after posting if a specific batch unexpectedly resonates 43.
The algorithm enforces a strict hierarchy of success. Research into TikTok's data signals reveals that videos maintaining a 70% completion rate alongside a 15% engagement rate within the first hour receive major algorithmic prioritization 43. Videos that achieve elite completion rates of 92% or higher are classified as "sticky content," automatically receiving a 3x reach multiplier 43. Furthermore, TikTok has aggressively pivoted toward "micro-virality." If the algorithm detects that three highly distinct users like the same niche video, it actively groups them into a micro-community, surfacing hyper-specific content to that cluster rather than attempting to push the video to the broader, generic platform 42. Content that attempts to appeal to everyone often appeals deeply to no one, failing the batch test.
YouTube Shorts and the "Viewed vs. Swiped Away" Ratio
YouTube Shorts evaluates virality through a multi-stage recommendation system distinct from its long-form architecture. The algorithm relies heavily on four metrics: the swipe-away rate, the watch-through rate, the engagement rate relative to views, and the replay rate 18.
A critical factor for YouTube Shorts is the strict "viewed vs. swiped away" metric. If a viewer scrolls past a Short within the first few moments, it registers as a swipe-away, heavily penalizing the video 43. Following a massive view-counting update in March 2025, YouTube began counting every single loop of a Short as an independent view, meaning replay-optimized content experienced an immediate 30% inflation in apparent reach 43. The system heavily prioritizes percentage completion over absolute watch time. A 30-second Short with 25 seconds of average watch time (an 83% completion rate) will dramatically out-scale a 60-second Short with 20 seconds of watch time (a 33% completion rate), even though the absolute time spent is nearly identical 4318.
Instagram Reels and Momentum Routing
Instagram's ecosystem is heavily momentum-based, making the initial velocity of engagement critical to survival. When a Reel is published, the algorithm provides a temporary freshness boost to test its appeal. If the video receives a high velocity of likes, comments, shares, and saves within the first 30 minutes to two hours, the system opens the floodgates to the non-follower Explore pages and Reels feeds 165253.
In 2025, Instagram explicitly confirmed a pivot away from rewarding content aggregators and generic reposts, intentionally suppressing unoriginal content and causing 60% to 80% reach drops for accounts that relied on recycled viral clips 16. A massive point of failure for brands on Instagram is treating the platform strictly as an image gallery. Algorithm updates have continuously penalized static images while weighting shares and saves of Reels as the dominant distribution mechanisms 1648.
LinkedIn's Pivot to Dwell Time
Historically a chronological, text-heavy professional network, LinkedIn's algorithm underwent a massive overhaul in 2025 and 2026, completely transitioning from a social graph to an interest graph framework 3237. Consequently, organic impressions for generic company page updates collapsed by as much as 66% 3219.
To achieve distribution on modern LinkedIn, the algorithm requires "dwell time" - the hidden metric calculating exactly how long a user spends reading a post or clicking through a document carousel before scrolling away 32. A post that retains a user for 61 seconds or more achieves a staggering 15.6% underlying engagement rate, whereas a post viewed for only 3 seconds registers a negligible 1.2% rate 32. Furthermore, the platform heavily discounts superficial "likes." Deep comments and conversational threads carry roughly 15 times the algorithmic weight of a standard reaction 32. Professional content fails to go viral when it relies on external link-sharing or shallow updates, as these actively destroy dwell time metrics.
The Million-Follower Fallacy in Influencer Marketing
Recognizing the immense difficulty of organic distribution, many brands attempt to artificially manufacture virality by purchasing it through influencer marketing. Despite record investments, the statistics are grim: research indicates that nearly 90% of digital marketing efforts fail to meet their objectives, and billions of dollars are lost to programmatic waste and invalid traffic 5556.
The primary cause of this failure is the "Million-Follower Fallacy" 57. Marketing teams frequently assume that hiring a mega-influencer with five million followers guarantees massive, highly engaged reach. However, network science exposes a severe disconnect between audience size and conversion capability.
As an influencer's audience scales into the millions, the demographic makeup inevitably broadens, resulting in an incredibly diluted and inattentive audience base 575859. Utilizing independent cascade models - the mathematical frameworks used to trace diffusion paths - data scientists demonstrate that per-edge probability (the likelihood that follower A will adopt a behavior from influencer B) actively decreases as the influencer's out-degree audience size increases 57.
Furthermore, allocating massive budgets to top-tier celebrities introduces the mathematical problem of submodularity, or diminishing marginal returns. If a brand hires the top five influencers within a specific lifestyle niche, they are not linearly expanding their audience; they are paying a massive premium to repeatedly reach the exact same highly connected individuals, achieving heavy saturation but minimal unique expansion 57.
The Superiority of Micro-Influencers
Empirical data consistently proves that the path to reliable network penetration lies in the middle of the graph. Micro-influencers (creators with 10,000 to 100,000 followers) and nano-influencers operate within highly cohesive, deeply trusted community clusters 585960.
Because their audiences are bound by specific, shared interests rather than generic celebrity appeal, micro-influencers yield engagement rates up to 60% higher than their macro-influencer counterparts 5860. Campaigns utilizing micro-influencers in niche markets frequently deliver conversion rates three to four times higher than broad celebrity segments 59. These tight-knit communities are vastly more likely to trigger the high-intent shares, saves, and dwell times required to push content past the interest graph's algorithmic retention gates 3059.
Synthetic Influence and the Ghost Account Economy
The transition to the interest graph has exposed an uncomfortable truth about influencer marketing: because the algorithm strictly rewards content signals over explicit human reputation, the "User" in User-Generated Content is no longer an absolute requirement for content to scale 33.
Research tracking consumer behavior on e-commerce product pages found that 70% of consumers converted after watching a UGC-style video, regardless of whether they recognized the creator or whether the creator's face was ever fully shown 33. The audience merely requires "human-looking" signals - such as natural lighting, casual voiceovers, and shaky camera work - to satisfy their desire for authenticity 33.
This realization has birthed the "Ghost Account" economy. In late 2025, enterprise brands began mass-producing niche, faceless marketing accounts mimicking personal blogs (e.g., "Eco-Kitchen Hacks") 33. By operating swarms of these synthetic accounts that comment and react to one another, brands simulate a grassroots consensus effect. When the algorithmic interest graph detects this dense cluster of high-retention interaction, it incorrectly assumes a cultural trend is forming and amplifies the content 33. The ease with which these systems can manufacture reach further dilutes the value of traditional, expensive macro-influencer endorsements.
Debunking Algorithmic "Hacks"
Faced with declining organic reach and the intense pressure of the power law, many marketers and creators obsess over finding "algorithm hacks" to game the system. However, comprehensive data analysis and large-scale creator experiments routinely debunk these technical loopholes as ineffective superstitions 1642. The platforms process billions of data points daily using advanced machine learning; they are largely immune to superficial manipulation 1661.
The Illusion of the Perfect Posting Time
Conventional wisdom dictates that creators must rigorously schedule their uploads to align with peak audience hours. While posting during a general window of wakefulness is a logical baseline, exhaustive data analysis reveals that the specific hour of posting matters minimally in the grand scheme of the explore-exploit model 394252.
Because modern algorithms rely on test-audience protocols, the evaluation phase occurs regardless of the clock. If a creator posts a highly compelling video at 2:00 AM, the algorithm will test it on the available night-owl audience. If it achieves elite retention metrics, the system will hold the video in algorithmic stasis and continue pushing it to broader audiences as they wake up. Ultimately, a high-retention video posted during off-hours will drastically outperform a low-retention video posted at the exact optimal peak time 4245.
Hashtag Stuffing and Trending Audio
Historically, creators relied on stuffing captions with dozens of hashtags to force their content into search results. This strategy is now actively penalized. Modern algorithms utilize sophisticated Natural Language Processing (NLP) and computer vision to instantly contextualize a video or image based on its spoken audio, on-screen text, and visual elements 323949. Using three to five highly relevant keywords integrated naturally into a caption drives significantly more reach than a spam-like block of thirty hashtags 163949.
Similarly, creators frequently rely on "trending audio" tracks, believing the sound alone will guarantee distribution. While utilizing a trending track can offer a marginal early categorization boost, extensive A/B testing reveals minimal reach differences when identical videos are posted with or without the trending audio 42. If the video lacks a compelling visual hook and pattern interruption, the audio track cannot save it from being swiped away by the test audience.
The Consistency Trap vs. Quality
Finally, many creators fall victim to the "consistency trap," believing that they must post daily or multiple times a day to appease the algorithm 176263. While regular posting provides more "lottery tickets" for algorithmic discovery, frequency is entirely secondary to quality 2617.
Algorithms track historical channel performance. If an account publishes five mediocre, low-retention videos a week, they actively train the algorithm to expect poor performance, causing the system to shrink the size of future test audiences 1661. In 2026, social media engineers explicitly prioritize deep, high-signal substance over sheer volume 17. One high-quality, high-retention video per week is algorithmically superior to seven mediocre daily posts 1762.
Bottom line
The data overwhelmingly demonstrates that going viral is not the result of a contagious, person-to-person chain reaction, but rather a power-law anomaly where platforms algorithmically reward a tiny fraction of elite content. Modern interest graphs enforce a ruthless testing phase, automatically burying posts that fail to meet extreme retention, watch-time, and high-intent sharing thresholds within their first few hours. While marketers continue to chase outdated follower metrics and algorithmic "hacks," sustainable reach now demands abandoning demographic broadcasting in favor of creating high-depth, hook-driven content mathematically optimized for behavioral retention.