Who Owes What in Student Loan Debt in 2026
In early 2026, roughly 43 million Americans owe a combined $1.84 trillion in federal and private student loan debt, making it the second-largest consumer debt category in the United States. While the average borrower carries an outstanding balance of approximately $43,570, this figure is heavily skewed by graduate degree holders; the median debt sits substantially lower at $24,109. Borrowers are currently navigating a highly volatile repayment landscape defined by the expiration of pandemic-era protections, record-high delinquency rates, and a massive federal transition to the new Repayment Assistance Plan (RAP) slated for July 2026.
The Scope of the American Student Debt Crisis
The sheer scale of student loan debt in the United States makes it one of the most defining economic forces of the modern era. Standing at an estimated $1.84 trillion in the first quarter of 2026, total U.S. student loan debt grew by 3.2% year-over-year from the end of 2025, resuming a long-term upward trajectory after a brief, temporary decline recorded in 2023 and 2024 1. This financial burden is spread across approximately 42.8 million to 44.6 million individual federal borrowers, alongside millions who hold private commercial loans 123.
Understanding the scope of this debt requires looking beyond the top-line trillion-dollar figure and breaking down the specific portfolios, loan types, and mathematical realities that define the modern borrower experience.
Federal Versus Private Lending Portfolios
Not all student debt is created equal, and the legal framework governing a borrower's repayment depends entirely on the origin of their loans. The overwhelming majority of the $1.84 trillion burden is held by the federal government. As of the first quarter of 2026, the outstanding federal student loan balance is approximately $1.69 trillion to $1.7 trillion, accounting for roughly 91% to 92% of all outstanding educational debt in the country 1245.
The federal portfolio itself is highly concentrated. The U.S. Department of Education directly manages over $1.61 trillion in Direct Loans across roughly 40.9 million borrower accounts, representing more than 95% of the total federally managed portfolio 5. The remaining federal balance consists of older, discontinued loan types, primarily the Federal Family Education Loan (FFEL) program, which makes up less than 10% of the portfolio, and Perkins Loans, which now comprise less than one-fifth of one percent 67.
Private student loans make up the remaining 8% to 9% of the national total, representing roughly $131 billion to $144 billion in outstanding debt 3489. While private loans represent a smaller fraction of the overall market, they carry distinct risks. Private loans operate as strict commercial products with rigid repayment terms, variable interest rates, and virtually no standardized forgiveness options. Furthermore, they frequently require co-signers, heavily linking family finances to the student's success. Data from the 2025 - 2026 academic year reveals that 96.7% of private undergraduate loans and 74.2% of private graduate loans required a co-signer 34. Borrowers utilizing private loans also tend to graduate with significantly higher average balances - $42,170 compared to the federal average of $20,460 9.
The Mean Versus Median Divide
When evaluating the impact of student debt on the average American, a critical distinction must be made between mean and median debt levels. Public discourse frequently cites the average (mean) debt per borrower, which stands at $43,570 when combining federal and private sources 1. However, this figure paints a mathematically distorted picture of the typical college graduate's experience.
The median debt per borrower is substantially lower, calculated at $24,109 in 2026 1. This nearly $19,000 gap between the mean and the median reveals a heavily skewed distribution, often referred to as a "fat tail." The average is pulled drastically upward by a relatively small subset of borrowers who take on six-figure debts to finance advanced graduate and professional degrees, such as medical or law school. Most borrowers owe closer to the median, a sum roughly equivalent to a modest auto loan, yet the outsized balances of graduate students dominate the statistical averages 1.
Who Owes the Debt? Generational and Demographic Realities
The burden of student loans is not distributed evenly across the American population. It fractures along lines of age, gender, race, and socioeconomic background. Analyzing the demographics of student debt reveals how the cost of higher education interacts with broader systemic inequalities.
Borrowing Trends by Age and Generation
While cultural narratives often associate student debt exclusively with young adults fresh out of college, federal data reveals a starkly different reality. The bulk of the nation's student debt is held by middle-aged Americans who have been in the workforce for years, and in many cases, decades.
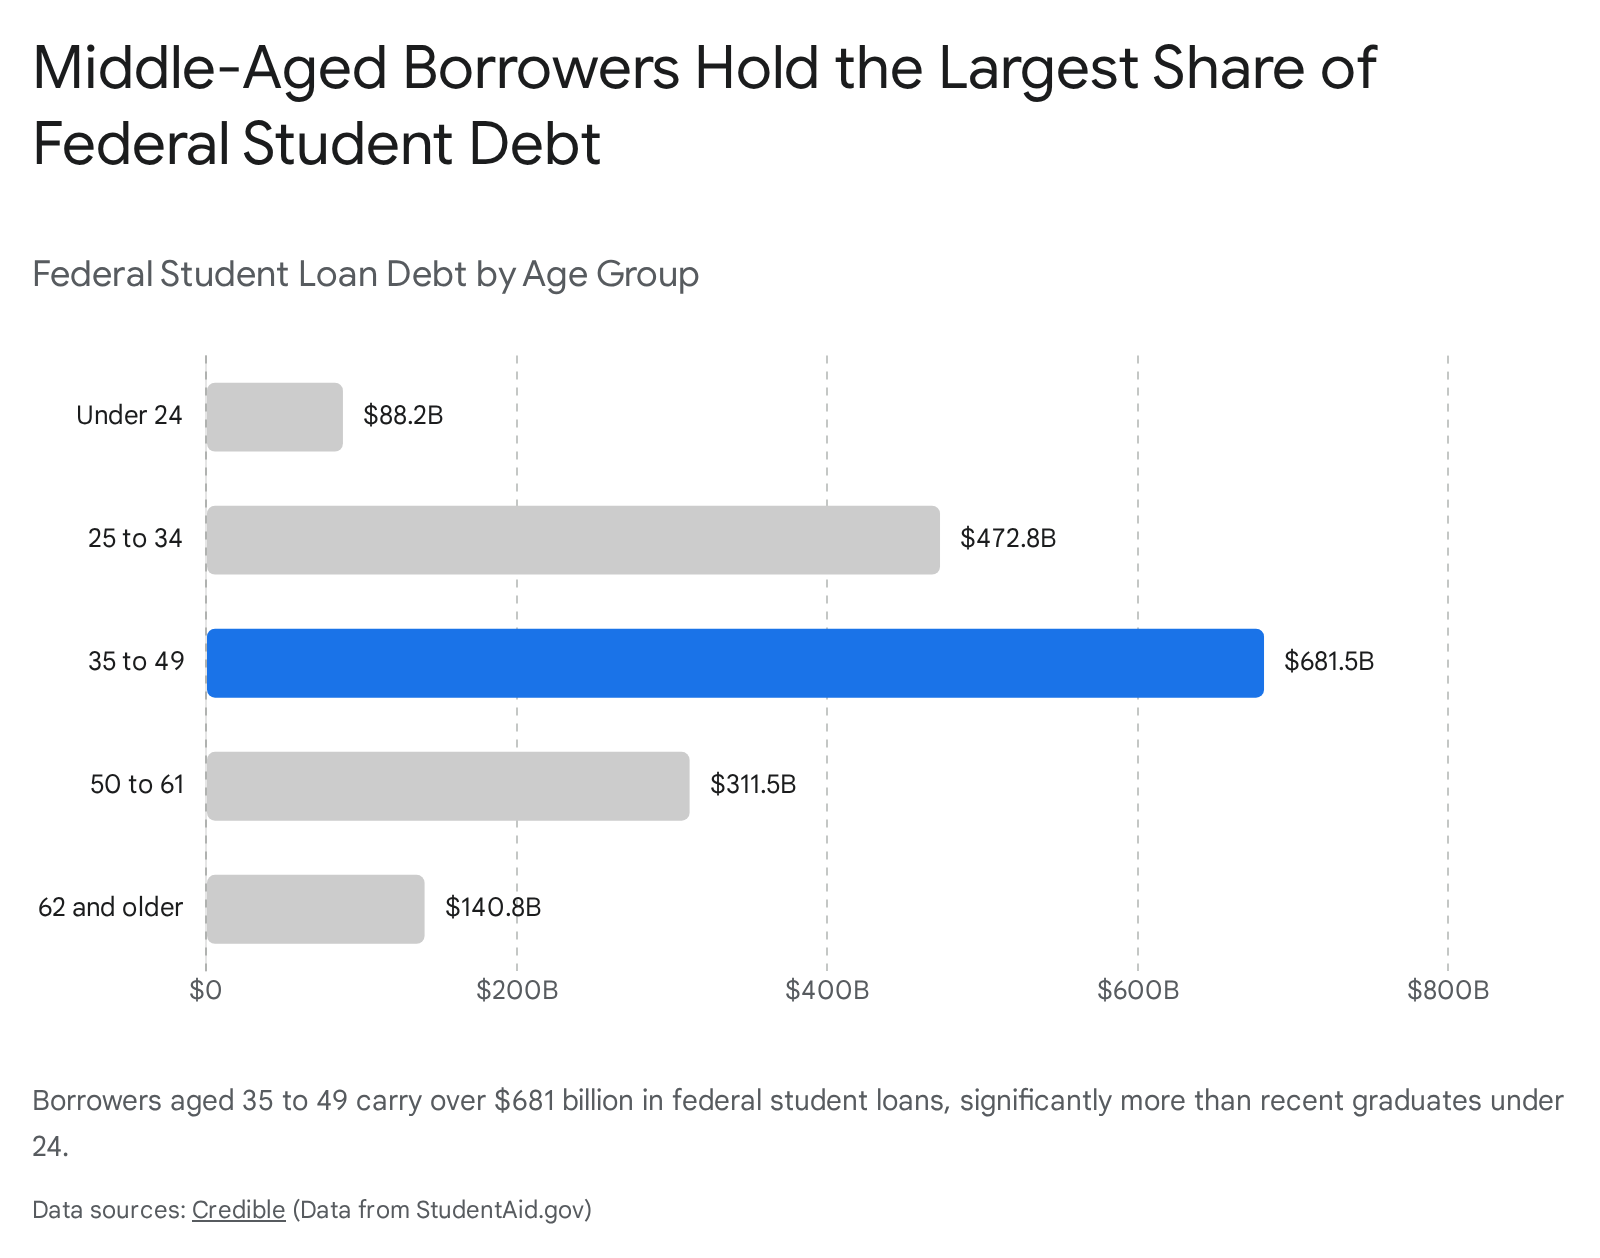
Borrowers between the ages of 35 and 49 hold the absolute largest share of federal student loan debt, collectively owing over $681.5 billion 49. The 25-to-34 demographic follows with roughly $472.8 billion in outstanding balances 9. Conversely, recent graduates and young borrowers under the age of 24 hold just $88.2 billion - representing roughly 5% of the total federal portfolio 910.
When viewing the data through generational cohorts rather than strict age brackets, Millennials (born 1981 - 1996) represent the largest number of individual borrowers, with roughly 11 million to 14 million individuals carrying active balances 810. However, Generation X (born 1965 - 1980) carries the heaviest per-capita burden, with the average Gen X borrower owing $38,426 10.
Generation Z (born 1997 - 2012) currently has the lowest average student loan debt balance at $21,670 10. However, because they are actively in school or recently graduated, their average debt is growing the fastest, increasing at a compound annual growth rate of 3.51% 10.
Even retirement-age Americans face substantial exposure to the student debt crisis. Approximately 1.9 million to 2.4 million borrowers aged 62 or older collectively owe between $98 billion and $140 billion 489. For this demographic, much of the debt stems from Parent PLUS loans taken out to finance their children's education, or from their own graduate studies, representing a severe threat to fixed-income retirement stability.
Disparities by Gender and Race
Systemic inequalities in wealth accumulation, labor market discrimination, and family financial support result in significantly disproportionate debt burdens for women and people of color.
Women hold nearly 63.6% of all outstanding student loan debt 8. This disparity begins early in the educational pipeline. Among bachelor's degree holders, 49.3% of female students accept federal loans compared to 41.9% of male students 2. The gap widens at the two-year college level, where female associate's degree seekers are 16% more likely to borrow federal funds than their male peers 2. Consequently, female bachelor's degree holders borrow roughly 3.6% more than men, and female associate's degree holders borrow 14.2% more 2.
The racial wealth gap dictates an even starker reality for Black borrowers, who must rely far more heavily on debt to finance their education due to lower levels of generational wealth. Among bachelor's degree holders, Black students are the most likely to borrow federal loans at a rate of 82.9% 2.
The most alarming aspect of the racial debt gap is how it compounds over time. Upon graduation, Black borrowers owe slightly more on average than their white peers. However, four years after graduation, Black borrowers owe an average of $25,000 more than white borrowers 2. Because Black graduates face systemic wage gaps and labor market disparities, their payments frequently fail to cover the accruing interest on their loans. Consequently, 48% of Black student borrowers owe more than they initially borrowed four years after graduation, compared to just 17% of white student borrowers 2.
How Degree Choice Impacts Debt Levels
The type of degree a student pursues, and the institution they choose to attend, serve as the primary mathematical drivers of their final debt balance. While undergraduate costs have climbed steadily, graduate school is the true engine of extreme student debt in the United States.
Undergraduate Borrowing and the Institution Type
For the millions of students pursuing undergraduate education, debt levels generally align with the type of institution attended. Students attending public, in-state universities consistently borrow less than those at private institutions.
The average public university student borrows between $27,420 and $31,960 to complete a bachelor's degree 2391112. In contrast, students attending private, non-profit four-year institutions graduate with an average debt of $34,420 to $39,548 3913. Students who attend private, for-profit colleges carry the highest undergraduate burdens, averaging $47,730 upon graduation 12.
Major selection also influences outcomes at the undergraduate level. A 2025 analysis of new bachelor's program graduates revealed that Curriculum and Instruction majors carry the highest median debt at $46,820 13. Conversely, students majoring in Science Technologies hold the lowest median debt at $9,915 13. When measuring debt-to-income viability, a Bachelor's of Nuclear Engineering Technologies offers the most favorable ratio, with median debt representing just 16.4% of the median first-year salary 13.
The Graduate School Debt Engine
Graduate and professional programs are responsible for the most extreme debt loads in the federal portfolio. Graduate students make up just 21% of all borrowers but receive nearly 47% of all federal student loans disbursed annually 14.
Historically, this imbalance occurred because federal lending limits for graduate students were highly permissive. Prior to the legislative overhauls taking effect in late 2026, graduate and professional students utilizing Grad PLUS loans faced virtually no federal loan limits and could borrow up to the full cost of attendance, including living expenses 15. Roughly a third of graduate borrowing is used to pay for non-tuition costs like rent and food 15.
| Degree Level / Type | Average Student Loan Debt | Key Demographic Context |
|---|---|---|
| Associate's Degree | $20,340 | Borrowers at this level historically face the highest default rates, despite lower balances, often due to high non-completion rates 216. |
| Bachelor's Degree | $29,550 | The standard benchmark for four-year degrees; roughly 47% of the Class of 2024 graduated with this debt level 12. |
| Master's Degree | $62,820 to $81,870 | Debt loads have ballooned by 50% since the year 2000, heavily driven by unrestricted borrowing limits 1315. |
| Professional (Law) | $112,500 | Professional degrees frequently cross the six-figure threshold 9. |
| Professional (Medical) | $197,750 to $223,130 | Representing an 80% increase in debt load over the last two decades 915. |
| Ph.D. (Pharmacy) | $322,885 | The highest median debt recorded among specialized graduate degree categories 13. |
Note: Figures represent average debt among those who borrow. Statistics vary slightly by survey source and cohort year.
Geographic Disparities in Student Borrowing
Student loan balances are highly regionalized. State-level differences are dictated by the funding levels of public university systems, local costs of living, and the concentration of advanced degree holders migrating to specific job markets.
The District of Columbia consistently registers the highest average student loan debt in the nation, with residents carrying roughly $54,561 to $55,220 on average 111318. This anomaly is driven by Washington D.C.'s lack of a large state university system, a high concentration of expensive private institutions, and a labor market that attracts highly indebted young professionals holding graduate degrees in law, policy, and medicine 17.
Following D.C., the states with the highest average debt burdens include Maryland ($42,350 to $45,173), Georgia ($40,268 to $43,276), and Virginia ($38,251 to $41,410) 420.
Conversely, states in the Midwest and Mountain West boast the lowest debt burdens. North Dakota maintains the lowest average balance at roughly $28,600 to $29,944, making it the only state where the average remains below $30,000 1720. Utah ($18,344), New Mexico ($20,868), and California ($21,125) also rank among the lowest for average debt at graduation for bachelor's degree holders, largely due to heavily subsidized public university systems and robust state grant programs 418.
The 2026 Default and Delinquency Surge
If the years between 2020 and 2023 were defined by unprecedented federal forbearance and a pause on student loan payments, 2026 is defined by a massive, system-wide delinquency crisis. Following the resumption of payments in October 2023, and the expiration of a 12-month "on-ramp" grace period in late 2024 (which temporarily shielded borrowers from negative credit reporting), millions of Americans have hit a financial wall.
By the first quarter of 2026, delinquency rates surged past prepandemic levels. Nationally, approximately 16% of all student loan borrowers are at least 60 days behind on their payments, representing nearly 6 million Americans 1318. However, this metric dilutes the severity of the crisis by including borrowers who are still in school or in authorized deferment. When isolating the data to borrowers who are actively scheduled to be in repayment, an estimated 25% are currently delinquent - nearly triple the 9.2% pre-pandemic rate observed in 2019 2219.
This wave of delinquency translates directly into defaults. By early 2026, between 7.7 million and 9 million borrowers had slipped into default 5221920. Because federal student loans generally require 270 days of non-payment to enter default status, late 2025 and early 2026 marked the exact window when borrowers who ceased paying at the end of the on-ramp finally triggered default protocols 21. The consequences are severe; delinquent borrowers in 2025 saw their credit scores plummet by an average of 57 points, plunging many into "deep subprime" territory and inviting aggressive collection tactics like wage garnishment 2226.
Profiling the Delinquent Borrower
The data clearly indicates that student loan default is an intersecting symptom of broader economic distress. Urban Institute credit bureau analysis reveals that delinquent student loan borrowers in 2025 are substantially more likely to hold other major forms of household debt compared to 2019 prepandemic levels. Among delinquent borrowers, 38% now have an auto loan (up from 30%), and the share with a mortgage nearly doubled from 8% to 15% 22. Similarly, 13% of delinquent student loan borrowers were also delinquent on their credit cards, up from 8% before the pandemic 22.
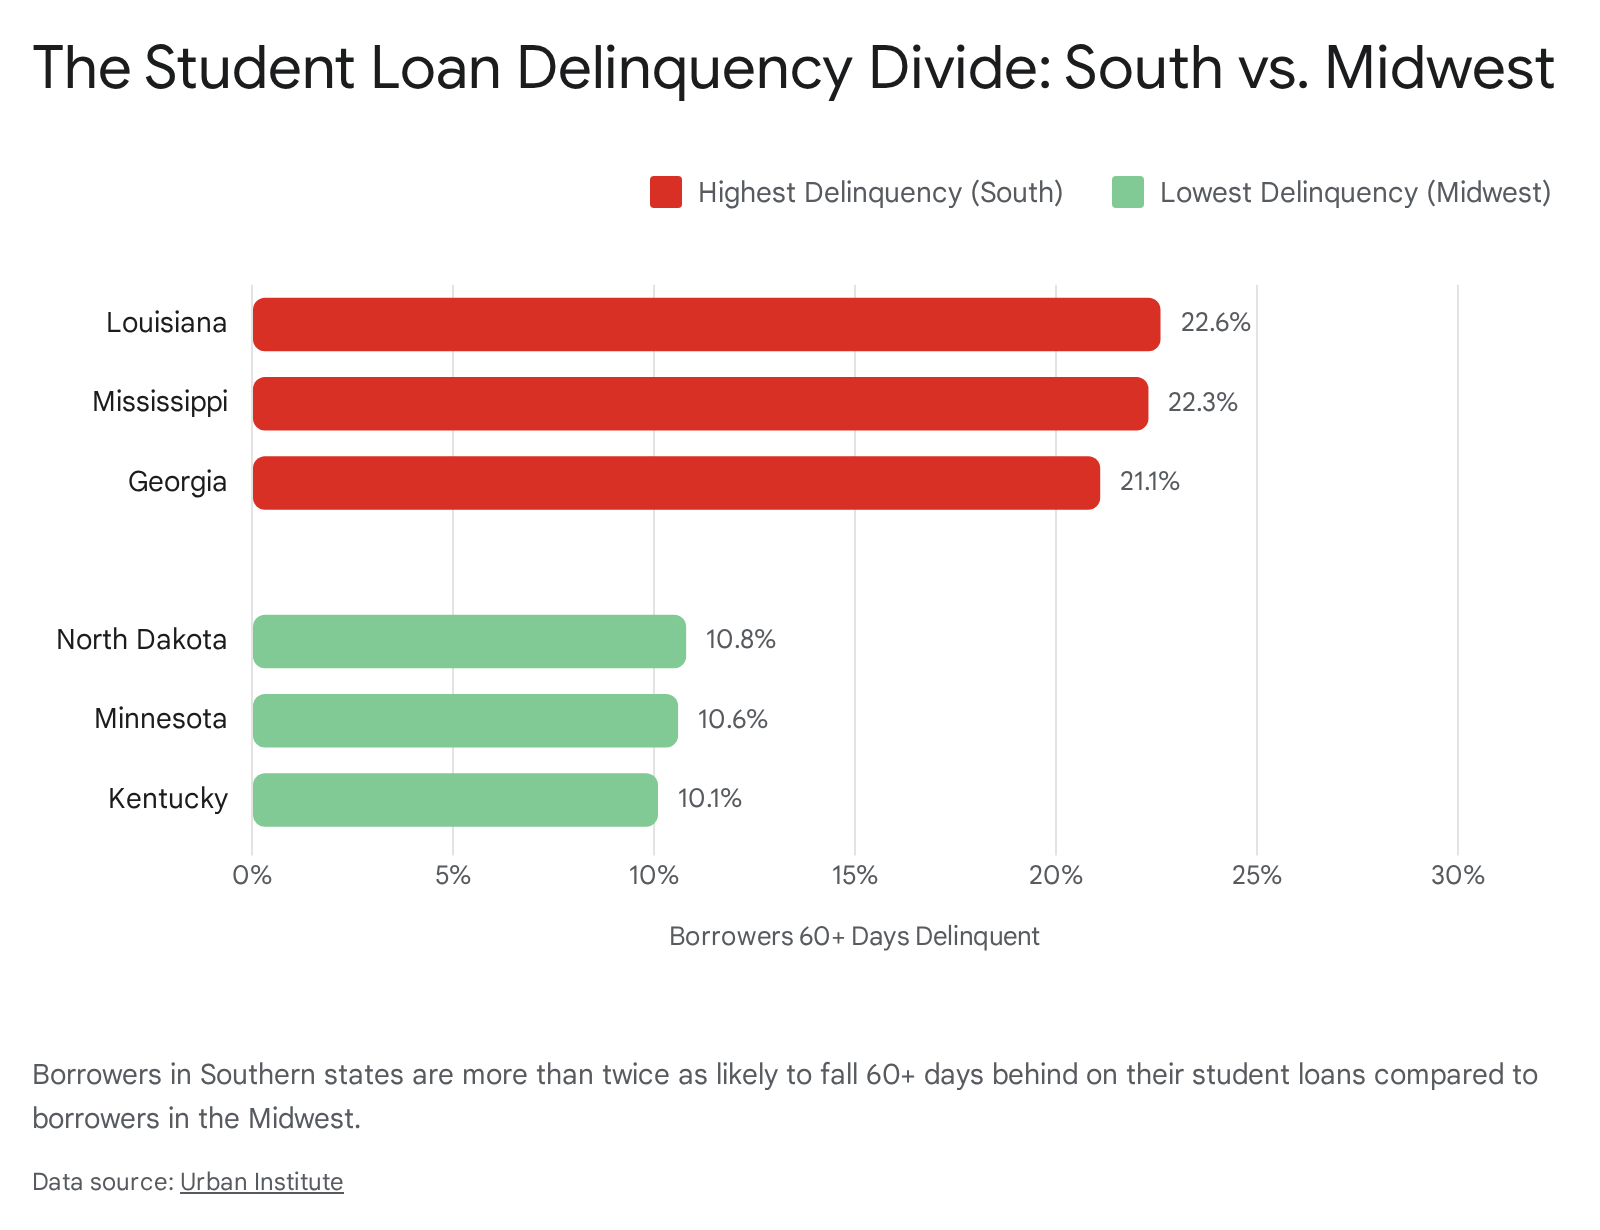
Geographically, the delinquency crisis is concentrated in the Southern United States. Louisiana (22.6%), Mississippi (22.3%), and Georgia (21.1%) report the highest rates of borrowers past due 1318.
These regional disparities correlate heavily with state-level median incomes, poverty rates, and the demographic makeup of the borrower pool. Borrowers from lower-income backgrounds, identified by their status as Pell Grant recipients, face delinquency rates of 27%, compared to just 15% for non-Pell borrowers 22.
The Completion Trap
One of the most persistent misunderstandings regarding student loan defaults is that they are driven by borrowers with massive, six-figure debts. Statistically, the opposite is true. The highest default rates belong to borrowers with the lowest balances.
Approximately 37% of borrowers who take out small amounts - up to $6,125 - for undergraduate study default within 12 years, compared to just 24% of those who borrow more than $24,000 23. This counterintuitive reality is known as the completion trap. Borrowers with small debts are overwhelmingly individuals who attended college for a few semesters but dropped out without securing a degree. They carry the financial liability of the loan, but never acquired the corresponding wage premium of a college diploma to help pay it off 232425. As a result, 34% of borrowers who did not complete a degree or certificate had paid down at least one dollar of principal after three years, compared to 60% of those who graduated 25.
Institution type also plays a critical role. Over 52% of borrowers who attend for-profit colleges default on their student loans after 12 years - twice the rate of public two-year borrowers, and nearly four times the 13% default rate of public four-year entrants 23.
The 2026 Policy Overhaul: The End of SAVE and the Rise of RAP
The administrative chaos and rising delinquency rates of 2026 are deeply intertwined with unprecedented legal and legislative changes to the federal repayment system.
In 2023, the Biden administration launched the Saving on a Valuable Education (SAVE) plan, an income-driven repayment (IDR) option that offered the most generous terms in history, including $0 monthly payments for low-income earners and a total waiver on unpaid interest 312633. However, a coalition of state attorneys general challenged the plan, and in early 2025, federal courts struck down SAVE, ruling that it exceeded the Department of Education's statutory authority 2026. This ruling abruptly froze the accounts of over 7 million enrollees, placing them in an administrative forbearance that blocked them from making progress toward forgiveness 2034.
To resolve the legal deadlock and overhaul the system, Congress passed the One Big Beautiful Bill Act (OBBBA) in July 2025, with major provisions taking effect on July 1, 2026 15263527282930.
Understanding the Repayment Assistance Plan (RAP)
The OBBBA eliminates the confusing patchwork of legacy IDR plans (such as PAYE, REPAYE, and ICR) and replaces them with a single new income-driven option: the Repayment Assistance Plan (RAP) 1533313233.
Starting July 1, 2026, new borrowers will only be offered two repayment paths: a fixed "tiered standard" plan (spanning 10 to 25 years based on the loan balance) or RAP 15262833. Existing borrowers with older loans will have a transition period until July 1, 2028, after which they must select the new standard plan, Income-Based Repayment (IBR), or RAP. If they fail to act, they will be auto-enrolled 262843.
RAP alters the fundamental mathematics of student loan repayment. Unlike older plans that calculated payments based on "discretionary income" (income remaining after subtracting a multiple of the federal poverty line), RAP bases payments directly on a borrower's Adjusted Gross Income (AGI) 153144.
| Feature | The Defunct SAVE Plan | The New RAP Plan (Effective July 2026) |
|---|---|---|
| Payment Formula | Based on "discretionary income" (earnings above 225% of the federal poverty line) 33. | Tiered percentage of absolute Adjusted Gross Income (AGI) 1531. |
| Payment Rates | 5% to 10% of discretionary income 43. | Scales from 1% (for $10k-$20k AGI) up to 10% (for $100k+ AGI) 153144. |
| Minimum Payment | Allowed for $0/month payments for millions of low-income borrowers 3343. | Strict $10/month minimum regardless of how low income drops 33314344. |
| Dependent Discount | Family size expanded the poverty line shield, heavily reducing payments 33. | Flat $50/month reduction in the final payment per dependent child 15333244. |
| Interest Subsidy | 100% of unpaid monthly interest waived to prevent negative amortization 33. | 100% of unpaid interest waived, plus a match of up to $50 applied directly to the principal 15313244. |
| Forgiveness Timeline | 10 to 25 years depending on original balance and undergraduate vs. graduate status 3343. | 30 years for all non-PSLF borrowers, extending the repayment timeline 313331324344. |
For borrowers, RAP represents a mixed bag of compromises. The $10 monthly floor ensures that seven out of ten borrowers who previously enjoyed $0 payments under SAVE will now face mandatory out-of-pocket costs 43. Furthermore, extending the forgiveness timeline to 30 years means higher-earning borrowers will pay significantly more total money over the life of the loan 3344.
However, RAP retains vital protections. The interest subsidy ensures that balances will not balloon indefinitely - a common catastrophe under older plans - and the up-to-$50 principal reduction match guarantees that even minimum payments will chip away at the core debt 15313244. Additionally, RAP eliminates the marriage penalty for couples who file taxes separately; a spouse's AGI is not included in the payment calculation 28.
New Borrowing Caps to Stifle Debt Growth
While RAP reorganizes how borrowers pay back existing debt, the OBBBA attempts to solve the root of the crisis by choking off the origination of massive new loans. Effective July 1, 2026, the federal government is enforcing strict new borrowing caps:
- Elimination of the Grad PLUS Program: The Graduate PLUS loan, which previously allowed master's and professional students to borrow up to the full cost of attendance with no absolute ceiling, is entirely eliminated for new borrowers 27282930.
- New Graduate Limits: Graduate students are now limited to borrowing $20,500 annually in Direct Unsubsidized loans, with a new lifetime aggregate limit of $100,000 15352729. Professional degree seekers (e.g., medical, law, pharmacy) are granted higher caps of $50,000 annually and a $200,000 lifetime limit 153527.
- Parent PLUS Caps: Parents borrowing to fund their dependent children's undergraduate education face strict new limits of $20,000 per year, with a $65,000 lifetime cap per student 1527282930.
- Overall Lifetime Maximum: All new borrowers face a hard lifetime borrowing maximum of $257,500 across all federal student loans (excluding Parent PLUS loans) 2730.
- Part-Time Reductions: Under a new "Schedule of Reduction," federal loan eligibility will be proportionally reduced for students enrolled less than full-time 272930.
These caps are projected to affect roughly 25% to 40% of graduate borrowers, effectively reducing federal loan volume by $8 billion to $10 billion annually 15. While this limits federal exposure, economists warn that it may force students into the more predatory private loan market or restrict access to lucrative, high-cost professional degrees 34. To protect current students, the OBBBA includes "legacy provisions" allowing students currently enrolled in a program before July 1, 2026, to finish their expected credential (up to three academic years) under the old rules 272829.
Macroeconomic Ripple Effects: Housing and Consumer Spending
Student loan debt operates as a massive structural drag on the broader U.S. economy. When $1.84 trillion is diverted from personal balance sheets to federal loan servicers, the ripple effects reshape domestic consumption, entrepreneurship, and the housing market.
The Housing Market and Homeownership: Student loan obligations actively delay household formation and homebuying. According to 2025 analysis by The Kaplan Group, every $1,000 in student loan debt decreases the likelihood of a person owning a home by 1.8% 3536. First-time buyers saddled with student loans spend roughly 39% less on their homes compared to those without educational debt 35.
In practical terms, the average federal student loan payment of $382 per month severely reduces a buyer's purchasing power when qualifying for a mortgage. Analysis by Zonda in 2026 indicates that a buyer without student loan payments could afford a home priced around $316,400. Factoring in the average student loan obligation drops that affordability threshold to $298,700 - a nearly $20,000 reduction 37. As a result, 51% of renting student borrowers indicate their loan debt is the primary reason they have not purchased a home, delaying down payment timelines by up to seven years in some states 3637.
Consumer Spending and Business Growth: High debt-to-income ratios heavily suppress daily economic activity. Economists note that for every 1 percentage point increase in a consumer's student debt-to-income ratio, their consumption of goods and services declines by 3.7 percentage points 36. Roughly 18% of student loan holders report difficulty buying daily necessities because of their loans, and 28% have delayed purchasing a car 36.
Furthermore, student debt acts as a severe deterrent to entrepreneurship and small business creation. Individuals carrying more than $30,000 in student debt are 11% less likely to start a new business compared to debt-free peers 36. Even a modest $10,000 in student debt reduces the likelihood of starting a business by 7.37%, and business owners with student loans report business incomes that are 42% lower on average than unburdened founders 36.
Civic Trust and Psychological Toll: Beyond the balance sheet, the administrative chaos of the transition from SAVE to RAP, combined with mounting financial pressure, has eroded institutional trust. A late-2025 report by the Student Debt Crisis Center revealed that 73% of borrowers associate their student debt with stress, anxiety, and depression 49. Furthermore, only 34% of borrowers view the Department of Education as a trusted messenger, reflecting widespread frustration over unclear guidance, shifting rules, and the politicization of the repayment system 49.
Bottom line
The $1.84 trillion student loan crisis has reached a boiling point in 2026. A massive surge in delinquencies - concentrated heavily among lower-income borrowers, non-completers, and borrowers of color in the South - highlights the systemic failures of the prior decade's lending policies. The implementation of the One Big Beautiful Bill Act (OBBBA) in July 2026 aims to permanently alter the trajectory of this debt by eliminating unlimited graduate borrowing caps and transitioning millions into the 30-year Repayment Assistance Plan (RAP). While RAP guarantees that individual loan balances will stop endlessly compounding due to unpaid interest, the imposition of a strict $10 monthly floor and longer repayment terms ensures that the macroeconomic drag of student debt on housing and consumer spending will persist for decades.