Who Carries America's Credit Card Debt in 2026
Total U.S. credit card debt reached $1.25 trillion in the first quarter of 2026, with the average cardholder carrying a balance of roughly $6,500. While higher-income households hold the largest nominal balances, the burden of record-high interest rates falls disproportionately on lower-income and younger consumers, pushing serious delinquency rates to a 15-year high. As borrowing costs remain elevated, the credit market is splitting into a K-shaped reality where half of users effortlessly pay off balances while the other half rely on compounding revolving debt to survive.
The $1.25 Trillion Mountain: A Macroeconomic View
The landscape of American consumer debt has shifted dramatically since the post-pandemic recovery. As of the first quarter of 2026, total household debt in the United States stood at a staggering $18.8 trillion 12. While mortgages overwhelmingly dominate this figure, accounting for $13.19 trillion, non-housing debt has become the primary source of financial friction for the average consumer 12.
Credit card balances specifically sat at $1.252 trillion in Q1 2026, according to the Federal Reserve Bank of New York 34. This represents a slight seasonal decline of $25 billion from the all-time record of $1.277 trillion set in the fourth quarter of 2025 23. This first-quarter dip is a typical historical pattern - the last time card debt actually increased in Q1 was in 2001, aside from a flat reading in 2023 - as consumers use year-end bonuses and tax returns to pay down holiday spending 3.
However, the broader trajectory remains steeply upward. The Q1 2026 figure is an astonishing 63% higher than the pandemic-era low of $770 billion recorded in early 2021, and $325 billion above the pre-pandemic record set in 2019 35. U.S. commercial banks specifically hold a record $1.09 trillion of this revolving consumer loan debt on their own books 4.
To put this growth into perspective, total consumer debt is heavily layered across various lending vehicles, with credit cards being the fastest-growing segment. Averaging an annual growth rate of 10.2% over the last five years, credit card debt expansion has more than doubled the growth rate of all other consumer loans 6.
| Debt Category | Outstanding Balance (Q1 2026) | Year-Over-Year Trend / Note |
|---|---|---|
| Total Household Debt | $18.80 Trillion | +$18 billion (0.1% increase) from Q4 2025 12. |
| Mortgages | $13.19 Trillion | Grew by $21 billion; serious delinquencies at 1.5% 12. |
| Auto Loans | $1.69 Trillion | Grew by $18 billion; subprime growth continuing 127. |
| Student Loans | $1.66 Trillion | Decreased by $6 billion; serious delinquencies at 10.9% 169. |
| Credit Cards | $1.25 Trillion | Dropped $25 billion from Q4 2025; fastest long-term growth 26. |
| HELOCs | $446 Billion | Rose by $12 billion; 16th consecutive quarterly increase 2. |
When examining individual households, the average credit card debt per person in late 2025 and early 2026 hovered between $6,500 and $6,800, depending on the reporting bureau 78. TransUnion placed the average at $6,715 in December 2025, up $135 from the previous year 9. With approximately 636 million open credit card accounts in the U.S. and consumers holding an average of roughly four to five cards each, reliance on revolving credit has become a structural pillar of the modern American household budget 91011.
Transactors vs. Revolvers: A Divided Reality
To understand credit card debt in America, one must first recognize that the market is bifurcated into two entirely different consumer behaviors: "transactors" and "revolvers."
According to the American Bankers Association, the market is split into distinct segments: 42.4% are revolvers who carry a balance from month to month, 29.1% are transactors who pay in full each billing cycle, and 27.2% are dormant accounts 16. When looking only at active cardholders, roughly half revolve debt while the other half transact 1012.
These consumers experience the credit card market in vastly different ways. Transactors use credit cards primarily for convenience, fraud protection, and rewards programs that return an average of 1.6 cents per dollar spent 1113. Because they pay their statement balances in full, their effective interest rate is zero 12. For transactors, a credit card is a frictionless payment mechanism.
For revolvers, the credit card is a high-interest loan. Over 40% of all consumers carry balances or make only minimum payments, translating to roughly 111 million Americans currently classified as debt-stressed revolvers 101614.
Behavioral Responses to Interest Rates
The behavioral divide between transactors and revolvers becomes acutely visible when borrowing costs fluctuate. A 2026 study by the Federal Reserve Bank of Boston revealed that changes in Annual Percentage Rates (APRs) trigger vastly different responses based on account type 13.
For transactors, an increase in the APR has practically no impact on spending 13. Because they do not pay interest, a higher rate does not alter the cost of their daily purchases. However, revolvers are highly sensitive to rate hikes. The Boston Fed found that a 1 percentage point increase in a credit card's APR reduces a revolver's spending by nearly 15% in the following month - nearly double the overall average effect 13. For the average revolving account, a single percentage point hike equates to a $74 reduction in monthly inflation-adjusted spending 13.
Furthermore, when rates rise, higher-credit-score revolvers adjust by aggressively paying down their outstanding balances, while lower-credit-score revolvers simply cut their spending, highlighting a stark difference in household financial elasticity 13.
Algorithmic Targeting of Revolvers
Because revolvers generate the vast majority of profitability for credit card issuers through interest payments, they are specifically targeted by the algorithmic infrastructure of modern lending 15. Federal Reserve research into automated credit decisions indicates that banks continuously monitor spending behaviors and quietly initiate credit limit increases without the consumer requesting them 15.
While only 2% of transactors receive a bank-initiated limit increase each quarter, almost 4% of revolvers do 15.
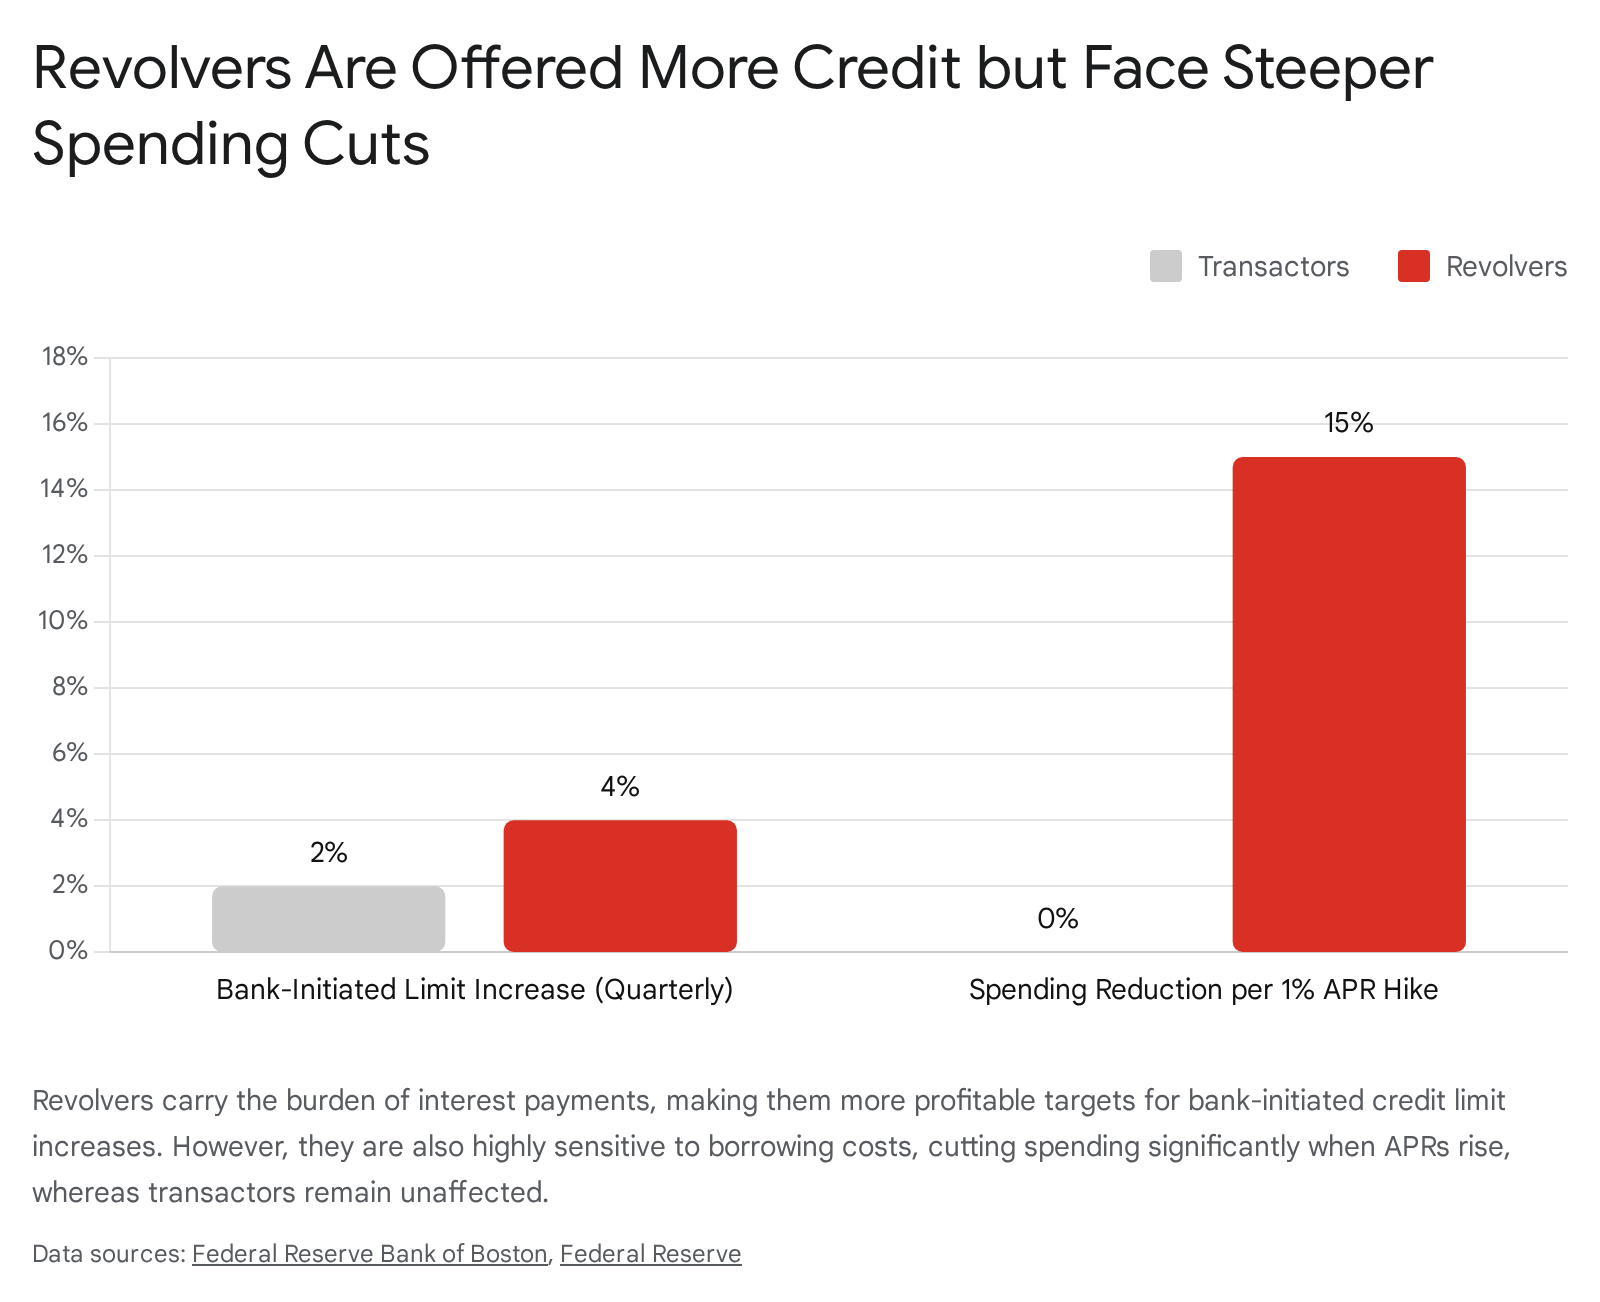
Interestingly, the rate at which consumers ask for limit increases is identical across both groups; the disparity is entirely driven by the lenders' backend algorithms targeting those who carry balances 15.
This practice presents a double-edged sword. It provides financially strained households with greater access to liquidity during emergencies, but it also facilitates deeper indebtedness. Federal Reserve data shows that when a revolver receives an algorithmic limit increase, about 30% of that new available credit is quickly consumed by new revolving debt 15.
The Generational Burden: Who Owes What?
The $1.25 trillion debt burden is not distributed evenly. It swells and shrinks in step with life stages, earnings power, available credit, and systemic economic pressures.
The Midlife Squeeze
Credit card debt traces a distinct arc over a consumer's lifetime. According to Experian data from mid-2025, debt balances peak during the prime working and child-rearing years before tapering off in retirement 921.
Generation X (Ages 46 - 61) carries the heaviest burden by a wide margin, with average balances hitting roughly $9,600 9. This generation is currently experiencing the ultimate financial squeeze. Many Gen X households are simultaneously juggling peak mortgage payments, college tuition for their children, and financial support for aging parents 21. Because they have longer credit histories and higher average incomes, they qualify for higher credit limits. This provides greater borrowing capacity but also enables larger, more expensive balances when variable APRs top 20% 21. Gen Xers also hold an average of 4.4 credit cards per person 9.
Millennials (Ages 30 - 45) carry the second-highest balances, averaging close to $6,730 21. For Millennials, housing costs are the primary budget dominator. With the median age of a first-time homebuyer now pushed to 38, this generation is taking on massive mortgage debt amid historically high home prices 21. When combined with lingering student loans and the exorbitant cost of childcare, many Millennials use credit cards to bridge the gap between their income and basic living expenses 21. A notable 53% of Millennials and 53% of Gen Xers carry a balance from month to month 16.
The Risks for Younger Borrowers
Generation Z (Ages 18 - 29) carries a relatively low nominal balance, averaging around $3,493 across roughly 2.2 cards 9. However, this lower nominal figure masks severe financial distress. Gen Z borrowers are often still in school or working entry-level jobs with lower median weekly earnings (around $796 for 20- to 24-year-olds) 21.
Because they lack cash buffers and have smaller credit limits, a single unexpected expense can max out a card, spike their credit utilization ratio, and accelerate interest charges 21. As a result, young adults aged 18 - 29 transition into 90-day delinquency at roughly three times the rate of borrowers aged 60 - 69 21.
Baby Boomers and the Silent Generation carry lower balances relative to their credit limits. The Silent Generation (aged 80 and up) maintains the lowest average balance at $3,445 9. Older adults benefit from decades of wealth accumulation; in 2025, Baby Boomers held 51% of the nation's wealth while holding less than 25% of its debt 17. However, those living strictly on fixed incomes still face challenges when inflation drives up the cost of necessities 21.
| Generation | Age Range (in 2026) | Average Balance | Percentage Carrying Debt |
|---|---|---|---|
| Generation Z | 18 - 29 | $3,493 | 40% |
| Millennials | 30 - 45 | $6,730 | 53% |
| Generation X | 46 - 61 | $9,600 | 53% |
| Baby Boomers | 62 - 80 | $4,000 - $5,000* | 43% |
| Silent Generation | 80+ | $3,445 | N/A |
| Data synthesized from Experian and Bankrate surveys (2025 - 2026) 7916. Boomer data often grouped with seniors.* |
The Wealth Paradox: Income, Gender, and Race
A common misconception is that credit card debt is strictly a low-income problem. While lower-income households are more likely to revolve a balance, higher-income households carry significantly larger nominal amounts of debt 81624.
Survey data reveals that 56% of cardholders with household incomes under $50,000 carry a balance from month to month, compared to 36% of those earning over $100,000 16. However, borrowers earning less than $25,000 a year carry average balances of roughly $3,500 to $4,000, whereas households with combined incomes over $150,000 carry average balances between $11,000 and $13,000 8.
Lifestyle Creep and Present Bias
For high earners, credit card debt is rarely a simple math problem; it is a psychological one. Behavioral economists attribute this to "present bias" - the gap between how people plan to spend in theory versus how they act at the checkout counter 24.
As income rises, larger purchases feel justifiable. A promotion leads to a larger apartment; a bonus leads to a luxury vehicle upgrade. This phenomenon, known as "lifestyle creep," results in spending that scales faster than actual cash flow 24. Furthermore, high earners often fall into the "I'll handle this later" trap 24. Because their monthly cash flow is robust, the minimum payment on a $12,000 credit card balance does not feel like an existential crisis 24. The debt is easily de-prioritized in favor of investments or immediate consumption, allowing the balance to quietly compound for years.
Conversely, for lower-income consumers, the debt is driven almost entirely by necessity. A 2026 report highlights that the share of income devoted to credit card payments is at a historic high, suggesting a pattern of "survival debt" where cards are used for groceries, utilities, and medical co-pays simply because wages have not kept pace with the cost of living 1418.
The Gender and Racial Debt Gaps
Demographic disparities extend deeply into gender and race. Experian data shows that American men hold a higher nominal average credit card balance ($7,407) than women ($5,245) 8. Yet, women are statistically more likely to carry a revolving balance - 50% of female cardholders revolve debt versus 43% of male cardholders 1616. This dynamic is largely tied to the persistent gender pay gap; in 2024, women working full-time earned just 81 cents for every dollar earned by their male counterparts, leaving less discretionary income to pay off statement balances at the end of the month 16.
A similar dichotomy exists along racial lines. White and Asian households carry the highest nominal average balances, ranging between $7,000 and $9,000 8. In contrast, Black and Hispanic families carry average balances between $4,000 and $6,000 8. This reflects structural differences in credit access, historical wealth accumulation, and the algorithmic assignment of credit limits, rather than a difference in reliance on credit.
The Geography of Debt: Balances by Region
Credit card debt is deeply tied to regional cost of living, local housing markets, and state-level economic health. An analysis of over 400,000 credit reports by LendingTree in late 2025 and 2026 highlights massive geographic disparities 3. Residents in the most indebted states carry nearly double the balances of those in the least indebted states 26.
The highest credit card balances are heavily concentrated in coastal states and regions with exorbitant housing costs. The District of Columbia, Alaska, Connecticut, New Jersey, and Maryland consistently rank near the top 3926. In these areas, the high cost of rent and mortgages absorbs a massive percentage of monthly income, forcing residents to place more variable expenses - from groceries to child care - onto credit cards.
Conversely, the states with the lowest average credit card debt are predominantly located in the South and Midwest. Mississippi, Arkansas, and West Virginia boast the lowest balances in the country, hovering around the $5,000 mark 3. While wages are generally lower in these states, the significantly lower cost of housing and utilities prevents the rapid accumulation of five-figure credit card debt.
Where Debt is Growing the Fastest
Total balance size is only one metric; the velocity of debt accumulation reveals where economic stress is building the fastest. According to a WalletHub analysis covering the end of 2025, the state of Maine experienced the most dramatic explosion in credit card debt, with balances jumping 7.8% in a single quarter to nearly $8,000 27.
Washington state also saw a troubling 11.8% year-over-year increase, driving its average balance past $9,000 3. Other states experiencing double-digit percentage increases included South Dakota, Nebraska, and Wisconsin 3. On the other end of the spectrum, New Mexico residents managed to successfully reduce their average debt by over 10.3% year-over-year 3.
| State Rank (Highest Debt) | State | Average Credit Card Debt | Average Credit Score |
|---|---|---|---|
| 1 | Alaska | $10,800 | 711 |
| 2 | Connecticut | $9,408 | 725 |
| 3 | New Jersey | $9,201 | 722 |
| ... | ... | ... | ... |
| 48 | West Virginia | $5,336 | N/A |
| 49 | Arkansas | $5,259 | N/A |
| 50 | Mississippi | $4,887 | N/A |
| Selected states highlighting the extremes in average credit card debt (Late 2025/Early 2026 data) 326. |
The Cost of Borrowing: Record APRs and the Minimum Payment Trap
The sheer volume of national debt ($1.25 trillion) is severely compounded by the astronomical cost of servicing it. In 2026, credit card interest rates remain near historic highs, fundamentally altering the math of household finance.
As of Q1 2026, the average APR across all active credit card accounts was 21.00% 319. However, this figure is diluted by promotional rates and dormant cards. The metric that truly matters is the average APR for accounts assessed interest - meaning cards that actually carry a revolving balance. That figure stood at a punishing 21.52% in the first quarter 319. For consumers applying for a new credit card, the landscape is even harsher; the average APR offered on new cards climbed to 23.79% by May 2026, with subprime applicants facing maximum rates well over 27% 319.
These rates persist despite the Federal Reserve initiating rate cuts in late 2025 1619. The Fed lowered the federal funds rate in September, October, and December of 2025, bringing minor relief to the broader market 1619. However, inflation proved stubborn in early 2026, leading the Fed to pause its cutting cycle through the first half of the year 31920. Consequently, credit card APRs - which are variable and directly tied to the prime rate - remained deeply elevated 3.
The Mathematics of Minimum Payments
When APRs exceed 21%, the mechanics of revolving debt become predatory to the mathematically unaware. A massive 22% of credit card users only make the minimum monthly payment on their balances 1116. Furthermore, the percentage of accounts making only minimum payments rose to over 11.1% by late 2024 and early 2025, a classic indicator of deepening financial distress 610.
The "minimum payment trap" generates massive profits for issuers while keeping borrowers indentured for decades. For example, if a consumer holds the national average balance of $6,715 at an APR of 21.52% and pays a fixed $150 per month, it will take them 93 billing cycles (nearly 8 years) to clear the debt 9. Over that period, they will pay more than $7,000 in pure interest - more than the original principal borrowed 9.
At the macro level, this translates to an immense transfer of wealth. Americans paid an estimated $181 billion in credit card interest charges in 2025, more than double the $75 billion paid just four years prior in 2021 16.
The Illusion of Relief: Balance Transfers and Bank Profitability
Historically, financially savvy consumers utilized 0% APR balance transfer cards to escape high-interest debt. By shifting a balance to a promotional card, borrowers could attack the principal aggressively without fighting the headwind of monthly interest charges 9.
However, in 2026, this escape hatch is closing for many. As overall credit standards have tightened and banks worry about rising defaults, fewer lucrative balance transfer offers are available to middle- and lower-tier credit scorers 7. Consequently, borrowers who desperately need rate relief are locked into their existing 20%+ APRs, accelerating their path toward default.
Paradoxically, while consumers are paying record interest, credit card issuer profitability has actually declined. The Federal Reserve's report on credit card operations shows that the Return on Assets (ROA) for major credit card banks fell from a pandemic-era peak of 9.6% in 2021 to an estimated 2.8% in 2024 16. The explanation is simple: as charge-offs and defaults rise, banks are forced to set aside billions in loan-loss provisions, directly eating into the massive margins generated by 21% APRs 16.
The Breaking Point: Delinquencies Hit a 15-Year High
The combination of $1.25 trillion in balances and 21% interest rates has finally breached the levy of consumer resilience. In the first quarter of 2026, the Federal Reserve Bank of New York reported that serious credit card delinquencies - defined as balances 90 days or more past due - skyrocketed to 13.1% 71830.
This 13.1% figure is staggering. It represents the highest serious delinquency rate in 15 years, closely approaching the 13.7% peak hit in late 2010 during the agonizing aftermath of the Great Recession 30. More alarming is the velocity of the collapse: serious credit card delinquencies climbed 5.5 percentage points since Q3 2022, a pace of deterioration that actually exceeds the rate of failure seen between 2007 and 2010 30.
Let that sink in: more than one in eight credit card dollars in America is currently in serious default 730.
The K-Shaped Credit Crisis
The 13.1% delinquency rate does not mean the entire economy is failing; rather, it highlights a violently "K-shaped" credit environment 7921.
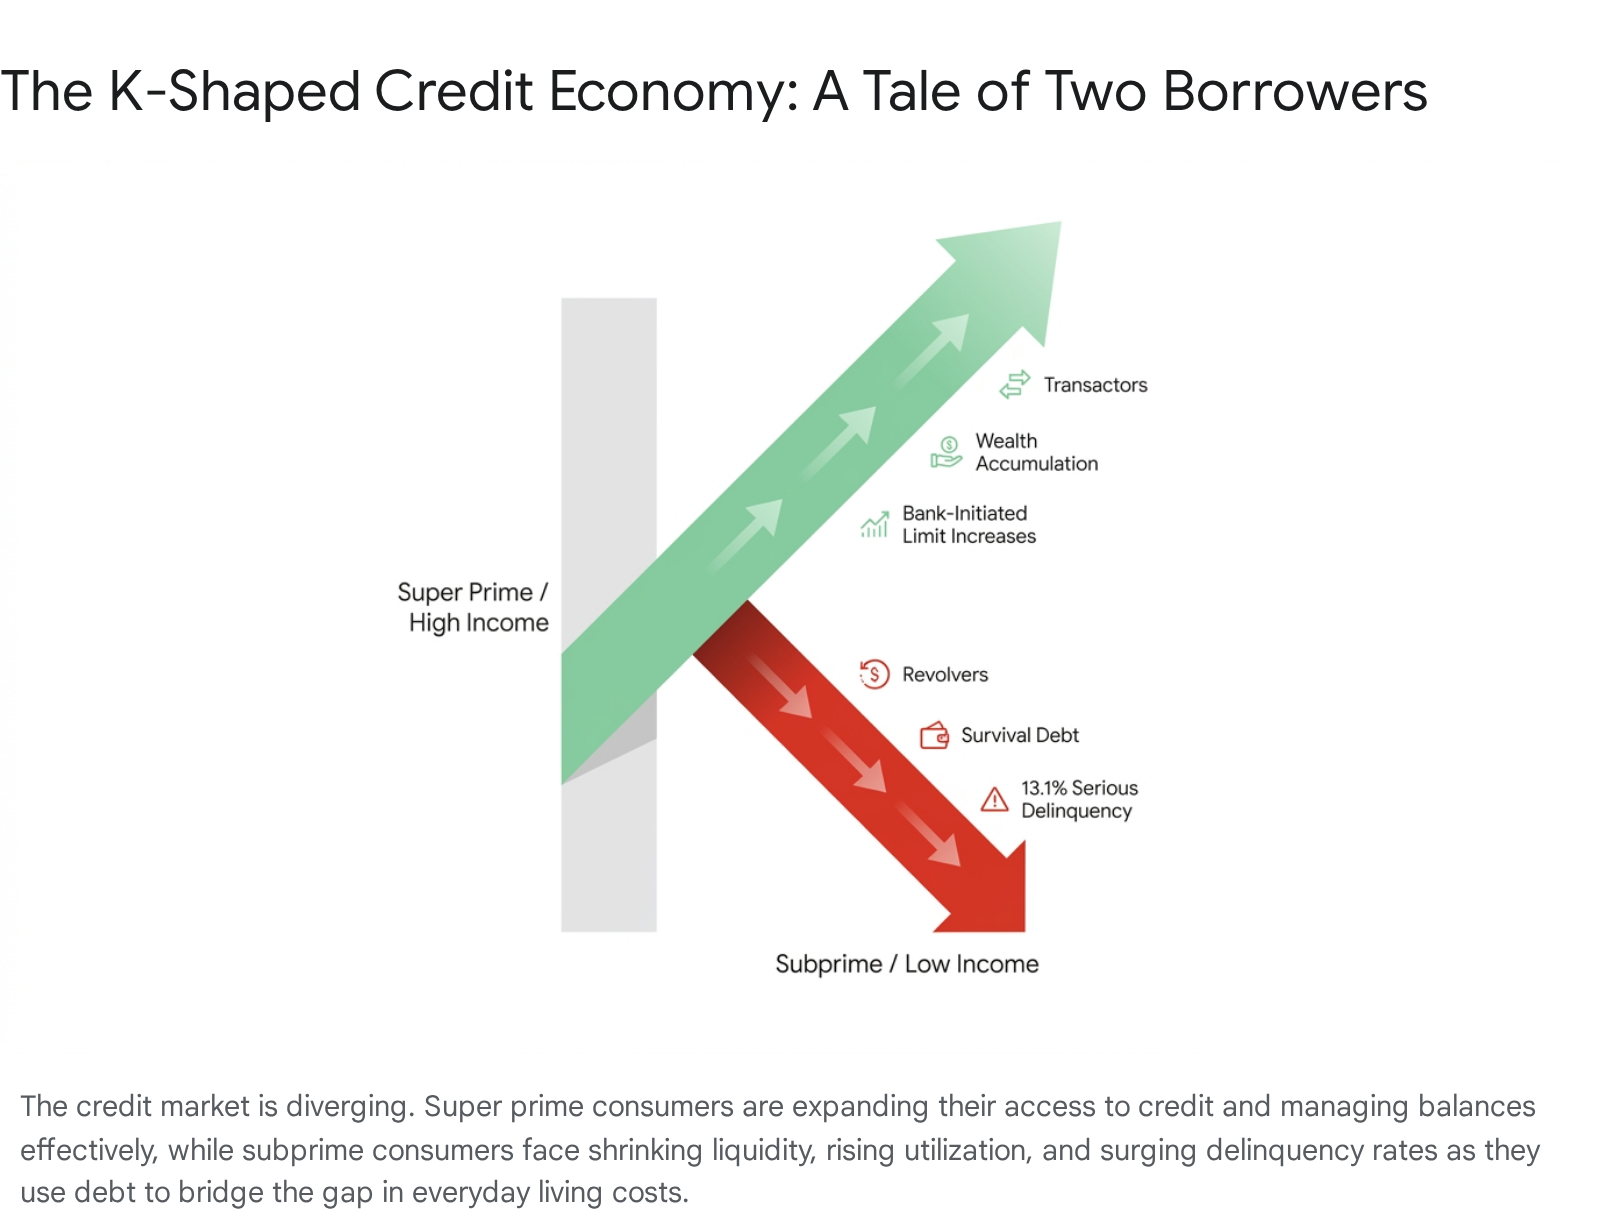
At the top of the 'K', prime and super-prime borrowers are thriving. Between 2019 and 2025, the super-prime segment actually expanded by 15 million consumers 21. These high-income individuals are upgrading their credit profiles, securing massive bank-initiated limit increases, and continuing to spend heavily 21. While their total debt balances have risen 25%, their debt-to-income ratios remain healthy, and their delinquency rates are negligible 21.
At the bottom of the 'K', the subprime segment is collapsing under the weight of sustained inflation and high borrowing costs. At smaller commercial banks (outside the top 100 by asset size), which heavily service lower-income and subprime borrowers, aggregate credit card delinquency rates stand at a brutal 6.43% compared to the sub-3% rates seen at mega-banks 5.
This divergence explains a paradox in the Q1 2026 data: total credit card balances ticked down slightly (due to prime borrowers paying off debt), but delinquency rates surged (due to subprime borrowers running out of cash) 30. Consumers are no longer piling on new discretionary debt at the same rate; rather, the "survival debt" they already carry has simply become impossible to service 30.
Why Are Americans Borrowing So Much?
The narrative that credit card debt is driven purely by reckless discretionary spending is empirically false in 2026. The data clearly shows that the majority of revolving debt is born from systemic affordability crises.
When surveyed, 41% of credit card debtors stated their balances stem primarily from emergency or unexpected expenses 16. This includes medical bills (12%), home repairs (8%), and car repairs (8%) 16. The American healthcare system is a particularly aggressive driver of debt. An AARP survey revealed that a record 49% of adults reported their monthly healthcare expenses had risen over the past year 22. Among financially insecure adults carrying credit card debt, more than half explicitly cited healthcare costs as the primary driver of their revolving balances 22.
The second major driver is day-to-day survival. One-third (33%) of debtors cite daily expenses such as groceries, childcare, and utilities as the source of their credit card debt, a steady increase from 28% in 2024 and 26% in 2023 16. Persistent inflation throughout the early 2020s fundamentally reset the baseline cost of living. Even though the rate of inflation cooled by 2026, the prices of goods remained permanently elevated, outstripping the wage gains of the lower and middle classes 5.
The Hidden Debt: Buy Now, Pay Later (BNPL)
The true extent of American consumer distress is actually underreported by official credit card statistics, thanks to the explosion of the "Buy Now, Pay Later" (BNPL) industry.
By 2025, BNPL transaction volume reached an estimated $70 billion, representing nearly one-third of total credit card debt volume 510. Originally marketed as a tool for financing discretionary items like electronics and apparel, BNPL has morphed into a lifeline for basic survival. In 2026, nearly 24% to 29% of BNPL users report using these installment loans to buy groceries - more than double the rate from two years prior 510.
Because many BNPL loans are not reported to the major credit bureaus in the same way as revolving credit cards, they represent a massive "shadow debt" market 33. Nearly half (47%) of BNPL users missed at least one payment in the past year, and over half admit they could not make ends meet without these micro-loans 5. This suggests that the 13.1% credit card delinquency rate is merely the visible tip of a much larger consumer insolvency iceberg. As a response, consumers are increasingly leaning on credit card-based installment plans, which rose from 23% utilization in April 2025 to 36% in March 2026 23.
The 2026 Federal Reserve Outlook: When Will Relief Arrive?
The future of American credit card debt is intrinsically tied to the monetary policy of the Federal Reserve. Because credit card interest rates are variable, they will only fall when the Fed lowers its benchmark federal funds rate.
Heading into the summer of 2026, the outlook remains highly uncertain. The Fed held rates steady at 3.50% to 3.75% during its spring meetings, maintaining a "wait-and-see" approach 2425. Ongoing geopolitical tensions - such as the conflict in the Middle East driving up energy prices - and massive capital spending on AI infrastructure have created upward pressures on inflation, complicating the path to further rate cuts 182526.
Financial analysts are divided. Goldman Sachs forecasts that economic growth will re-accelerate in 2026, predicting that the Fed will resume rate cuts in March and June, potentially pushing the terminal rate down to a 3% to 3.25% range 20. Conversely, J.P. Morgan Global Research predicts the Fed will hold rates steady for the entirety of 2026, citing persistent core inflation and unanchored expectations 25. The market itself has significantly pared back its expectations; while investors anticipated multiple rate cuts in early 2026, many now expect only one, or potentially zero, cuts before the end of the year 27. Adding to the uncertainty, Fed Chairman Jerome Powell's term expires in May 2026, meaning a new Chair will be steering monetary policy during a highly fragile economic period 24.
Bottom line
The average American currently carries roughly $6,500 to $6,800 in credit card debt, contributing to a massive $1.25 trillion national total. While high-income "transactors" continue to benefit from the convenience and rewards of credit cards, the 50% of consumers who revolve balances are being crushed by interest rates exceeding 21%, resulting in a 15-year high serious delinquency rate of 13.1%. What remains uncertain is how the Federal Reserve will navigate interest rate policy throughout the rest of 2026; if rates remain elevated, the wave of defaults currently concentrated among subprime and younger borrowers may soon spread upward into the middle class.