How Much Student Loan Debt Is Too Much for Your Major
A universally accepted rule of thumb is that your total student loan debt at graduation should not exceed your anticipated first-year salary. However, with the rising cost of living, an artificial intelligence-driven contraction in entry-level hiring, and a massive 2026 overhaul of the federal student loan repayment system, adhering to this rule requires exact calculations tailored to your specific major, degree level, and geographic location.
The Evolution of the "First-Year Salary" Rule
Financial analysts, educational economists, and lending institutions generally advise that a student's total borrowing should not exceed their expected starting salary upon graduation 12. The logic underpinning this guideline is rooted in healthy debt-to-income (DTI) ratios. To maintain financial stability and qualify for future credit, such as a mortgage or an auto loan, consumers are advised to keep their total debt obligations below 36% of their gross income, a benchmark frequently referred to as the 28/36 rule 234. If student loan payments consume more than 10% to 15% of your monthly take-home pay, securing housing, managing medical expenses, and saving for retirement becomes mathematically difficult 5.
As of late 2025 and early 2026, the macroeconomic environment surrounding student debt in the United States is highly strained. Americans owe an estimated $1.77 trillion to $1.85 trillion in total student loan debt, with federal loans accounting for roughly 90% of the market 6785. The average federal student loan debt stands at approximately $39,375 to $39,547 per borrower 61112. Meanwhile, the average projected starting salary for a bachelor's degree graduate in the Class of 2025 is $68,680 7. On a macro level, the "average" graduate appears to fit comfortably within the established rule of thumb, carrying a debt load that is slightly more than half of their expected first-year earnings.
However, this national average obscures massive disparities across different demographic cohorts and fields of study. Student debt does not exist in a vacuum; it compounds alongside other consumer obligations. Data from the Federal Reserve and major credit bureaus reveals that while Millennials hold the highest average student loan balances per person, Generation X carries the heaviest overall consumer debt burden as they juggle mortgages, auto loans, and lingering educational debt 858.
| Generation | Age Range (as of 2025) | Average Total Debt | Average Student Loan Debt |
|---|---|---|---|
| Generation Z | 18 - 28 | $34,328 8 | ~$15,951 8 |
| Millennials | 29 - 44 | $132,280 8 | ~$25,471 - $27,648 58 |
| Generation X | 45 - 60 | $158,105 8 | ~$21,268 - $27,956 58 |
| Baby Boomers | 61 - 79 | $92,619 8 | ~$21,268 - $22,734 58 |
Note: Averages represent the total debt load across all consumers in the demographic, including those without student loans. Adjusted 2024/2025 data.
Because younger borrowers often have thinner credit files and lower initial incomes, high educational debt disproportionately impacts their borrowing power for other essential life milestones 8. Studies indicate that 72% of student debt holders believe their loans will delay them from purchasing a home, and 36% of borrowers report moving back in with family after college strictly due to their debt burden 3. Consequently, deciding how much debt is "too much" requires a granular look at the shifting legal landscape of student lending and the specific return on investment of individual career paths.
The 2026 Overhaul: Borrowing Caps and the OBBBA
To accurately project how much debt is manageable, borrowers must understand the exact mechanisms of loan origination and repayment. The landscape of student lending is undergoing a historic shift due to the One Big Beautiful Bill Act (OBBBA), a budget reconciliation package signed into law in July 2025 that implements sweeping changes effective July 1, 2026 9101112. The law fundamentally alters borrowing limits and repayment structures, forcing students to calculate their financial exposure much earlier in their academic careers.
The Implementation of Strict Borrowing Ceilings
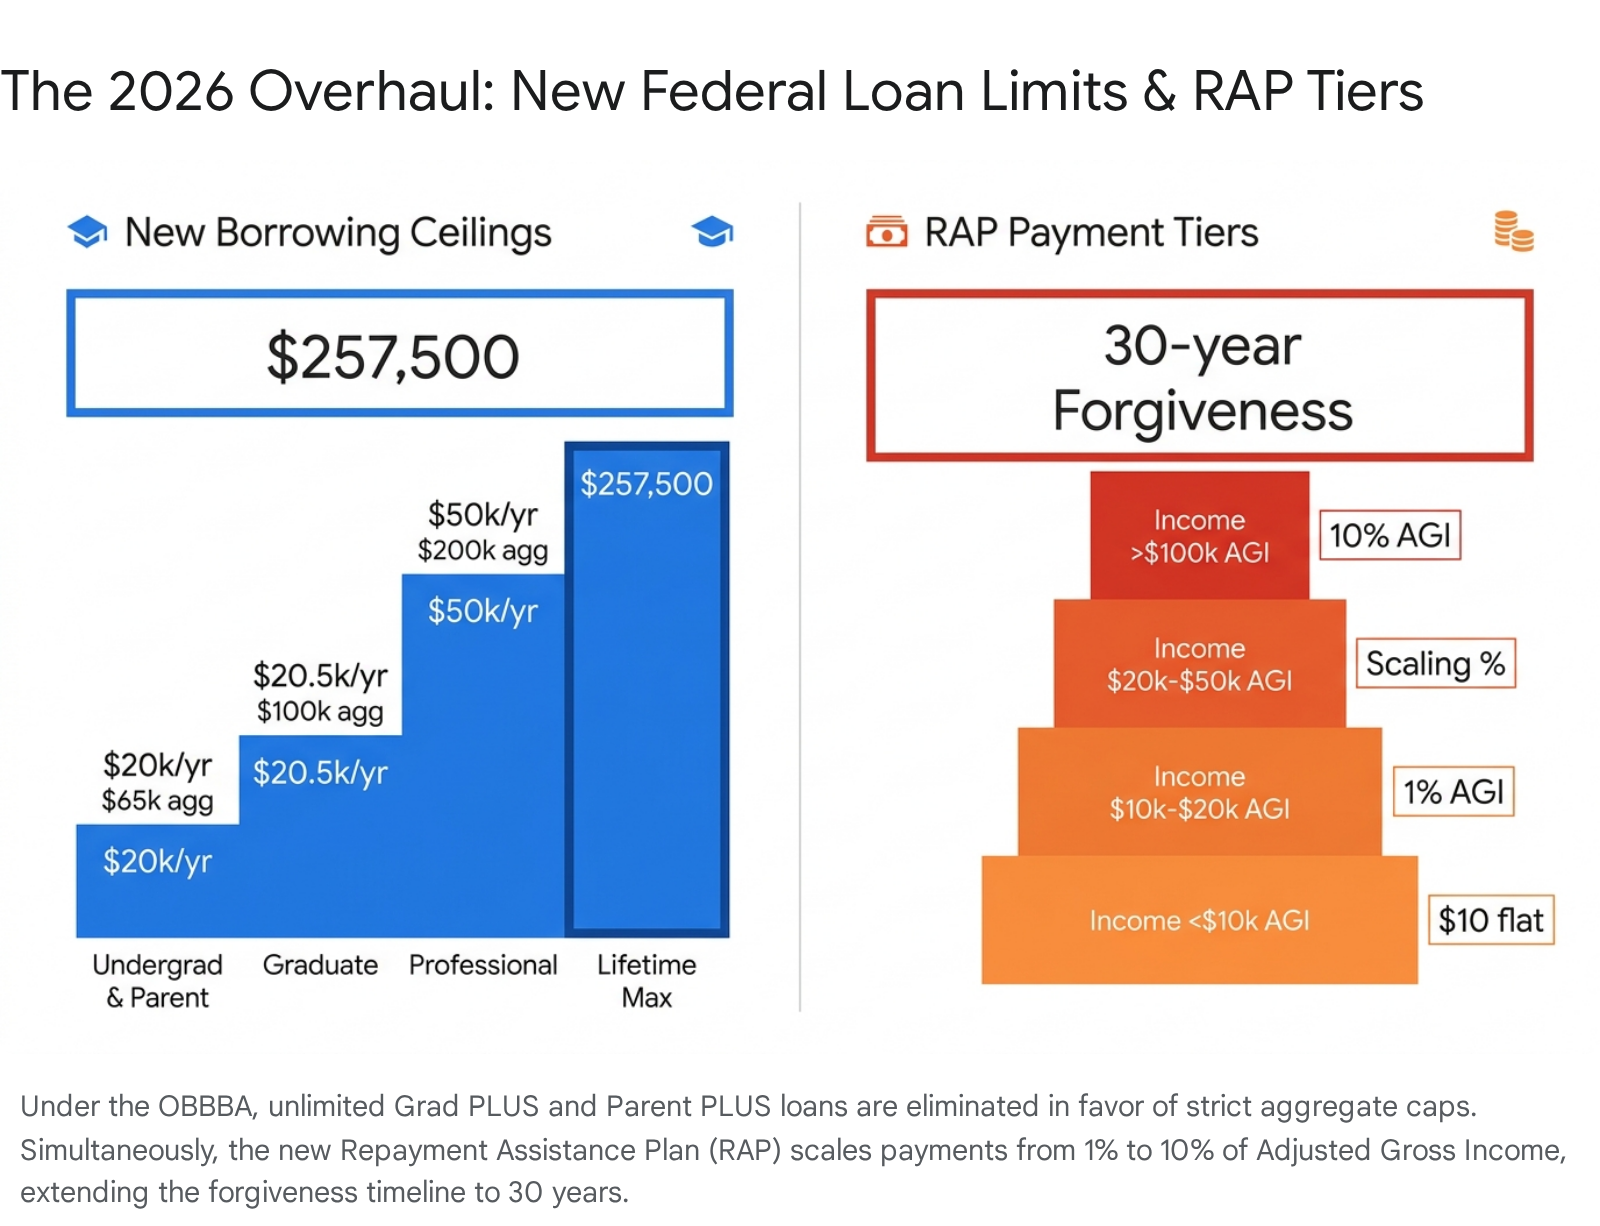
Prior to 2026, graduate students and parents of dependent undergraduates could utilize federal PLUS loans to borrow up to the full cost of attendance minus any other financial aid received. This uncapped allowance frequently resulted in six-figure debt loads for degrees that did not yield corresponding six-figure salaries 61314. Critics argued that unlimited Grad PLUS lending enabled unsustainable borrowing and allowed institutions to raise tuition unchecked 6. The OBBBA explicitly eliminates the Graduate PLUS and Parent PLUS loan structures in their previous forms, enforcing strict new annual and lifetime ceilings intended to prevent overborrowing 101314.
The new federal borrowing limits effective July 1, 2026, are structured as follows:
| Borrower Category | New Annual Limit | New Aggregate/Lifetime Limit |
|---|---|---|
| Dependent Undergraduates (Parent Loans) | $20,000 per year, per dependent child 91013. | $65,000 total cap per dependent child 91013. |
| Graduate Students | $20,500 annually 91013. | $100,000 aggregate cap 91013. |
| Professional Students (e.g., Medical, Law) | $50,000 annually 91014. | $200,000 aggregate cap 91014. |
| Absolute Lifetime Maximum | N/A | $257,500 across all federal direct loans 914. |
These statutory limits act as a guardrail against insurmountable federal debt, but they also shift the financial burden upfront. Graduate students, who previously accounted for roughly half of new federal lending annually, will be profoundly impacted 10. Approximately 26% of graduate students currently borrow above the new annual caps, and 40% of degree completers possess cumulative debt exceeding the new aggregate limits 10.
Students pursuing high-cost master's programs in fields with lower starting salaries will no longer be able to finance the entire degree through the federal government 610. If a program costs $60,000 a year, the student is capped at $20,500 in federal loans and must cover the remaining $39,500 through savings, scholarships, or the private student loan market 613. Because private lenders utilize risk-based underwriting - meaning they assess the borrower's credit score and future ability to repay before approving a loan - students entering low-paying fields may find themselves unable to secure financing to complete expensive degrees 6.
The Sunsetting of Legacy IDR Plans
For loans issued on or after July 1, 2026, the complex web of legacy Income-Driven Repayment (IDR) plans - such as SAVE, PAYE, and ICR - will be eliminated 1516. These legacy plans were historically designed to offer relief by capping payments at a percentage of discretionary income. However, following legal challenges to the SAVE plan in 2025, Congress mandated a simplified, two-path system for all future borrowers 101523. Borrowers with legacy loans must select a new plan by 2028, while all new borrowers originating loans after July 1, 2026, will strictly choose between two primary paths 1117:
- The Tiered Standard Repayment Plan: Unlike the traditional 10-year Standard plan, the new Tiered Standard Plan adjusts its repayment term based on the borrower's total outstanding balance 1116. Borrowers will face fixed monthly payments over terms spanning 10, 15, 20, or 25 years 161718. For example, balances between $50,000 and $99,999 require a 20-year term, while balances exceeding $100,000 trigger a 25-year term 18. This plan is not income-driven and offers no forgiveness; the borrower is required to pay the balance in full 1618. It is generally best suited for high-income earners who want to minimize the total amount of interest paid over the life of the loan 16. Notably, payments made under the Tiered Standard Plan do not count as qualifying payments for Public Service Loan Forgiveness (PSLF) 18.
- The Repayment Assistance Plan (RAP): RAP will become the sole income-driven option for new borrowers 1119. Unlike legacy plans that relied on "discretionary income," RAP calculates monthly payments based strictly on a percentage of the borrower's Adjusted Gross Income (AGI) 1227.
The Mechanics of the Repayment Assistance Plan (RAP)
The RAP system operates on a progressive, tiered bracket system that increases the payment percentage as the borrower's income rises. The fundamental tradeoff of RAP is that while it protects low-income earners with manageable minimums, it lacks a payment cap for high earners and extends the timeline to forgiveness.
For borrowers with an AGI under $10,000, RAP requires a minimum flat payment of $10 per month 1227. From there, the required payment increases by 1% of AGI for every $10,000 in additional income 1227. For example, a borrower earning between $10,001 and $20,000 pays 1% of their AGI, a borrower earning between $40,001 and $50,000 pays 4% of their AGI, and anyone earning $100,001 or more pays a flat 10% of their AGI 1227. Borrowers are permitted to deduct $50 a month from their calculated payment for each dependent child claimed on their tax return 1827.
One of the most critical structural changes under RAP is the elimination of the payment cap 1418. Under legacy plans like PAYE or IBR, a borrower's monthly payment was capped at the amount they would have paid under the standard 10-year plan, regardless of how high their income climbed 15. RAP does not offer this protection. If a borrower's income rises significantly over the life of the loan, their RAP payment can exceed what their standard 10-year payment would have been 1518.
However, RAP does provide a vital safety net: it waives unpaid monthly interest to prevent negative amortization 1114. If your calculated RAP payment is too low to cover the interest accruing on your loan, the government subsidizes the difference, ensuring that your principal balance never grows while you remain compliant with the plan 14.
For borrowers relying on loan forgiveness, the timelines have fundamentally shifted. While RAP remains the primary eligible plan for Public Service Loan Forgiveness (achieved after 10 years of qualifying public sector work), private-sector borrowers must make 360 qualifying monthly payments - equivalent to 30 years - before any remaining balance is forgiven 11121827. This is a significant extension from the 20 to 25-year timelines offered under legacy IDR plans, meaning that borrowers who take on excessive debt relative to their income may be tethered to repayment well into their late fifties or early sixties 1218.
Analyzing the Debt-to-Income Ratio by Major
To accurately determine if a specific debt load is "too much," borrowers must analyze the return on investment of their intended major. The National Association of Colleges and Employers (NACE) projects that starting salaries for the Class of 2025 will range widely based on discipline, with science, technology, engineering, and mathematics (STEM) degrees continuing to command premiums, while humanities, communications, and social sciences see slight declines in initial earning power 72021.
When these projected starting salaries are juxtaposed against the median debt loads carried by graduates in those specific disciplines, stark differences in educational debt-to-income ratios emerge.
| College Major (Bachelor's Level) | Projected Starting Salary (2025) | Median Student Debt | Estimated Debt-to-Income Ratio |
|---|---|---|---|
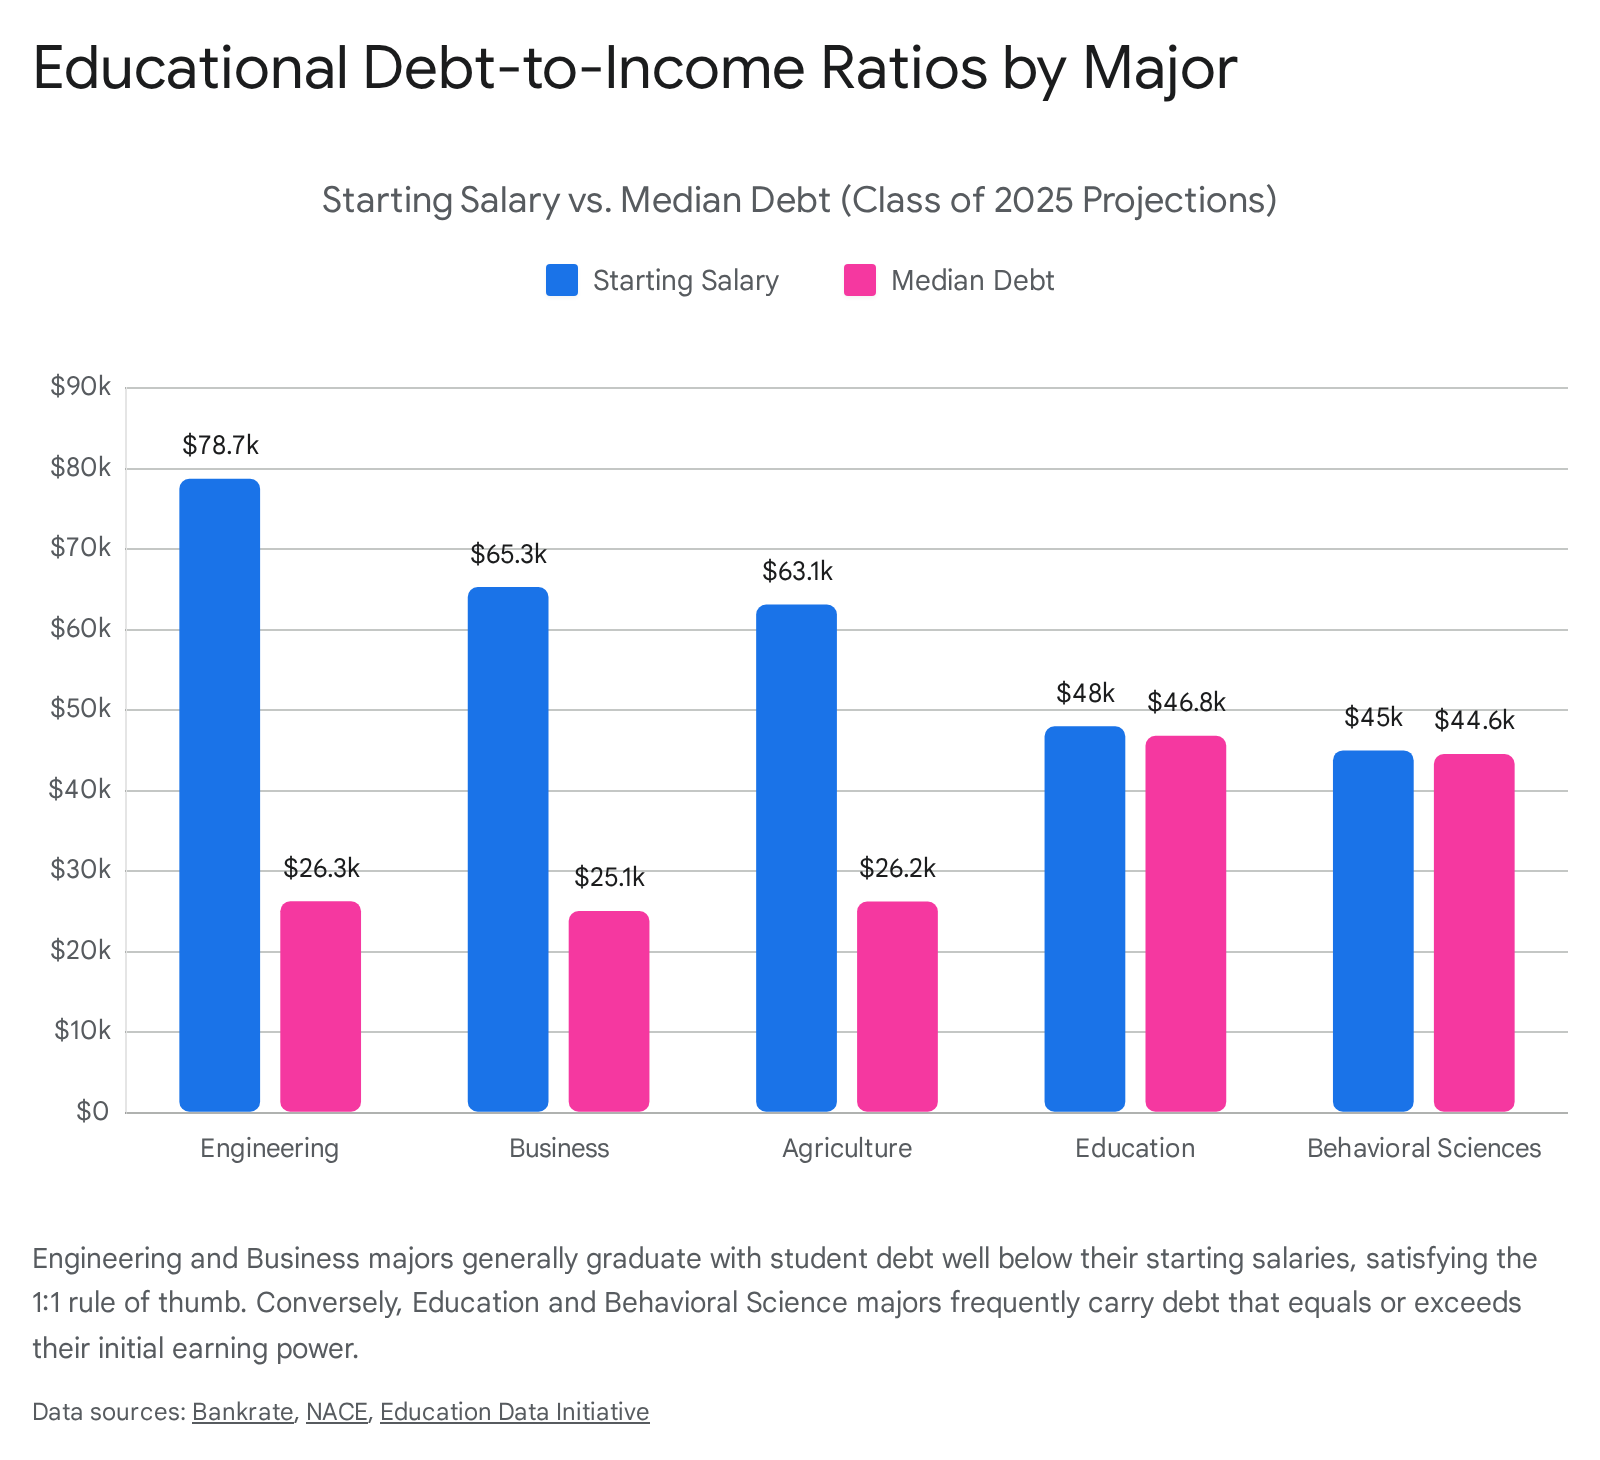
| Engineering (Overall) | $78,731 721 | $26,254 (Aerospace) 1 | ~33.3% |
| Computer Sciences | $76,251 721 | ~$25,000 - $30,000 | ~35.0% |
| Math and Sciences | $69,709 21 | ~$25,000 - $30,000 | ~39.5% |
| Business / Accounting | $65,276 2021 | $25,060 (Accounting) 1 | ~38.3% |
| Agriculture / Nat. Resources | $63,122 720 | $26,223 1 | ~41.5% |
| Communications | $60,353 20 | ~$28,000 - $32,000 | ~49.7% |
| Education (Curriculum) | ~$45,000 - $50,000 | $46,820 1 | >95.0% |
| Behavioral Sciences | ~$40,000 - $50,000 | $44,554 1 | >95.0% |
Note: Educational Debt-to-Income (DTI) in this specific context represents the total student debt divided by the anticipated first-year salary. A financially healthy ratio is considered to be well below 100% (a 1:1 ratio), ensuring the borrower has sufficient disposable income for other living expenses.
Engineering and computer science majors exhibit highly favorable economics. For instance, a software or computer engineering graduate might enter the workforce with a starting salary exceeding $82,000 21. If they carry the median debt load of roughly $26,000 to $30,000, their educational DTI sits comfortably around 35%. This debt load is highly manageable on a standard repayment plan and leaves ample room in a monthly budget for housing and savings 121.
Conversely, students majoring in Curriculum and Instruction graduate with the highest median debt among all bachelor's programs ($46,820) while entering a field with notoriously stagnant starting salaries 1. The disparity is even more severe in specialized assessment fields; new graduates holding a Bachelor's of Educational Assessment, Evaluation, and Research have an alarming median debt-to-income ratio of 154.1% 1. For these graduates, entering an income-driven plan like RAP is not an optional optimization strategy; it is a mathematical necessity to avoid immediate default upon leaving school.
Real-World Scenarios: High-Earning vs. Credential-Heavy Careers
To fully grasp how debt ceilings and repayment plans dictate life choices, it is instructive to compare two fundamentally different career tracks: Software Engineering and Social Work.
The Software Engineer: High Floor, Rapid Scaling
The technology sector, despite recent market corrections, continues to offer a lucrative path for recent graduates. According to the Bureau of Labor Statistics, the median annual wage for software developers in the United States is $133,080, sitting at roughly 2.7 times the national median for all occupations 30. Entry-level developers typically start between $75,000 and $95,000 in base salary 30.
Crucially, software engineering rarely requires a graduate degree for significant career advancement. A bachelor's degree - and increasingly, just a robust portfolio or intensive bootcamp certification - is often sufficient to enter the field and ascend to senior positions 22. If a developer graduates with the national average student debt of $35,639 and starts at a conservative $85,000, their educational DTI is a highly sustainable 41% 11. Furthermore, with senior developers commanding base salaries up to $185,000, and total compensation packages at top-tier tech firms frequently exceeding $350,000, these professionals can aggressively overpay their Tiered Standard Plan and eliminate their debt within a few years 30. For an aspiring software engineer, borrowing $50,000 or even $60,000 is generally considered a safe, high-yield investment.
The Social Worker: The Credential Trap
Social work represents a vital public service, but its underlying economics are notoriously punishing for those who enter the field. The BLS reports the median annual wage for social workers across all specialties is $61,330 23. Entry-level social workers start around $49,353, and mid-career professionals with five to ten years of experience average $62,469 24.
Unlike software engineering, career progression and salary scaling in social work are heavily gatekept by advanced graduate degrees. Earning a Master of Social Work (MSW) and becoming a Licensed Clinical Social Worker (LCSW) is required for clinical practice and opens the door to higher-paying opportunities, providing an average salary premium of about $13,000 a year over those holding only a Bachelor of Social Work (BSW) 2425. Doctoral degrees (PhD or DSW) offer further premiums of $20,000 to $25,000 annually, generally leading to academia or senior administration 2425.
However, acquiring an MSW or doctorate means taking on substantial graduate-level debt. While undergraduate debt averages around $35,000, borrowers who hold master's degrees owe an average of $69,140 each 611.
If a social worker takes on $70,000 in debt to achieve an MSW and a starting salary of $52,000, their debt-to-income ratio is an unsustainable 134%. Under the 2026 regulations, they would be funneled into the RAP program out of necessity 1116. Earning $52,000, their payment under RAP would be roughly $216 a month (5% of AGI, assuming no dependent deductions) 27. Because RAP waives unpaid interest, their balance will not explode, but they will be tethered to this payment for 10 years (if entirely employed by qualifying government or non-profit entities for PSLF) or 30 years in the private sector 111223. For a social worker, borrowing more than $40,000 to $50,000 requires resigning oneself to decades of income-driven repayment.
Location Matters: The Regional Cost of Living Factor
Student loan debt does not exist in isolation; it competes directly with housing, food, transportation, and healthcare. Therefore, the definition of "too much debt" depends entirely on where your career forces you to live and work.
Financial planners recommend the 50/30/20 budget framework: 50% of take-home pay is allocated to necessities, 30% to discretionary spending, and 20% to savings and debt repayment 26. In 2024, the average U.S. household spent $26,266 annually on housing, $13,318 on transportation, $10,169 on food, and $6,197 on healthcare 4.
However, geographic disparities can shatter the 50/30/20 rule instantly. In high-demand metropolitan areas, baseline costs render national averages irrelevant. For example, in New York City, an analysis of the "True Cost of Living" (TCOL) - which calculates the total resources a family requires to meet basic needs without relying on public assistance or accumulating debt - found that a single adult requires an estimated $70,334 annually just to survive 27. For a family of four in NYC, that threshold skyrockets to $166,279 27.
In contrast, midwestern and southern cities offer dramatically different financial landscapes. In Indianapolis, a single adult requires roughly $85,197 to live comfortably with full discretionary padding, while a family of four in Memphis needs a combined household salary of $198,349 to maintain that same comfortable standard, making it one of the most affordable large cities for families 26.
| City / Location | Estimated Salary for a Single Adult to Live Comfortably | Estimated Salary for a Family of Four to Live Comfortably |
|---|---|---|
| San Jose, CA | High (Often exceeds $120,000+) | Highest nationwide |
| New York City, NY | $70,334 (Baseline Survival TCOL) 27 | $166,279 (Baseline Survival TCOL) 27 |
| Indianapolis, IN | $85,197 (Comfortable) 26 | $222,726 (Comfortable) 26 |
| Memphis, TN | Low | $198,349 (Comfortable) 26 |
If our hypothetical social worker earns $65,000 and lives in New York City, their take-home pay cannot cover the baseline TCOL of $70,334 27. Any student loan payment - even a moderate $200 monthly bill - must be funded by sacrificing basic necessities, reducing consumption, or accumulating high-interest credit card debt. Indeed, 36% of New Yorkers report being unable to make ends meet, with many relying on short-term debt products like cash advances and "Buy Now, Pay Later" apps simply to cover routine expenses 2829.
Conversely, the geographic arbitrage available to high earners like software engineers presents a different calculus. While a developer earning $133,000 in a tech hub like San Francisco will face extremely high housing costs, their absolute income still allows for robust savings 30. For tech workers willing to relocate internationally, the purchasing power shifts dramatically. An analysis of European tech hubs reveals that while cities like Warsaw or Madrid offer lower gross salaries (€60,000 to €100,000), their drastically lower cost of living allows senior professionals to achieve savings rates of 50% to 60% 39. Meanwhile, jurisdictions like Dubai offer a zero-income-tax environment that allows high earners to aggressively stockpile cash, albeit with cultural and climate trade-offs 39.
Therefore, if your chosen career requires you to live in a high-cost metropolitan area to secure employment, your tolerance for student debt must be aggressively revised downward to accommodate housing and transportation costs.
Public vs. Private Universities: The ROI Equation
When determining how much debt to assume, prospective students frequently grapple with the prestige of a private institution versus the affordability of a state school. Recent data suggests that, purely from a financial return on investment (ROI) perspective, public universities are increasingly outperforming their private counterparts for the average student.
Georgetown University's Center on Education and the Workforce (CEW) evaluates the ROI of over 4,600 colleges by comparing the net cost of attendance against post-graduation earnings over multiple decades 303132. Their 2025 analysis reveals a nuanced timeline: in the short term (10 years post-enrollment), institutions that primarily offer associate's degrees or sub-baccalaureate certificates often yield a higher ROI than bachelor's degree-granting institutions, because these programs cost less and allow students to enter the workforce faster 33. In fact, 125 for-profit colleges ranked in the top 10% for 10-year ROI, primarily driven by short-term technical certificates 34.
However, over a 40-year horizon, the lifetime earnings of bachelor's degree holders inevitably surpass those with certificates 31. Specifically, public bachelor's degree-granting institutions boast a median 40-year ROI of nearly $1.8 million, significantly outpacing the returns of public associate's and certificate programs 33.
While elite, highly selective private schools - like the Massachusetts Institute of Technology (MIT), Stanford University, and Princeton University - deliver unparalleled earning power and offer generous endowment-funded financial aid that drastically lowers the net cost for students, the vast majority of mid-tier private universities fail to justify their premium sticker prices 3546. The average student attending a private nonprofit university borrows $33,910 to complete a bachelor's degree, while those at proprietary for-profit institutions borrow an average of $40,970 6. In contrast, students utilizing federal loans at public institutions owe an average of $28,775 6.
When educational consultants compare public state universities against non-brand-name private colleges, graduates from state schools often secure better long-term financial outcomes. Their lower initial debt loads allow them to compound wealth, buy homes, and save for retirement much earlier in their careers 46. Unless an elite private university is offering substantial "gift aid" - money that does not need to be repaid, such as the $74,000 average gift aid at Williams College or the $71,000 at Caltech - borrowing heavily for the sake of a mid-tier private school nameplate is mathematically risky 36.
The AI Factor: Changing Entry-Level Economics
An emerging and highly disruptive variable in the student debt equation is the impact of Artificial Intelligence (AI) on the labor market. If the "first-year salary" rule of thumb relies on the assumption that a graduate will seamlessly secure a robust starting position, students must be aware that the pathway to that first job is rapidly narrowing in the AI era.
Extensive research covering 2024 to 2026 indicates a sharp contraction in traditional entry-level opportunities across knowledge-work sectors. According to a Harvard University working paper analyzing 66 million workers across 280,000 U.S. firms, companies that actively integrated generative AI saw their entry-level hiring fall by roughly 80% per quarter starting in 2023 37. This is not primarily driven by layoffs, but by a severe reduction in new job postings. In the United Kingdom, tech graduate roles plummeted by 46% year-over-year, with further drops projected through 2026 22. A Stanford analysis corroborated this trend, finding that early-career workers (ages 22 - 25) in AI-exposed occupations experienced a 13% relative decline in employment compared to their older, more senior peers 3749.
Generative AI excels at the intellectually routine, codified tasks that historically served as the training ground for junior employees - such as debugging basic code, drafting standard legal documents, summarizing reports, and basic data entry 37. As firms automate these tasks, they are increasingly relying on their senior staff, leading to what economists term "seniority-biased technological change" 37. To fill the few remaining junior roles, employers are elevating their requirements, often demanding specialized technical AI certifications or several years of prior experience, effectively raising the barrier to entry for fresh graduates 2249.
However, this technological shift also presents an opportunity. PwC's 2025 Global AI Jobs Barometer indicates that workers who possess demonstrable AI skills command a massive 56% wage premium compared to peers in the same roles who lack those competencies 38. Industries heavily exposed to AI are seeing wages rise twice as fast as less exposed sectors 38. For AI specialists, bachelor's degree holders can expect starting salaries around $85,000, while master's graduates earn approximately $110,000 51.
For the average student borrower, this dual reality means the transition from graduation to full-time, salaried employment may take longer and require more intermediate upskilling. Relying on an immediate high starting salary to aggressively pay down a standard 10-year loan is a riskier bet in 2026 than it was a decade ago. Graduates must factor in the possibility of spending their first post-graduate years underemployed or in lower-paying transitional roles, making enrollment in an income-driven plan like the new RAP a vital safety net to avoid early default 12.
The Hidden Costs of Default and Delinquency
Understanding "how much is too much" requires understanding the consequences of failing to pay. The student loan default crisis is severe and carries punitive administrative penalties that bypass the standard legal system.
As of early 2026, an estimated 5.3 million borrowers are in default on their federal student loans, meaning they have missed payments for 270 days or more 39. Furthermore, roughly 21% of all borrowers have reported a recent delinquency, and 10% of federal student loan dollars are currently delinquent 3953. The true scope of the distress is likely higher, as millions of borrowers remain technically "current" only because their loans are parked in forbearance, deferment, or IDR plans with $0 required payments 39. A recent survey of over 12,000 students found that 71% of borrowers already regret taking on their loans 53.
When a federal student loan enters default, the government exercises extraordinary collection powers. Unlike credit card debt or medical bills, federal student loan default does not require a court judgment to initiate asset seizure 39. The government can administratively garnish up to 15% of your disposable wages, intercept and seize your state and federal tax refunds, and deduct funds from your Social Security benefits 3954. Default absolutely devastates a borrower's credit score, making it nearly impossible to secure an auto loan, qualify for a mortgage, or pass background checks for certain professional licenses and apartments 54.
Borrowers in default also immediately lose access to protective benefits like deferment, forbearance, and future federal financial aid, including Pell Grants 54. The psychological toll is equally heavy; research by Fidelity Investments found that 67% of borrowers feel overwhelmed by their personal finances, and 41% report losing sleep or feeling anxious about their debt on a weekly basis 40.
Common Student Debt Myths and Misconceptions
Navigating the emotional and financial complexities of student debt requires separating economic reality from cultural narratives. Here are the most pervasive myths updated for the 2026 landscape:
Myth: Student loans are always "good debt." Reality: Financial experts categorize debt as "good" only if the asset acquired appreciates in value and yields a return greater than the cost of the loan 5. While a college degree undoubtedly raises lifetime earning potential compared to a high school diploma, the value of the degree is highly variable 57. Borrowing $100,000 for a career path that caps at a $60,000 salary transforms an educational investment into toxic, wealth-destroying "bad debt" that suppresses your ability to consume, invest, or build equity 554.
Myth: Private student loans are the root of the crisis and are highly predatory. Reality: While private student loans lack the flexible repayment options and forgiveness programs inherent to federal loans, they make up a small fraction - less than 10% - of the $1.8 trillion student debt market 67. Private lenders utilize risk-based underwriting, routinely denying loans to students who are mathematically unlikely to repay them. Federal loans, conversely, are issued without regard to a student's creditworthiness or future ability to repay, which is a primary reason federal delinquency and default rates historically outpace private loan delinquencies by a wide margin 6.
Myth: If I can't pay, my loans will eventually be forgiven easily. Reality: Outside of Public Service Loan Forgiveness (PSLF) - which requires 10 years of stringent compliance working full-time in qualifying government or non-profit roles - student loan forgiveness is a decades-long grind. Under the 2026 RAP rules, private-sector workers will not see their remaining balances forgiven until they have made 360 qualifying monthly payments, equating to 30 years in the repayment system 1112.
Myth: Repayment only starts after graduation. Reality: While most loans offer a six-month grace period post-graduation, unsubsidized federal loans and private loans accrue interest while you are still enrolled in school. Making payments during your academic career or grace period prevents this interest from capitalizing and adding to your principal balance 54.
Bottom line
How much student loan debt is too much? The absolute limit should be your anticipated first-year salary, but ideally, you should strive to borrow significantly less to maintain a healthy debt-to-income ratio. If your career path necessitates graduate degrees for advancement (such as social work or education), or if you plan to live in a high-cost metropolitan area, taking on debt equal to your salary will severely limit your ability to save, buy a home, or absorb economic shocks. With the 2026 elimination of unlimited Grad PLUS loans, the contraction of entry-level hiring due to AI, and the implementation of strict new borrowing caps under the OBBBA, students must rigorously calculate the realistic return on investment of their college choice and major before signing a promissory note.