What the Latest 2026 Data Shows About Grocery Prices
Consider the everyday economic ritual of the weekly supermarket run. For the average American consumer in 2026, looking at the final receipt has become a stark exercise in macroeconomic reality. The tangible impact of the modern economy is perhaps best illustrated by the quintessential summer milestone: the Memorial Day cookout. A standard backyard barbecue for eight people - featuring staples like ground beef, chicken breast, buns, and condiments - now costs approximately 13 percent more than it did a year prior, completely divorcing household food expenses from headline inflation metrics 12. Ground beef alone surged to an average of $7.46 per pound, representing a 14.5 to 20 percent year-over-year increase depending on the specific retail channel 11. Steak prices climbed 16.1 percent, and hot dogs rose by nearly 11 percent, creating a scenario where the meat portion of a holiday gathering consumes a disproportionate share of a family's discretionary food budget 21.
This localized sticker shock is not an isolated phenomenon, nor is it a temporary aberration. It is the downstream result of a massive, multi-year macroeconomic realignment. Across the nation, households are increasingly frustrated by a persistent disconnect: how can official government reports repeatedly declare that inflation is cooling, while paychecks seemingly buy less at the grocery store every single week? The answer lies in a complex matrix of shifting global supply chains, severe weather patterns permanently altering commodity yields, consolidated retail market structures, and fierce debates over corporate profit margins. This report provides an exhaustive, evidence-based explainer of the 2026 food economy, analyzing the driving forces behind supermarket prices, dissecting regional disparities, and offering strategic, data-grounded takeaways for household budgeting.
What Is the Difference Between Disinflation and Deflation in the 2026 Economy?
The single greatest source of consumer confusion and economic anxiety in 2026 centers on a fundamental macroeconomic distinction: the difference between disinflation and deflation. Understanding this difference is critical to deciphering why household budgets remain under severe pressure.
When official reports from the Federal Reserve or the Bureau of Labor Statistics (BLS) indicate that inflation is "cooling," "easing," or "falling," consumers intuitively expect prices at the grocery store to reverse course and return to their pre-pandemic levels of 2019 or 2020. However, a falling inflation rate signifies disinflation - a reduction in the rate at which prices are increasing. It does not mean deflation, which would require an actual decrease in the absolute price level of goods and services across the economy.
As of the April 2026 Consumer Price Index (CPI) released by the BLS, the all-items inflation rate stood at 3.8 percent over the preceding twelve months, while overall food inflation was measured at an annualized rate of 3.2 percent 25. Core inflation, which strips out the volatile food and energy sectors, hovered at 2.8 percent 5. For context, this 3.2 percent food inflation rate is a sharp, welcome deceleration from the blistering 11.4 percent peak experienced in August 2022, which was the highest rate recorded since May 1979 5.
Yet, this disinflationary trend offers little comfort to the household budget because the 3.2 percent increase compounds on top of the massive, structural price hikes absorbed over the preceding four years. The arithmetic of this economic squeeze reveals a sobering baseline. Between 2019 and 2025, U.S. households required approximately $15,400 more per year just to maintain the exact same standard of living, driven largely by a cumulative 25 percent increase in grocery costs and a 16 percent rise in gasoline 6. Prices are not falling; the economic bathtub is simply filling up at a slower rate than before, leaving the water level permanently elevated 7.
The macroeconomic indicators surrounding this disinflationary period present a highly fractured picture. The U.S. Bureau of Economic Analysis (BEA) reported that first-quarter 2026 real gross domestic product (GDP) grew at an annualized rate of 1.6 percent, driven by exports, investment, and consumer spending 39. Concurrently, corporate profits from current production expanded by $40.4 billion in the first quarter, reaching a seasonally adjusted annual rate of $4.39 trillion 3. Despite a resilient macroeconomy and robust corporate profitability, the financial health of the everyday consumer is deteriorating. Real disposable personal income dipped by 0.5 percent, and the personal saving rate fell to 2.6 percent - its lowest level since before the pandemic 4. Americans are spending more nominal dollars to acquire fewer physical goods, cementing a high-cost baseline that is forcing a structural shift in consumer behavior.
The Federal Reserve Bank of New York categorizes this phenomenon as a stark "K-shaped" economy. While households on the upper arm of the "K" have leveraged surging home equity and booming stock market valuations to absorb the compounding cost of food, those on the bottom half are collapsing under the strain 5. With the expiration of pandemic-era federal safety nets like expanded Supplemental Nutrition Assistance Program (SNAP) benefits, the percentage of households reporting "severe food scarcity" more than doubled from 4.0 percent in June 2020 to a staggering 10.0 percent in 2026 5. Furthermore, the share of respondents forced to drain their personal savings accounts to cover basic daily living expenses skyrocketed from 21.8 percent to 36.8 percent over the same period 5. Desperate to bridge the affordability gap, lower-income consumers are increasingly utilizing Buy Now, Pay Later (BNPL) services. The Richmond Federal Reserve estimates that BNPL transaction volume has grown roughly 20 percent per year since 2021, reaching $70 billion, evolving from a tool for discretionary retail shopping into a high-risk debt product used to finance weekly groceries and utility bills 4.
How Do Price Changes Contrast Across Different Supermarket Aisles?
The overarching 3.2 percent food inflation rate serves as a macroeconomic average, but it entirely obscures the violent, highly divergent crosscurrents occurring beneath the surface. Contrasting inflation rates across different supermarket aisles reveals that consumers are experiencing widely different budgetary impacts depending on their specific dietary habits.
The U.S. Department of Agriculture's (USDA) Economic Research Service (ERS) May 2026 Food Price Outlook projects that prices for nine out of the fifteen major grocery categories tracked will grow significantly faster than their 20-year historical averages this year 6. Food-at-home prices are expected to rise 3.2 percent overall, easily eclipsing the two-decade historical average pace of 2.6 percent 6.
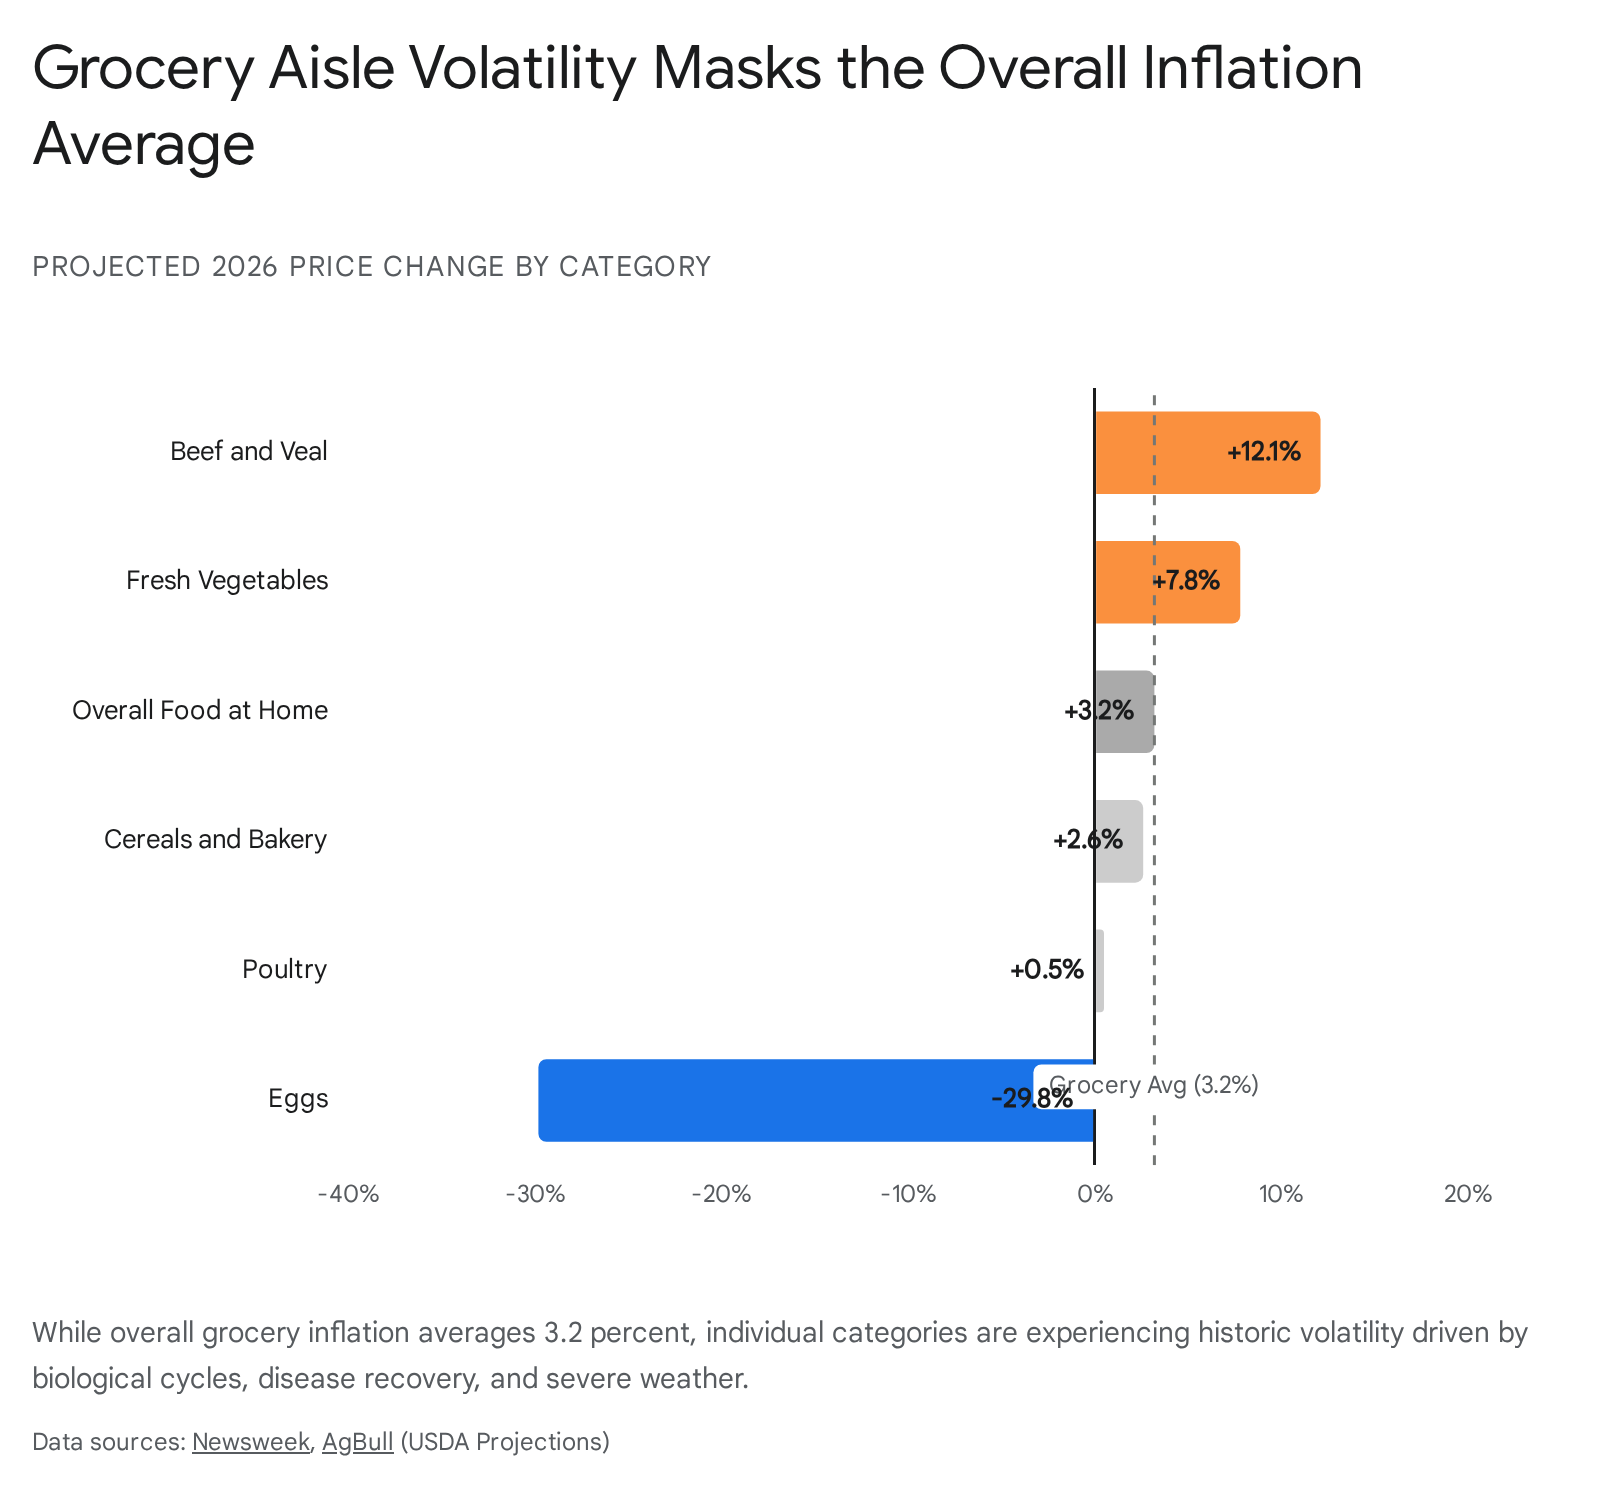

The most staggering divergence within the modern supermarket is found in the meat department. The USDA sharply raised its 2026 outlook for beef and veal, forecasting a massive 12.1 percent annual price surge 13. If realized, this trajectory will match the commodity surge seen in 2014 and mark the largest annual increase in beef prices since 1979, when prices jumped 27.4 percent 13. This surge is not a product of sudden, unmanageable consumer demand, but rather a delayed biological shock manifesting at the retail level. Severe, multi-year droughts have destroyed pasture conditions across the American West and Midwest, exponentially increasing the overhead costs of maintaining herds 715. Forced to liquidate because they could no longer afford feed or water, ranchers reduced U.S. cattle inventories to their lowest levels in over seven decades 15. Because it takes several years to breed, raise, and process a cattle herd, the heavily restricted supply has now collided with resilient consumer demand, cementing high prices that heavily weight the government's broader food inflation index 13.
Conversely, the egg market provides a textbook example of biological supply chain recovery. In 2025, retail egg prices skyrocketed by 21.4 percent due to devastating, widespread outbreaks of Highly Pathogenic Avian Influenza (HPAI), which decimated laying flocks nationwide and forced mass culling 13. In 2026, with fewer viral detections and rapid flock replacement protocols taking effect, the USDA projects egg prices will plummet by 29.8 percent 13. This anticipated drop represents the largest annual decline in USDA records dating back to 1974, providing immense relief to bakers and households reliant on affordable protein 13.
Fresh produce represents another highly volatile sector, heavily exposed to climate anomalies, water scarcity, and seasonal disruptions. The USDA forecasts fresh vegetable prices to rise 7.8 percent in 2026 overall 7. However, looking deeper into specific crops reveals wild swings. Retail prices for fresh tomatoes skyrocketed by 39.7 percent year-over-year in April 2026, driven by a combination of unprecedented early-season warmth that prompted crops to blossom prematurely, leaving them highly exposed to subsequent, destructive frosts 1616. By contrast, the retail price for fresh potatoes actually fell by 3.0 percent over the exact same timeframe, demonstrating how highly localized weather events impact distinct agricultural sectors differently 16.
To comprehensively grasp the volatility across the supermarket, the following table details the USDA Economic Research Service's 2026 price projections against the 20-year historical average for major grocery categories:
| Food Category | 2026 Projected Price Change | 20-Year Historical Average (2005-2024) | Status vs. Historical Trend |
|---|---|---|---|
| Beef and Veal | +12.1% | +3.5% | Significantly Higher |
| Fresh Vegetables | +7.8% | +2.1% | Significantly Higher |
| Nonalcoholic Beverages | +4.7% | +2.0% | Significantly Higher |
| Overall Food-at-Home | +3.2% | +2.6% | Higher |
| Cereals & Bakery | +2.6% | +2.8% | Slightly Lower |
| Pork | +1.5% | +2.2% | Lower |
| Poultry | +0.5% | +1.8% | Lower |
| Dairy Products | -1.6% | +1.5% | Deflationary |
| Eggs | -29.8% | +3.0% | Historic Deflation |
Data Source: USDA Economic Research Service, May 2026 Food Price Outlook 613717.
This categorized breakdown illustrates why household budgets feel perpetually strained. While dairy, pork, and poultry are showing remarkable price restraint - and eggs are crashing - consumers are acutely aware of the massive premiums placed on high-frequency purchases like beef, fresh vegetables, and nonalcoholic beverages.
Are Sticky Grocery Prices Driven by Supply Chain Costs or Corporate Greed?
As consumers absorb these relentless cost pressures, a fierce ideological and economic debate has emerged regarding the underlying cause of "sticky" prices - prices that rise rapidly during crises but fail to fall when macroeconomic conditions normalize. Economists, federal regulators, and industry analysts are sharply divided between two primary drivers: the compounding friction of supply chain costs versus the opportunistic expansion of corporate profit margins, colloquially termed "greedflation."
The Corporate Profit Perspective: Margin Preservation and The FTC
The Federal Trade Commission (FTC) has adopted a highly aggressive posture toward grocery consolidation and opaque pricing tactics. A landmark FTC report released in early 2024, the ramifications of which continue to dominate 2026 policy and antitrust discussions, suggests that major grocery conglomerates used pandemic-era inflation and temporary supply chain disruptions as a smokescreen to permanently elevate their profit margins at the expense of the consumer 78.
The agency's deep dive into corporate ledgers found that grocery retailer revenues exceeded total costs by 6 percent in 2021, and this margin actually climbed higher to 7 percent in the first nine months of 2023 78. The FTC explicitly noted in its findings that "some firms seem to have used rising costs as an opportunity to further hike prices to increase their profits, and profits remain elevated even as supply chain pressures have eased" 78. To obscure these inflated baselines, the commission accused retail giants of aggressively utilizing "shrinkflation" - the practice of subtly reducing the physical volume or weight of a product's packaging while maintaining or raising the retail price 78.
This regulatory scrutiny extends beyond the physical supermarket into the digital ecosystem. The FTC has actively targeted third-party food and grocery delivery apps for engaging in highly deceptive "drip pricing" and junk fee practices. Investigations revealed that platforms frequently mark up standard grocery items by 10 to 25 percent above the physical store price before systematically applying multiple, stacked service and delivery fees right before checkout 910. Consumer advocacy groups found that delivery apps often charge 48 to 52 percent to use the platform on top of the base cost of food and taxes, imposing a disproportionate burden on low-income households, rural communities, and the disabled who rely on delivery logistics 9.
Adding empirical weight to the FTC's argument, Federal Reserve analyses of the 2026 corporate landscape point to businesses prioritizing margin preservation above all else. The Federal Reserve's Beige Book, which gathers anecdotal information on current economic conditions, notes that while some input cost pressures remain, manufacturers and retailers are determined to protect their profit ratios 111213. Firms are reportedly utilizing highly automated data systems and artificial intelligence to run complex projection scenarios, optimizing their pricing structures to the absolute mathematical limit of consumer tolerance before demand destruction occurs 11.
The Supply Chain Perspective: Geopolitics and Input Shocks
Conversely, food and beverage manufacturers argue that the "greedflation" narrative is deeply flawed and ignores the reality that the agricultural sector is surviving an unprecedented era of geopolitical, regulatory, and climatic instability. The industry points to undeniable, structural macroeconomic factors that are permanently inflating the cost of production and distribution.
First, the volatile cost of fertilizer remains a critical, unavoidable pressure point. The FTC recently launched a major industrywide antitrust probe into fertilizer manufacturers after USDA data revealed that fertilizer represented the single largest input cost increase for American farmers since 2020 14. Global disruptions - particularly trade flow interruptions stemming from conflicts involving Iran in the Strait of Hormuz, a maritime chokepoint through which approximately one-third of the world's fertilizer supply travels - have caused crop nutrients to surge 11415. By late spring 2026, prices for urea had risen 27 percent year-over-year, while anhydrous ammonia skyrocketed by 44 percent, leaving 70 percent of U.S. farmers struggling to afford the nitrogen required for optimal crop yields 1415.
Second, trade policy and protectionism are imposing a massive, hidden tax on the food system. Under a sweeping new tariff regime implemented in early 2026, the effective tariff rate on imported goods jumped from 2.1 percent to an estimated 11.7 percent 16. Tariffs on essential packaging materials like steel and aluminum have directly increased the production costs of canned goods and processed foods, with highly exposed categories posting average price increases of 1.7 to 2.8 percent year-over-year based purely on packaging costs 1627. Furthermore, retaliatory tariffs and indirect costs from compliance paperwork moving through integrated North American supply chains have severely pressured food and beverage manufacturers, compressing their margins before the product ever reaches the retail shelf 28.
Third, global weather patterns and the resulting energy demand are permanently altering yield economics. Meteorologists are tracking an unusually strong "super El Niño" forming in 2026 that threatens to cause widespread, persistent droughts into 2027 in nations exporting staple commodities like rice, cocoa, and coffee 16. With cocoa futures recently exhibiting wild volatility and global sugar supplies fluctuating, the cost of raw, imported ingredients remains a persistent headwind 28. Concurrently, energy costs have spiked; the BLS reported a 17.9 percent annual increase in the energy index through April 2026, driven largely by a 32.0 percent surge in gasoline 17. Because perishable items like fresh produce and meat demand heavily refrigerated transport, these diesel and electricity costs are immediately passed through the supply chain, inflating the final retail price 15.
When rigorously evaluating these competing views, the data suggests a synthesis rather than a binary conclusion. Extreme, compounding supply shocks - ranging from fertilizer shortages to avian influenza and energy spikes - undeniably initiated the inflationary wave, legitimately raising the baseline cost of production 131417. However, highly consolidated corporate power within the retail sector allowed grocery chains to pass those costs on rapidly to consumers, capturing excess margin in the chaos, which they are now deeply reluctant to surrender even as specific commodity inputs begin to stabilize 81318.
How Are Regional and Global Dimensions Reshaping the Food Landscape?
Food inflation is not a monolithic national experience; it is unevenly distributed across borders, states, and even neighborhoods. In 2026, a household's vulnerability to grocery price hikes is heavily dictated by their geographic location and the systemic economic inequality inherent in their specific zip code.
The BLS regional Consumer Price Index data from April 2026 illustrates significant geographic disparities, largely driven by how localized energy markets and housing costs interact with food distribution networks. The Northeast region currently leads the nation in inflationary pain, with an overall inflation rate of 4.4 percent and food-at-home inflation soaring to 4.2 percent year-over-year 1920.
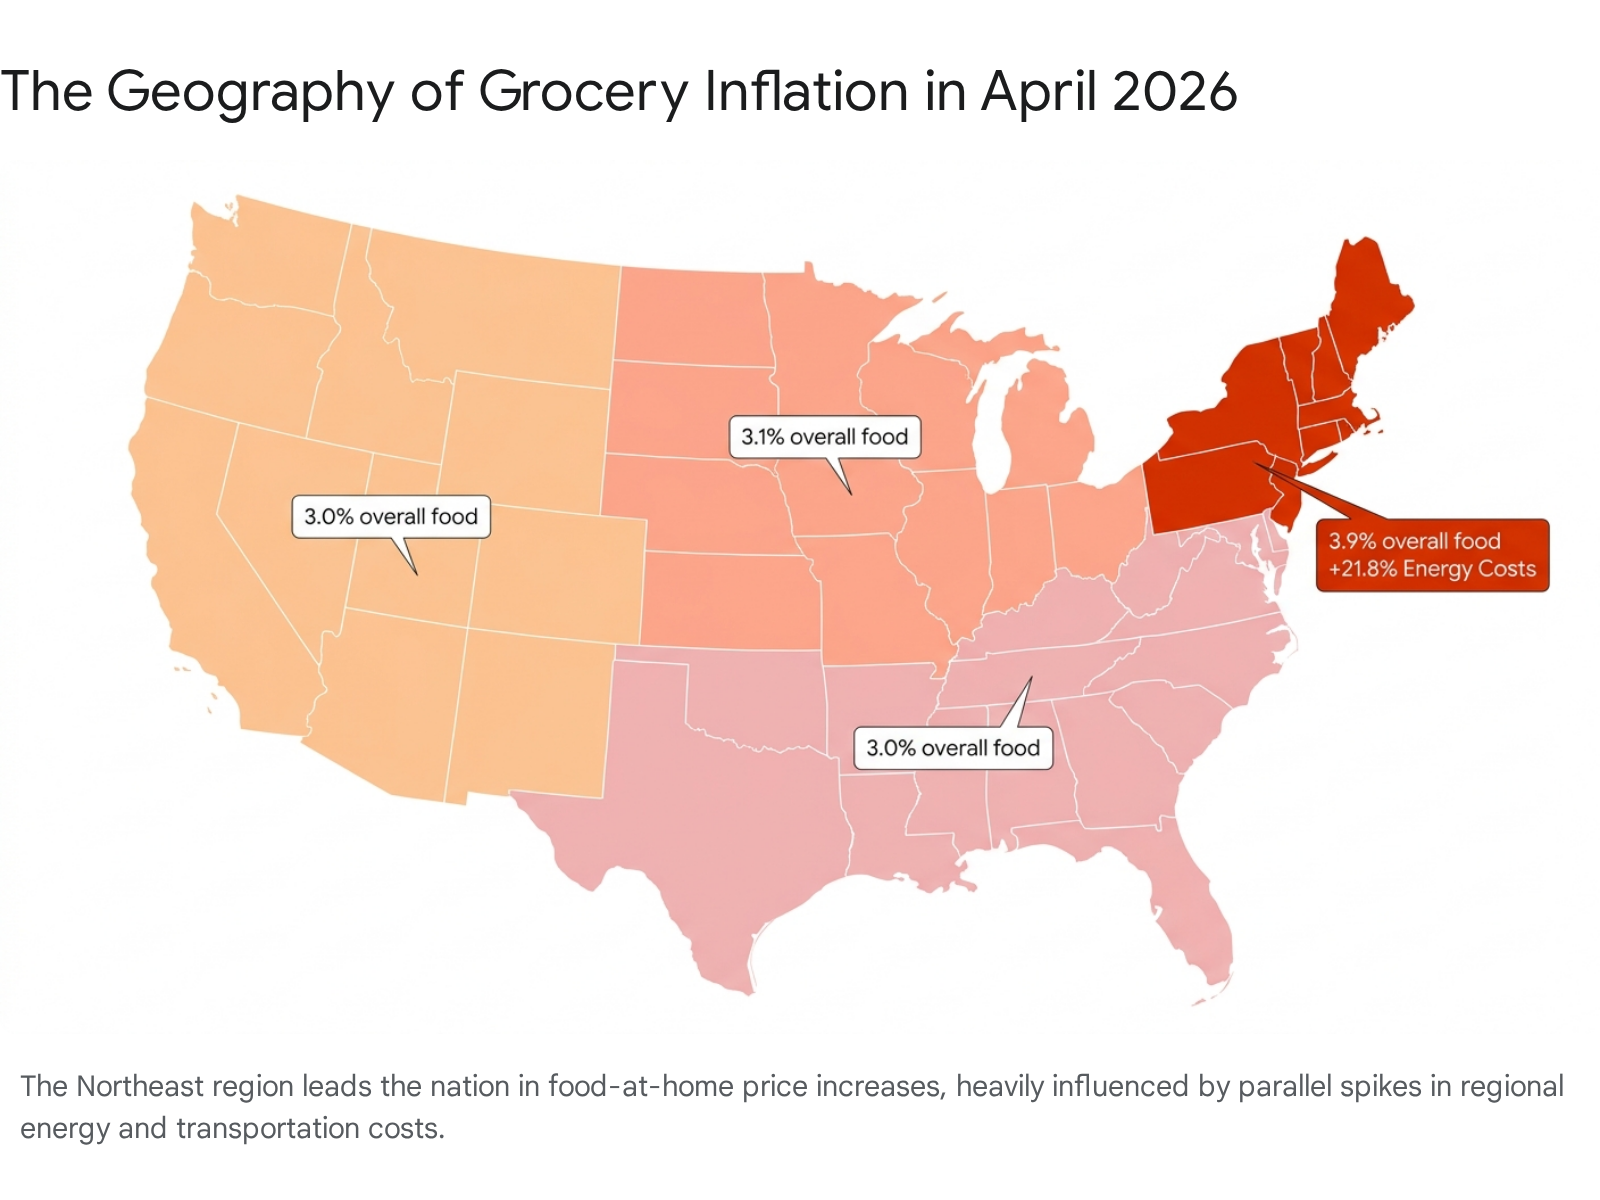

This regional spike is heavily influenced by surrounding utility costs; the Northeast saw its energy index rocket by 21.8 percent, with electricity rising 12.1 percent and natural gas advancing 10.9 percent 1920. Because the Northeast is densely populated and highly reliant on imported agricultural goods trucked in from the Midwest and West Coast, these surging transportation and cold-storage energy costs are baked directly into the region's grocery prices.
By contrast, other regions experienced a more moderate inflation environment. The Midwest, West, and South regions all recorded an overall food inflation rate of approximately 3.0 to 3.1 percent 172122.
The following table breaks down the April 2026 regional CPI data to highlight these geographic disparities:
| U.S. Region / Major MSA | All-Items CPI (Annual) | Overall Food CPI (Annual) | Food-at-Home CPI (Annual) | Energy CPI (Annual) |
|---|---|---|---|---|
| Northeast Region | +4.4% | +3.9% | +4.2% | +21.8% |
| West Region | +3.5% | +3.0% | +2.6% | +16.6% |
| Midwest Region | +4.1% | +3.1% | +2.7% | +15.7% |
| South Region | +3.6% | +3.0% | +2.5% | +17.9% |
| San Francisco-Oakland | +3.8% | +5.4% | +6.7% | +13.6% |
| New York-Newark | +4.6% | +4.9% | +5.9% | +24.0% |
| Chicago-Naperville | +3.1% | +3.5% | +2.2% | +14.2% |
| Los Angeles-Long Beach | +3.7% | +3.3% | +4.3% | +14.7% |
Data Source: Bureau of Labor Statistics, Regional CPI Reports, April 2026 1719212223242526.
Beyond broad macro-regional differences, researchers at the Federal Reserve have uncovered a deeply troubling trend of geographic inequality at the hyper-local neighborhood level. A 2026 Policy Hub paper titled "Geographic Inequality in Food Inflation" revealed that poorer Metropolitan Statistical Areas (MSAs) experienced annualized food inflation half a percentage point higher than richer MSAs, amounting to a massive cumulative 8.8 percentage point penalty over the studied timeframe 18. The primary culprit identified by the researchers is retail market concentration. Lower-income areas systematically suffer from a lack of grocery competition. When one dominant regional chain controls a localized food market, they possess the pricing power to pass wholesale cost increases directly to consumers with impunity, whereas retailers in highly competitive, affluent MSAs are forced to absorb some costs to maintain their market share 18.
On a global scale, the U.S. agricultural sector remains highly vulnerable to international dynamics. Economic research indicates that major commodities rely heavily on reciprocal trade with Mexico, Canada, and China. A disruption resembling "China shock 2.0" - where sudden surges in exports or retaliatory tariffs alter global production patterns - can rapidly cascade into reduced farm sector revenues domestically and higher final food prices for the American consumer 27. The combination of strict domestic market concentration and unpredictable global trade flows ensures that the spatial inequality of food inflation will persist.
What Does the Latest Data Show for Household Budgets and Consumer Behavior?
Years of sustained economic volatility, compounding price hikes, and stagnant real wages have fundamentally rewired the psychology and logistics of the American shopper. Industry analysts observing the 2026 landscape have coined a new term for this demographic: the "insulated consumer" 41. Americans are no longer operating in a state of acute panic or "crisis mode"; instead, they have accepted the permanence of high prices and have permanently adapted their shopping routines to defend against further margin erosion 41.
The most prominent, structural shift in consumer behavior is the massive acceleration and mainstream acceptance of private-label (store brand) products. Historically viewed as inferior compromises for cash-strapped households, private-label goods have undergone a renaissance in quality and packaging. They have now captured a staggering $330 billion in sales and currently account for roughly 24 percent of total unit share in the grocery sector 42.
The data indicates a fatal erosion of brand loyalty for legacy consumer packaged goods (CPG) companies. Approximately 62 percent of shoppers now explicitly state that price matters more than a brand name, and 88 percent plan to maintain or actively increase their private-label purchases moving forward 4128. Trust in private-label quality is exceptionally high, sitting at 61 percent for food and 60 percent for home goods 4128. In high-loyalty categories like food and beverages, nearly two-thirds of shoppers now demand a massive discount of 25 percent or more to even trial a new name-brand product 28.
Shopping logistics have also evolved to maximize efficiency. Instead of the traditional, massive weekly supermarket haul centered on a single big-box store, low- and middle-income consumers have shifted toward fragmented, "buy as you go" behavior 42. Making frequent, smaller trips to multiple stores - including value-focused retailers and discounters like Aldi, Dollar General, and Walmart - allows households to meticulously manage their cash flow week-to-week and drastically reduce expensive food waste 4228. Pre-trip list-making has fallen from 75 percent in 2023 to 68 percent in 2026, as shoppers increasingly enter stores with a flexible mindset, ready to pivot their meal plans based entirely on which items are heavily discounted that day 4128.
Finally, the pharmaceutical landscape is quietly but profoundly influencing the physical grocery basket. The rapid adoption of GLP-1 injectable weight-loss medications among U.S. adults - with usage highest among Millennials and surging among Gen Z - has altered fundamental caloric demand 27. Retail data intelligence shows that these shoppers are purchasing significantly lower volumes of food overall, but they are demanding higher performance from each calorie. Categories tied to high-sugar indulgence are seeing softer demand as GLP-1 users report reduced cravings, while budgets are being aggressively redirected toward premium, nutrient-dense products like liquid meal replacements (up more than 10 percent) and high-protein meat snacks (up more than 25 percent) 27.
What Are the Practical Budgeting Takeaways for 2026 Households?
With food and energy costs establishing a permanently higher baseline, traditional budgeting advice that relies on static allocations or outdated percentages is failing modern households. Financial experts emphasize transitioning away from rigid spreadsheets and adopting a "Reality Budget" that treats groceries not as a fixed cost, but as a highly variable expense that requires active, strategic, and tactical management 6.
Establish an Accurate Benchmark
To budget effectively, households must first understand institutional baselines to determine if their spending is erratic or aligned with the national average. The USDA rigorously calculates Official Food Plans ranging from 'Thrifty' to 'Liberal' to track the cost of feeding a family. Financial professionals widely cite the USDA's Moderate-Cost plan as the gold standard benchmark for a healthy, comfortable food budget that assumes all meals are prepared at home without the inclusion of expensive restaurant dining or takeout 44.
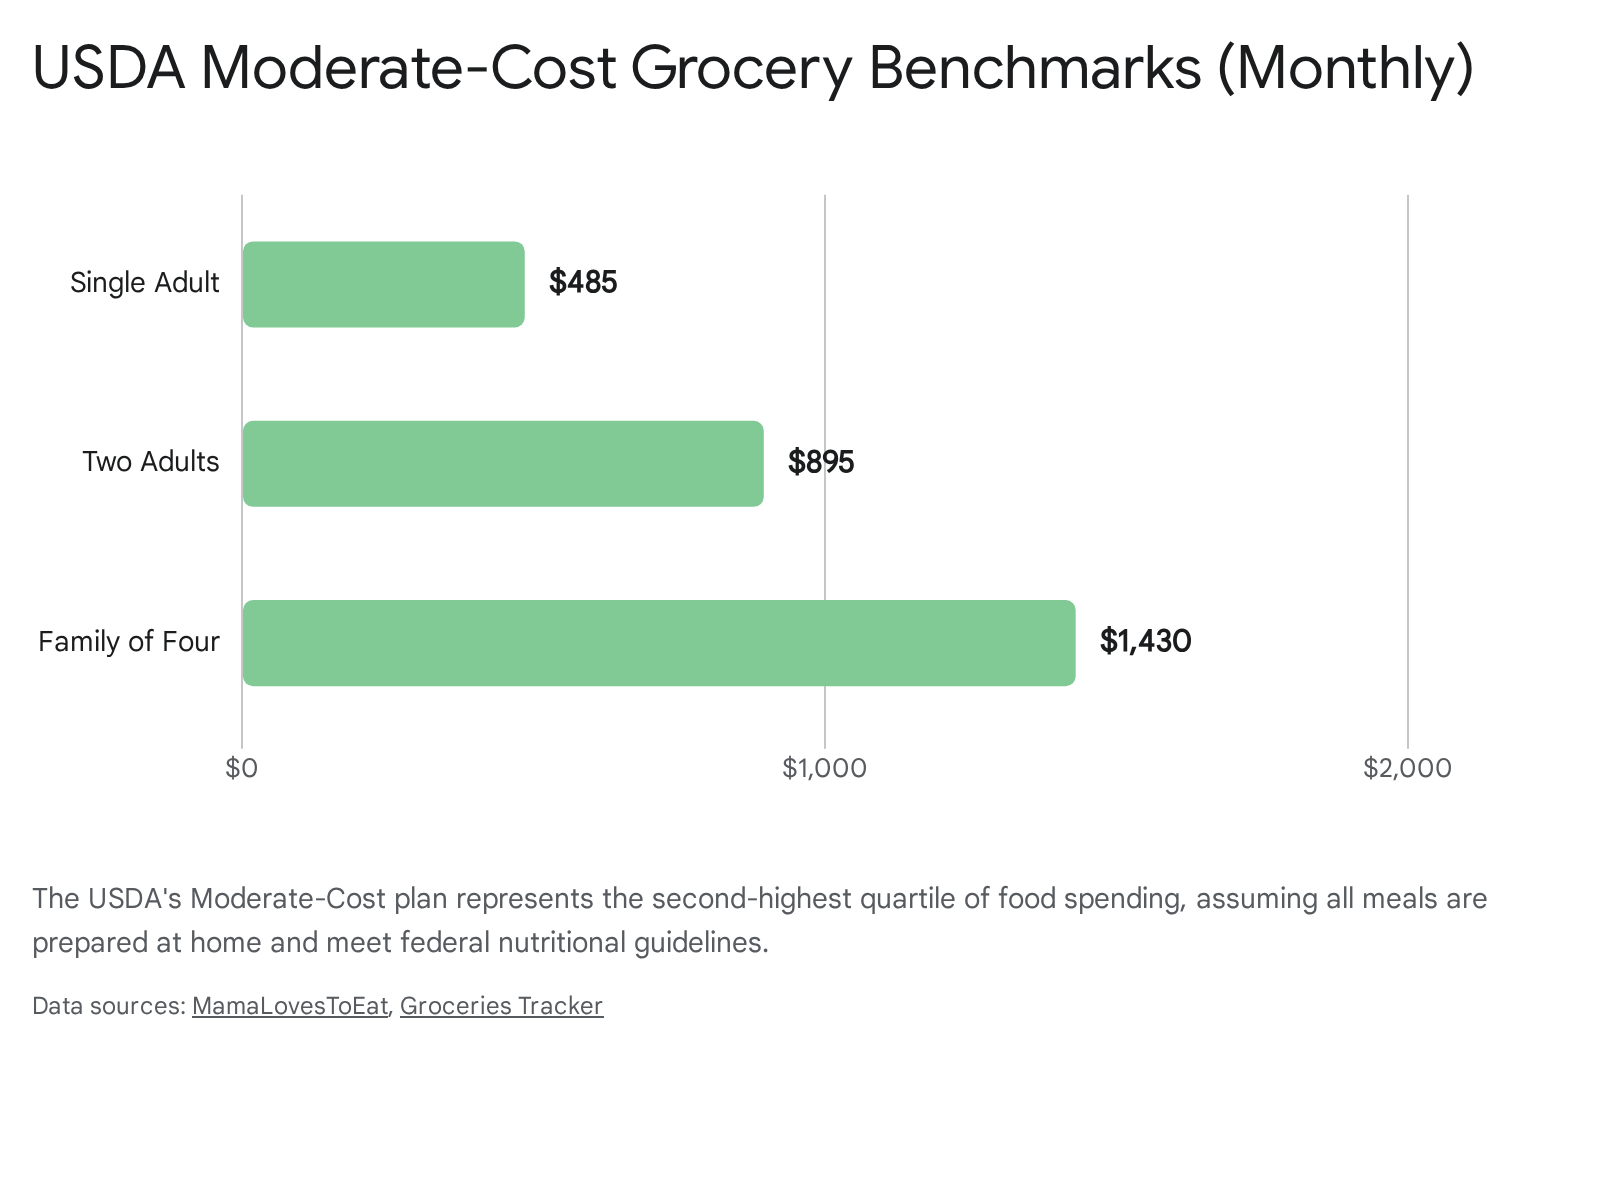

In 2026, the USDA Moderate-Cost plan dictates the following monthly averages, adjusted for current inflation trends:
| Household Composition | Monthly USDA Moderate-Cost Benchmark | Estimated Range (Based on Age/Gender) |
|---|---|---|
| Single Adult | $485 | $315 to $605 |
| Two Adults | $895 | $580 to $1,115 |
| Family of Four (Two Adults, Two Older Children) | $1,430 | $950 to $1,760 |
Data Source: USDA Official Food Plans, adjusted for 2025-2026 food-at-home inflation 4445.
If a household's grocery spending consistently eclipses these benchmarks without the inclusion of specialty dietary requirements, severe regional inflation penalties (such as living in Hawaii or the Northeast), or dining out, substantial inefficiencies exist within their purchasing habits 4445.
Execute Tactical Procurement Strategies
Combating 2026 prices requires viewing grocery shopping as a logistical operation rather than a weekly chore. The most effective strategies rely on flexibility, ingredient efficiency, and exploiting retailer algorithms.
The primary paradigm shift involves focusing on "cost per meal" rather than "cost per item." While a fast-food lunch might cost $12 and provide exactly one meal, a $12 investment in a whole chicken, bulk rice, and seasonal vegetables yields three to four meals 6. Shoppers must evaluate their cart based on nutritional density and meal yield. For example, purchasing a $2.29-per-pound pack of single-ingredient chicken thighs is vastly superior in both financial cost and nutritional health outcomes compared to spending $8 on a bag of heavily processed, frozen chicken nuggets 46.
Furthermore, value-driven consumers must abandon rigid meal lists that force them to buy specific ingredients at peak retail price. Supermarkets operate on strictly modeled six-to-eight-week sale cycles, periodically pricing staple items at or below cost - known as loss leaders - strictly to drive foot traffic into the store 47. By utilizing a "flex budget," consumers should dynamically plan their weekly meals around the proteins and produce featured on the front page of the local circular, aggressively stockpiling these deep-discounted items in chest freezers when the price hits the bottom of the cycle 647.
Finally, households must aggressively audit digital ecosystems. Retailers increasingly gatekeep their absolute best prices behind digital coupons and proprietary loyalty apps. Navigating these systems requires advance planning; many major chains demand digital coupons be loaded onto a profile well before the customer reaches checkout 47. Furthermore, when ordering online, consumers must remain highly vigilant against the FTC-documented "drip pricing" of delivery applications. The convenience of having groceries delivered can immediately obliterate an entire month of careful budgeting when hidden service fees, delivery charges, and 10 to 25 percent item markups are applied to the final digital cart 910.
Conclusion: Embracing the Permanence of the New Baseline
The 2026 grocery landscape is defined by its permanence. The collective consumer hope for a broad deflationary wave that would magically return food prices to pre-pandemic norms has proven mathematically and economically impossible. While the rate of overall inflation has cooled to a much more manageable 3.2 percent, the structural costs underlying the global food system - ranging from disrupted fertilizer routes and climate-induced crop failures to massive tariff increases and deeply entrenched corporate profit margins - have established a new, permanently elevated baseline 51313.
Consumers are navigating an environment of intense, exhausting contradictions. They face multi-decade price spikes in essential proteins like beef, while simultaneously benefiting from collapsing egg prices as biological supply chains recover 13. They are successfully shielding themselves from broader inflation by transitioning en masse to high-quality private-label goods, yet they remain highly vulnerable to the localized extortion of digital junk fees and geographically concentrated grocery monopolies that dominate poorer neighborhoods 101842.
Ultimately, surviving the modern supermarket aisle requires ruthless adaptation. Households that internalize the realities of the USDA benchmarks, abandon rigid brand loyalty in favor of flexible, loss-leader meal planning, and actively manage their purchasing logistics will successfully insulate themselves against the enduring squeeze of the modern food economy. The era of casual grocery shopping has ended; in 2026, filling the pantry is an exercise in applied economics.