What 2026 Recession Indicators Actually Show
In mid-2026, the global economy is teetering on the edge of a stagflationary downturn, driven by severe energy shocks and a fracturing consumer base, yet it continues to avoid an immediate recession thanks to robust manufacturing and a resilient "low-hire, low-fire" labor market. While key indicators like the U.S. Treasury yield curve have un-inverted and the services sector is stagnating, aggressive inventory stockpiling and potential geopolitical ceasefires offer a narrow path to a soft landing.
The Tale of Two Economies: Global Purchasing Managers' Indices
One of the most revealing indicators of future economic health is the Purchasing Managers' Index (PMI), a near-real-time snapshot of private-sector business conditions. A PMI reading above 50 indicates expansion, while a reading below 50 signals contraction. In May 2026, S&P Global's flash PMI data revealed a stark global divergence between the manufacturing and service sectors, portraying an economy that is simultaneously accelerating and stalling 12.
The headline S&P Global US PMI Composite Output Index held steady at 51.7 in May, indicating overall modest growth 2. However, the composite number masks a profound internal split that economists are calling a "tale of two economies" 1. This phenomenon is not isolated to the United States; similar fault lines are appearing across the Eurozone and the United Kingdom.
| Region | Composite PMI | Manufacturing PMI | Services PMI | Overall Economic Trajectory |
|---|---|---|---|---|
| United States | 51.7 | 55.3 | 50.9 | Divergent; manufacturing booming while services near stagnation. 2 |
| United Kingdom | 53.9 (Feb) | 51.7 (Feb) | N/A (Inflation elevated) | Solid early 2026 growth, though weighed down by rising unemployment. 34 |
| Eurozone | 51.7 (Comp) | 51.4 | 46.4 | Severe services contraction dragging down modest manufacturing gains. 5 |
The Manufacturing Resurgence and the "Safety Stock" Illusion
The U.S. Manufacturing PMI surged to 55.3 in May - its highest level in 48 months - driven by the fastest rate of output growth in over four years 2. On the surface, this expansion suggests robust industrial health. However, a deeper analysis of the underlying drivers reveals that this boom is largely a reactionary measure to external threats rather than a signal of unbridled economic optimism.
Manufacturers worldwide are aggressively building "safety stocks" in response to severe supply chain delays caused by the ongoing war in the Middle East and the closure of the Strait of Hormuz 16. As transportation costs rise and lead times lengthen to a degree not seen since August 2022, factories are pulling forward their orders to hoard inventory before prices climb higher 2. According to S&P Global Market Intelligence, the number of customers ordering more from factories specifically to build safety stocks has reached one of the highest levels seen over the past 15 years 6.
Additionally, massive capital investments in data centers and artificial intelligence infrastructure are providing a robust, non-cyclical tailwind for industrial producers 1. Yet, economists warn that the broader manufacturing boom is likely temporary. Once safety stocks are replenished, the artificial boost in orders will inevitably fade, potentially leaving the sector with excess inventory and constrained output later in the year, particularly if supply shortages continue to constrain actual production 26.
The Stagnation of Services
In sharp contrast to manufacturing, the U.S. Services PMI slipped to a two-month low of 50.9 in May, barely hovering above contraction territory 2. The service sector, which accounts for the vast majority of U.S. economic activity, is bearing the brunt of the geopolitical and inflationary fallout.
Rising energy prices - a direct result of Middle Eastern instability - are acting as a regressive tax on consumers, stifling demand for discretionary services 56. Service providers are facing the steepest cost increases recorded in a year and are shedding jobs at the second-fastest pace since May 2020 due to deteriorating demand, squeezed profit margins, and elevated interest rates 2. Furthermore, U.S. service exports fell at the sharpest rate recorded in six years 2.
The Eurozone is experiencing an even more severe services slump. The Eurozone Services PMI plummeted to 46.4 in May, reflecting widespread contraction as the conflict-driven cost-of-living surge severely weighed on European demand 5. If the manufacturing sector's inventory cycle cools off before the services sector can recover its footing, the overall global economy could easily slip below the 50-point expansion threshold in the second half of 2026.
The Sahm Rule and the "Low-Hire, Low-Fire" Labor Market
Employment data is traditionally a lagging indicator, but the speed of its deterioration can signal the onset of a recession in real-time. In 2026, the U.S. labor market has settled into a delicate "low-hire, low-fire" equilibrium 7.
The U.S. unemployment rate remained steady at 4.3% in April 2026 8. Total nonfarm payroll employment edged up by just 115,000, with job growth highly concentrated in specific sectors like health care, transportation, and warehousing, while information and telecommunications sectors continued to shed jobs 8. Over the past six months, aggregate new job creation has been quite limited, with monthly payroll gains averaging just 55,000 9. However, the overall unemployment rate has been kept in check because companies are actively avoiding mass layoffs, as evidenced by stable initial jobless claims hovering around 208,000 9.
Reassessing the Sahm Rule Recession Indicator
The most prominent labor market gauge for economic contractions is the Sahm Rule, developed by former Federal Reserve economist Claudia Sahm. The rule states that a recession has likely begun when the three-month moving average of the national unemployment rate rises by 0.50 percentage points or more relative to its lowest point during the previous 12 months 11.
Historically, the Sahm rule has triggered during every recession since 1950, usually with immense accuracy and only one false positive in 1959 11. The indicator briefly flashed a warning in July 2024 when it crossed the 0.50% threshold (reaching 0.54%), leading to widespread recession fears 12. However, that trigger proved to be premature, and the economy continued to expand.
As of April 2026, the Real-time Sahm Rule Recession Indicator sits at just 0.13%, down from 0.20% the previous month and well below the long-term average of 0.42% 910.
| Date | Real-time Sahm Rule Value | Trend / Status |
|---|---|---|
| April 2026 | 0.13% | Safe zone; declining trend. 10 |
| March 2026 | 0.20% | Safe zone. 10 |
| July 2024 | 0.53% | Indicator triggered; widely considered a false positive or delayed reaction. 1210 |
| Long-Term Average | 0.42% | Historical baseline. 10 |
The lack of a recession following the 2024 trigger, and the currently low 2026 reading, can be attributed to a few structural shifts in the labor market: 1. Gradual Cooling vs. Sudden Shock: Instead of a sudden wave of layoffs that feeds a negative consumption loop, the labor market experienced a slow, controlled deterioration over 12 to 18 months. Employment growth slowed downshifted dramatically, but a sustained contraction in the absolute number of jobs never materialized 12. 2. Shifting Baselines and Demographics: The Sahm rule measures the change relative to a 12-month low. Because unemployment has hovered in the low-to-mid 4% range for over a year, the 12-month minimum has reset higher, meaning the current 4.3% rate does not constitute a rapid spike 811. Furthermore, an aging workforce means that retirements are creating openings that, when backfilled, do not show up as new payroll gains, effectively lowering the "breakeven" employment number required to keep unemployment stable 9.
Analysts calculate that the U.S. economy would need to shed roughly one million jobs by the end of 2026 for the unemployment rate to rise sufficiently to trigger the Sahm rule again 9. As long as firms choose to absorb higher input costs rather than execute mass layoffs, the U.S. labor market remains the primary bulwark against a technical recession.
International Labor Market Strains
While the U.S. labor market holds steady, the United Kingdom is showing signs of severe fracturing. UK unemployment rose to 5.2% in the fourth quarter of 2025, marking the highest level since 2015 and the fastest annual rise across the G7 4. Youth unemployment is particularly concerning, with the rate for 16-24 year-olds hitting 16%, and an alarming 34.7% for 16-17 year-olds, reflecting intense pressures at the entry level of the labor market as cautious hiring limits opportunities 4. Despite these rising unemployment figures, UK wage growth remained relatively robust at 4.1% (including bonuses) in early 2026, presenting a complex challenge for the Bank of England 11.
The Bond Market's Warning: The Yield Curve Un-Inverts
For decades, an inverted U.S. Treasury yield curve - where short-term interest rates are higher than long-term rates - has been one of the most reliable predictors of an impending recession 1213. The curve famously inverted in July 2022 and remained deeply negative for over two years, signaling intense market pessimism regarding long-term growth and inflation 13.
However, the bond market landscape shifted dramatically in 2026. As of late May, the yield curve is no longer inverted; it is upward-sloping (or "normal") across maturities 12.
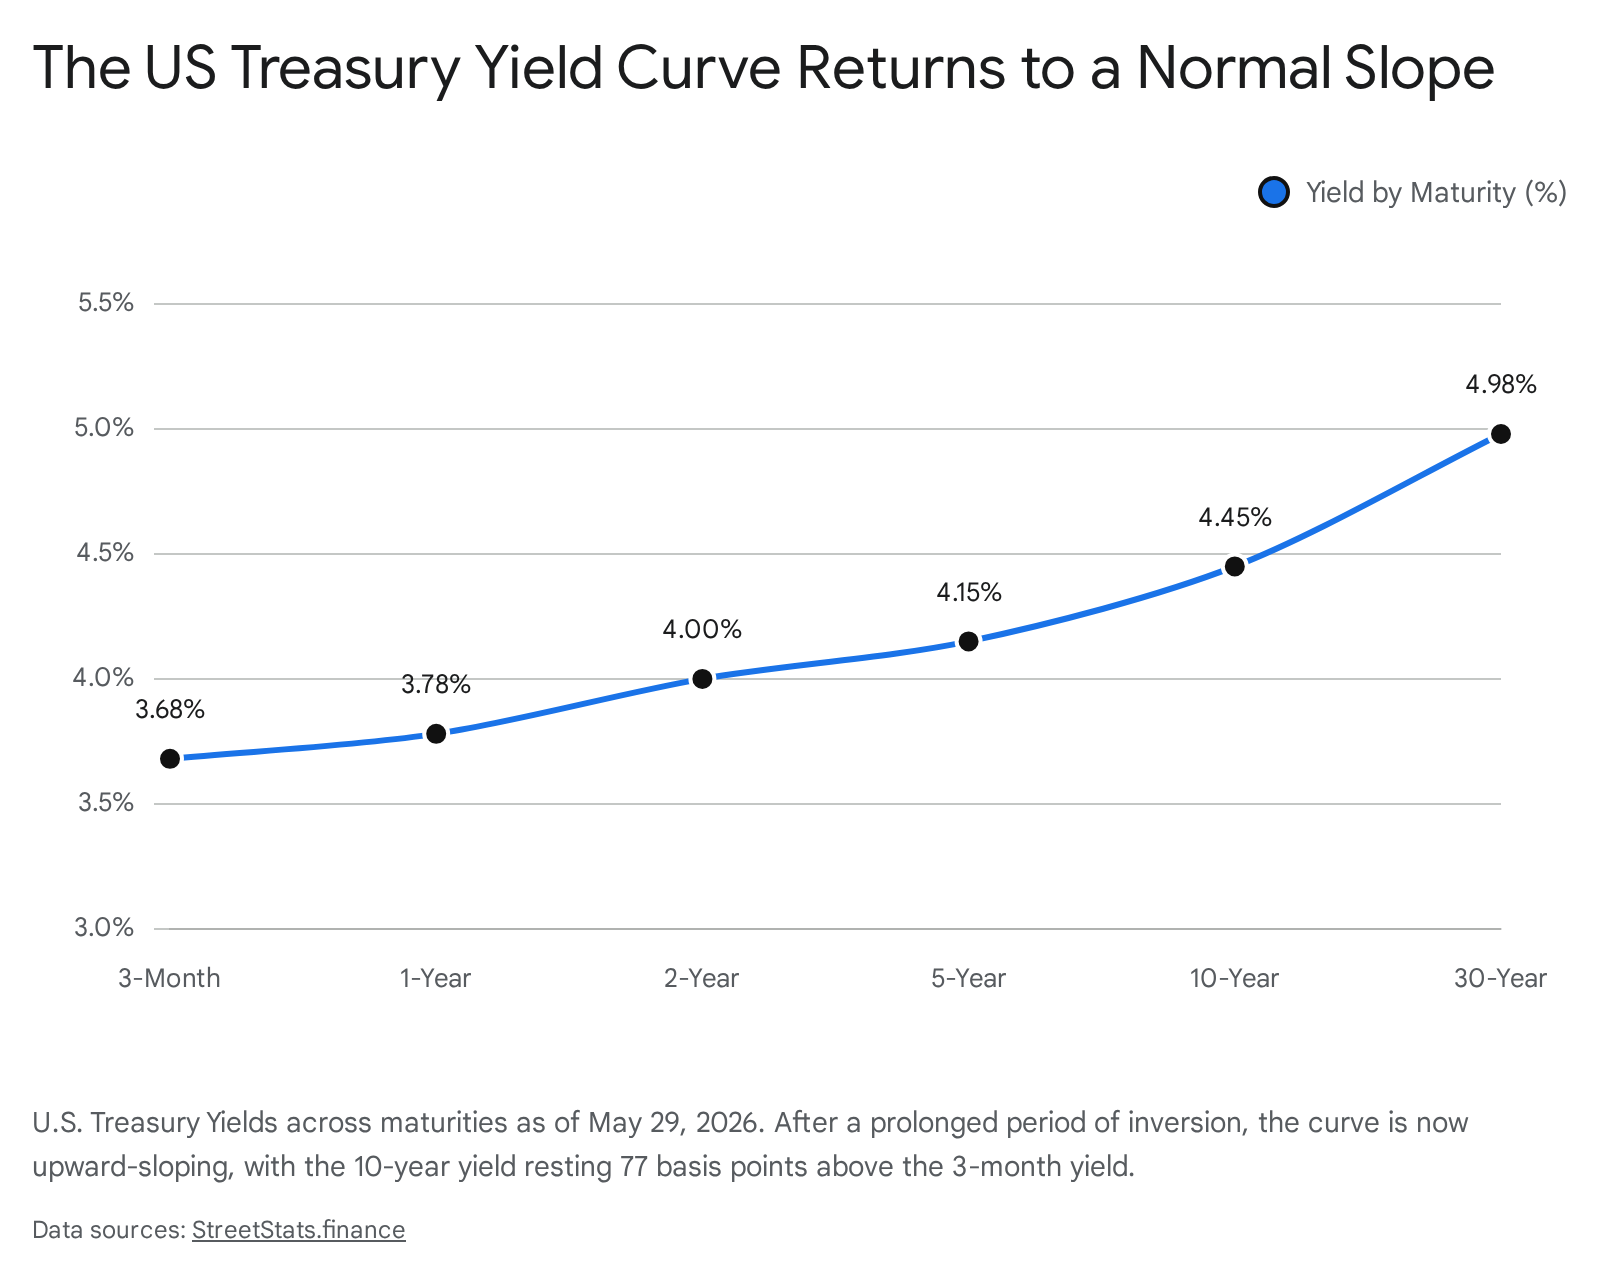
On May 29, 2026, the 3-Month Treasury bill yielded 3.68%, the 2-Year Treasury stood at 4.00%, the 10-Year Treasury reached 4.45%, and the 30-year bond hit 4.98% 12. The critical 10-year vs. 2-year spread is now solidly positive at +44 basis points, while the 10-year vs. 3-month spread is at +77 basis points 12.
The Danger of a "Bear Steepener"
At first glance, a normal yield curve seems like a healthy economic signal. It typically implies that investors expect future economic growth and are demanding higher returns to reflect the increased opportunity cost of tying up money for longer periods 12.
However, market historians and quantitative analysts note a darker nuance: economic contractions rarely begin while the yield curve is inverted. Rather, recessions typically begin shortly after the curve un-inverts 13. If we consider the last positive spread date before a recession as the starting point, the average lead time to an economic contraction is historically 18.5 weeks (about 4.25 months) 13.
Furthermore, the mechanics of how the curve un-inverted in 2026 are highly concerning. The curve did not steepen because the Federal Reserve aggressively slashed short-term rates to rescue a failing economy (a dynamic known as a "bull steepener"). Instead, it un-inverted because long-term rates rose significantly - a dynamic known as a "bear steepener."
At the start of the year, markets had confidently priced in multiple 25-basis-point interest rate cuts from the Federal Reserve, expecting inflation to cool 14. By May, those expectations were violently unwound. Surging oil prices, a re-acceleration in inflation, and a massive influx of ongoing Treasury issuance forced investors to demand higher long-term yields 1214. This repricing of risk has driven overall borrowing costs higher, flattening the curve initially before causing it to steepen upwards, which tightens financial conditions precisely when the broader economy is cooling 1419.
The Consumer Breaking Point
Consumer spending drives nearly 70% of U.S. economic activity, making household financial health the ultimate backstop against a recession 15. For the past few years, American consumers defied gravity, utilizing pandemic-era excess savings, robust wage gains, and credit to sustain spending even as interest rates climbed 721. In 2026, the data shows that resilience is cracking.
The cracks are visible across multiple personal finance metrics: * Depleted Savings: The U.S. personal savings rate plummeted to 2.6% in the spring of 2026, down from 3.6% in March and 5.5% a year prior. This represents a 22-year low for American households 915. * Declining Real Income: While nominal wages have grown, inflation has eroded purchasing power. After adjusting for inflation, real household after-tax income is down more than 1% year-over-year. According to PNC chief economist Gus Faucher, this is the type of drop "normally associated with recession" 15. * Rising Debt Stress and Hardship Withdrawals: Consumers are increasingly turning to creative and desperate measures to cover basic living expenses. Credit card delinquencies are surging, and the use of "Buy Now, Pay Later" (BNPL) services for essential items like groceries highlights extreme consumer strain 21. Fidelity reported that hardship withdrawals from 401(k) retirement accounts - typically used to prevent evictions or pay medical bills - rose to 2.5% of accounts in the first quarter of 2026, while outstanding 401(k) loans rose to 19.2% 15.
The Mortgage Market Gridlock
Adding to consumer stress is the heavily gridlocked housing market. Expectations that the Federal Reserve would lower interest rates and provide mortgage relief in 2026 have largely evaporated 1623.
By late May 2026, the average 30-year fixed mortgage rate had climbed back to 6.53%, driven higher by the surge in the 10-year Treasury bond yield and bond market volatility tied to geopolitical conflicts 132317. Because mortgage rates closely track long-term bond yields - which in turn are elevated due to persistent inflation and the delayed timeline for Fed rate cuts - borrowing costs remain punishingly high 2318.
| Forecasting Institution | Late 2026 Mortgage Rate Projection | Long-Term Outlook / Caveats |
|---|---|---|
| Mortgage Bankers Association (MBA) | 6.1% - 6.2% | Rates to ease only slightly; remain in the lower-6% range. 16 |
| Fannie Mae | ~5.7% | Expected to decline to the upper-5% range by year-end. 16 |
| Morgan Stanley | 5.50% - 5.75% | Potential dip by mid-year, but expected to rise again in late 2026/2027. 16 |
Note: Some experts caution that if the Middle East conflict is protracted, inflation could push mortgage-backed securities yields higher, potentially driving 30-year fixed rates into the 7% range 18.
This rate environment has severely damaged housing affordability, especially for first-time buyers whose down payment savings have lost purchasing power to inflation 1718. Furthermore, existing homeowners who locked in sub-4% rates years ago are refusing to sell, causing a severe inventory shortage that is keeping home prices artificially high even as demand cools 17.
This financial strain is fundamentally altering consumer psychology. Recent survey data from Credit One Bank indicates a shift in the "American Dream." Rather than prioritizing asset accumulation or visible wealth, 33% of U.S. consumers now define financial success simply as being debt-free . Among lower-income households (earning under $50,000), 22% state that merely establishing a $1,000 emergency fund is their primary financial goal . When consumers shift from a mindset of accumulation to one of debt reduction and basic survival, aggregate demand falls - a classic precursor to an economic contraction 2127.
Wall Street's Probability Models
Given the conflicting signals - a booming manufacturing sector fighting against rising debt, soaring energy prices, and geopolitical shocks - major financial institutions have continually updated their recession models in 2026.
The consensus view across Wall Street is that a soft landing is still the baseline scenario, but the margin for error has narrowed significantly. Both Goldman Sachs and J.P. Morgan have recently revised their models to reflect an increasingly fragile macroeconomic environment.
| Institution | 2026 Recession Probability | Key Drivers Cited in Analysis | Base Case Outlook |
|---|---|---|---|
| Goldman Sachs | 30% (Up from 20-25%) | Oil shocks from the Strait of Hormuz, fading fiscal stimulus, and labor market fatigue pushing growth toward "stall speed" (1.25% - 1.75%). 19 | 70% chance of avoiding recession, largely contingent on rate cuts in late 2026. 19 |
| J.P. Morgan | 35% - 40% | Pro-cyclical dynamics, sustained energy inflation, a K-shaped consumer environment, and simultaneous central bank hold policies. 27202122 | Modest economic resilience, supported by AI capital expenditures. 2021 |
| World Economic Forum | < 42% | 58% of chief economists disagree that a global recession will occur within a year, though 89% expect global growth to weaken. 23 | Avoidance of imminent global contraction, replaced by severe regional stagflation and high volatility. 23 |
The core takeaway from Wall Street analysts is that a recession in 2026 would likely not resemble the sudden financial collapse of 2008 or the pandemic shock of 2020. Instead, it would be a slow, grinding contraction caused by a sustained decline in aggregate demand as households finally max out their credit and businesses begin to protect margins through headcount reductions rather than price hikes 927.
The Global Economic Fracture: China, Europe, and Canada
The U.S. economy does not operate in a vacuum, and international indicators highlight pockets of deep economic distress alongside surprising resilience.
China's Two-Speed Economy
China, the world's second-largest economy, is navigating profound structural imbalances. The Chinese government adjusted its GDP growth target to roughly 4.5% to 5.0% for the year, and first-quarter data surprisingly hit the top end of that range at 5.0% 2425.
However, China's growth is entirely lopsided. Industrial profits surged by over 18% early in the year, driven by intense global demand for electronics and AI components, as well as higher margins for state-owned oil and gas firms benefiting from the energy shock 3526. Conversely, domestic consumption is sputtering; retail sales grew by a meager 1.7% in March, reflecting persistent household caution, a bleak domestic job market, and an ongoing, multi-year property sector crisis that has destroyed household wealth 2425.
The Chinese bond market reflects this lack of domestic confidence. The yield on China's 10-year government bond rests at an incredibly low 1.715% as of late May, and the spread between the 10-year and 2-year bonds sits at roughly 49.5 basis points 353738. This prolonged flight to safety in Chinese government bonds underscores deep institutional concerns about deflationary risks and chronically weak domestic demand within the country 35.
Europe Faces Stagflation Risks
The Eurozone is bearing the brunt of the global geopolitical energy shock. Unlike the U.S., which has vast domestic energy production, Europe is highly exposed to the disruptions in the Middle East 27.
The European Central Bank (ECB) has issued explicit warnings regarding financial stability, noting in its May 2026 Financial Stability Review that the geoeconomic shock is pushing the region away from its baseline growth scenarios and exposing sovereign vulnerabilities 26402842. The Eurozone composite PMI fell deep into contraction territory in May, dragged down by a services sector reading of 46.4 as the cost-of-living crisis destroyed demand 5. While the ECB was initially expected to cut rates, some officials are now advocating for a hold, fearing that resilient corporate pricing power combined with an energy supply shock will cement inflation well above their 2% target 4243.
Canada Enters a Technical Recession
In North America, Canada's economy has already tripped the wire of a "technical recession." Following an annualized drop of 1.0% in real GDP in the fourth quarter of 2025, the Canadian economy flatlined in the first quarter of 2026, officially registering a 0.1% annualized decline 4429.
This means Canada has posted negative or flat real GDP growth for three of the last four quarters 4429. The stagnation is heavily driven by a pullback in business and government capital investment, as well as a nearly 10% drop in resale housing activity during the quarter 29. However, Canadian economists are hesitant to officially declare a broad recession, noting that the country's massive oil, gas, and mining sectors are experiencing a strong rebound due to higher global commodity prices, which may pull the economy back into positive territory by mid-year 4429.
The Geopolitical Wildcard: The Strait of Hormuz
It is impossible to accurately forecast recession odds in 2026 without acknowledging the outsized role of the ongoing war in the Middle East. The closure of the Strait of Hormuz - a maritime chokepoint that normally handles 20% of the world's crude oil and a massive share of liquefied natural gas - has acted as a massive inflationary tax on the global economy 3031.
The closure has disrupted shipping, spiked insurance premiums, and caused fertilizer shortages that threaten global food supplies 233031. By late May 2026, reports emerged that U.S. and Iranian negotiators were circulating a draft peace agreement, characterized as a memorandum of understanding, that would include a 60-day truce and the reopening of the Strait of Hormuz within 30 days 273048. In exchange, the U.S. would lift naval blockades and grant Iran access to $12 billion in frozen assets 27.
If ratified, this deal would release millions of barrels of oil back onto the global market, rapidly collapsing energy prices and easing the inflationary pressure that is currently paralyzing central banks and crushing the service sector 2748. Financial markets have already begun to price in this optimism, with Brent crude futures dipping in late May 27.
However, if the fragile peace talks collapse and the conflict drags on - or expands due to unresolved disagreements over nuclear capabilities - the economic damage will compound 32. Continued supply chain disruptions and persistently high fuel costs will force businesses to pass costs onto consumers, likely prompting the Federal Reserve to keep interest rates elevated and ultimately eroding the remaining pillars of the global economy 61831.
Bottom line
The global economy in 2026 is suspended in a fragile equilibrium. Robust manufacturing activity, corporate AI investments, and a steady labor market are currently preventing a formal global recession, but the un-inverted yield curve and a severely weakened consumer base point to significant danger ahead. Whether the economy achieves a soft landing or slides into a stagflationary recession ultimately hinges on two unresolved variables: the Federal Reserve's timeline for easing borrowing costs, and the immediate reopening of global energy supply chains in the Middle East.