How the CPI Basket Is Built and Weighted
The Consumer Price Index (CPI) basket is a highly engineered economic metric that measures inflation by tracking the changing costs of a fixed set of goods and services weighted by actual household spending. Rather than a simple tally of store prices, it relies on complex statistical adjustments - such as estimating theoretical rents for homeowners and using regression models to account for technological improvements - to capture the true cost of living. Understanding how this basket is built reveals why official inflation figures often diverge from individual consumer experiences and international benchmarks.
The Anatomy of the Consumer Basket
When financial markets react to the news that "inflation rose," they are typically responding to a specific, highly structured metric: the Consumer Price Index for All Urban Consumers (CPI-U). In the United States, this index is designed to represent the buying habits of over 90% of the population 12. It serves as the primary gauge of macroeconomic price stability and consumer purchasing power.
To construct this index, the Bureau of Labor Statistics (BLS) classifies consumer spending into more than 200 distinct categories, which are subsequently aggregated into eight major umbrella groups 2. Every month, data collectors (known as economic assistants) gather approximately 94,000 individual price quotes for goods and services, alongside roughly 8,000 rental housing quotes across various geographic areas 2.
However, all prices are not treated equally. Because the average household spends vastly more on putting a roof over their heads than on buying new clothes, the categories are weighted according to their "relative importance" within a typical household budget 2. If rent prices experience a sudden spike, it sends a measurable shockwave through the overall inflation index. If the price of men's suits rises by the exact same percentage, the overall index barely registers a tremor.
The table below outlines the eight major expenditure groups within the U.S. CPI-U, alongside their relative importance weights as determined for the 2024 and 2025 tracking periods.
| CPI-U Major Category | Relative Importance Weight (Dec 2024/2025) | Examples of Included Items |
|---|---|---|
| Housing | 44.469% | Rent, owners' equivalent rent, utilities, bedroom furniture |
| Transportation | 16.316% | New/used vehicles, gasoline, airline fares, car insurance |
| Food and beverages | 14.539% | Groceries (food at home), restaurant meals, alcohol |
| Medical care | 8.423% | Prescription drugs, medical supplies, physician services |
| Education and communication | 5.846% | College tuition, postage, telephone and internet services |
| Recreation | 5.137% | Televisions, pets and pet products, sports equipment, admissions |
| Other goods and services | 2.902% | Tobacco, haircuts, personal care products, funeral expenses |
| Apparel | 2.368% | Men's, women's, and children's clothing, footwear, jewelry |
Source: U.S. Bureau of Labor Statistics, Relative Importance of Components in the Consumer Price Indexes 23. Note: Weights are adjusted over time to reflect shifting consumption data.
The Evolution of the Basket: Additions and Removals
A fixed-basket price index can only accurately reflect the cost of living if the items inside the basket mirror what people are actually buying 4. If an index tracks the price of horse-drawn carriages in an era of automobiles, or rotary phones in the age of smartphones, it ceases to be a useful economic indicator. To combat this obsolescence, statistical agencies routinely evict outdated items and induct new ones to maintain representation.
Tracking Cultural and Technological Shifts
The United Kingdom's Office for National Statistics (ONS) provides a highly transparent view of this annual housekeeping. The UK's "shopping basket" contains roughly 750 representative items, which are reviewed every year to prevent statistical biases from developing 56.
In 2024, the ONS added 16 items and removed 15 5. The additions painted a clear picture of shifting post-pandemic habits, wellness trends, and cultural revivals. Air fryers were added to the basket after expenditure on the appliances jumped by over 30% between 2021 and 2022, driven by their energy-saving features and health benefits 577. Edible sunflower seeds, rice cakes, and gluten-free bread were also added to reflect the growing supermarket shelf space devoted to health-conscious dietary choices 57. Furthermore, after a 32-year absence, vinyl records returned to the inflation basket. Driven by surging physical media sales from artists like Taylor Swift and the Rolling Stones, the resurgence of vinyl highlighted how cultural revivals directly alter national spending patterns 77.
Conversely, items that saw a sudden drop in demand were purged. Hand hygiene gel, a staple of the acute COVID-19 pandemic phase, was removed alongside hot rotisserie-cooked chickens and sofa beds 579.
The evolution continued in 2025, with the ONS adding 23 new items and removing 15 6. Recognizing the rapid adoption of immersive technology, the ONS added virtual reality (VR) headsets to the basket, noting that UK consumer expenditure on VR hardware had reached approximately £350 million in 2024 6. Exercise mats and men's sliders were also added, while oven-ready joints and in-store cafeteria meals were dropped 6.
Expenditure Shifts in North America
Similar dynamics are tracked by Statistics Canada (StatCan), which updates its CPI basket weights to capture the changing expenditure patterns of Canadian households. In 2024, Canada noted an increased basket share for shelter (rising to 29.12%) and transportation (rising to 17.29%), offset by decreases in clothing, footwear, and recreation 4. Interestingly, the household operations component saw a decline in its overall weight primarily due to falling prices for cellular phone plans, though this was moderated by Canadians placing an increased importance on internet access services, which rose from 0.99% of the basket to 1.33% 4.
The Mechanics of Substitution Bias and Weighting
Deciding what is in the basket is only half the battle; the other half is determining how much of each item consumers purchase. The mathematical formulas used to combine these disparate prices into a single index number are critical to the accuracy of inflation measurement.
Most headline inflation metrics, including the U.S. CPI-U, use variations of a Laspeyres-type or Lowe formula 489. These formulas aggregate prices by applying fixed quantities based on a specific reference period. However, human behavior is highly dynamic. When the price of premium beef skyrockets, consumers do not stubbornly continue buying the exact same quantity of beef; they naturally substitute it with cheaper alternatives like chicken or pork 8.
If an inflation index maintains static weights despite this behavioral shift, it mathematically overestimates the actual cost of living - a statistical flaw known as "upper-level substitution bias" 1013.
The Shift to Annual Weight Updates
Historically, the BLS updated its spending weights only once every ten years, relying on long-term data from the Consumer Expenditure Survey 813. In 2002, recognizing that a decade was too long to wait in a rapidly changing economy, the BLS began updating spending weights every two years 13.
However, the massive and sudden shifts in consumer behavior caused by the COVID-19 pandemic proved that even a biennial update was insufficient. During the pandemic, consumers radically altered their spending, buying fewer airline tickets and restaurant meals, and purchasing more groceries and home furnishings. Because the weight adjustments occurred on a two-year cycle, the CPI initially missed these rapid changes 14. For example, when gasoline prices spiked in mid-2022, actual U.S. consumption of gasoline fell by 4.5% year-over-year. If the CPI maintained its older, higher weight for gasoline, it would exaggerate the financial pain consumers were actively mitigating by driving less 14.
To solve this, the BLS modernized its methodology. Effective with the January 2023 data, the BLS began updating the CPI spending weights annually, utilizing a single calendar year of expenditure data 1013. By updating weights yearly rather than biennially, the BLS reduced the lag between when consumers change their habits and when the CPI reflects those changes from 36 months down to 24 months (e.g., the 2024 index uses 2022 expenditure data) 910.
BLS retrospective research indicates that if annual updates had been utilized between 2002 and 2020, the annual inflation rate would have been measured 0.031 to 0.036 percentage points lower per year. This demonstrates that more frequent re-weighting successfully strips out a measurable portion of substitution bias, ultimately providing a more accurate reflection of the true cost of living 1013.
The Quality Conundrum: Hedonic Adjustments
One of the most complex, and frequently misunderstood, elements of inflation tracking is accounting for "quality change."
Imagine tracking the price of a television. A consumer buys a new television for $500. Five years later, they buy a replacement television, which also costs $500. On paper, the price has not changed; inflation is zero. However, the newer television is significantly larger, features 4K resolution, and includes built-in smart streaming capabilities. Because the consumer is receiving vastly more utility and technological capability for the exact same amount of money, the effective price of the technology has actually dropped 11.
If statistical agencies simply tracked raw price tags, they would falsely register price stagnation or inflation in sectors that are actually experiencing rapid deflation due to innovation. To measure this accurately, statisticians use "hedonic quality adjustment."
Decomposing Utility Through Regression
Deriving from the Greek root for pleasure or satisfaction, hedonics is an economic technique that decomposes a product into its constituent characteristics to estimate the specific marginal value of each feature 1112.
The BLS uses multivariate regression analysis to assign a dollar value to individual attributes 12. For example, when a new, higher-resolution television replaces an older model in the CPI sample, the hedonic model estimates the financial value of the extra screen size and the improved resolution 11. It then subtracts those estimated values from the new retail price, isolating the "pure" price change driven by macroeconomic inflation rather than product improvement 1117.
The BLS routinely applies hedonic models to high-tech goods, consumer appliances (like microwaves and refrigerators), and even seasonal apparel where fabric quality or features change rapidly 1112.
Do Hedonics Manipulate the Numbers Downward?
A persistent critique among skeptical market watchers is that statistical agencies aggressively use hedonic adjustments to artificially suppress official inflation numbers. Empirical data suggests this is a misconception.
A comprehensive 21-year review of quality adjustments in the U.S. CPI found that while the public assumes quality adjustments always lower the index, the actual macroeconomic impact is highly nuanced and quite small 13. BLS research notes that if the agency omitted the item replacement and quality adjustment process entirely, the overall index would actually be substantially lower 13. This is because unadjusted indexes would fail to capture the hidden price jumps that occur when manufacturers discontinue old product lines and force consumers to buy newly introduced, more expensive models 13.
Furthermore, as the economy digitizes, economists are transitioning from manual data collection to Artificial Intelligence (AI) and Machine Learning (ML) to scale hedonic models. Recent peer-reviewed research applying deep learning to Amazon transaction data demonstrated that AI can automatically extract product features from images and unstructured text 19. The resulting hedonic models predicted price variances with 80% to 90% accuracy, proving that automated quality adjustment can scale effectively across massive datasets without relying on slow, human-based feature extraction 19.
The Great Housing Debate: Renters vs. Owners
Housing makes up the largest single chunk of the U.S. CPI, accounting for over 44% of the CPI-U basket 23. Because it commands such massive weight, how statistical agencies measure housing costs is the subject of fierce methodological debate, ultimately leading to significant discrepancies between international inflation metrics.
The core challenge is that a house serves a dual economic purpose: it is simultaneously a place to live (consumption) and a financial asset (investment) 14. Because the CPI is designed strictly to measure the cost of consumption, the BLS does not track actual home purchase prices or mortgage payments 14. Instead, it uses a concept called Owners' Equivalent Rent (OER) 14.
OER asks a theoretical question: If a homeowner had to rent their own house in the current market, what would they pay? 14. The BLS relies on large-scale surveys of actual rental units to estimate this figure 14.
However, this methodology introduces a significant time lag. Because standard residential leases last for twelve months, and landlords rarely raise rents on existing tenants immediately to match daily market peaks, OER moves much slower than real-time real estate data 14. In 2022, as real-time market indices like the Zillow Observed Rent Index and the CoreLogic Single Family Rent Index soared, the CPI's shelter metric rose only moderately. In 2024, as those same market rents cooled, the CPI's rent metric remained stubbornly elevated as it slowly caught up to past realities 14. To better track the bleeding edge of the market, the BLS and researchers have begun exploring a "New Tenant Rent Index" that isolates only the price changes for newly signed leases 14.
The Transatlantic Inflation Illusion
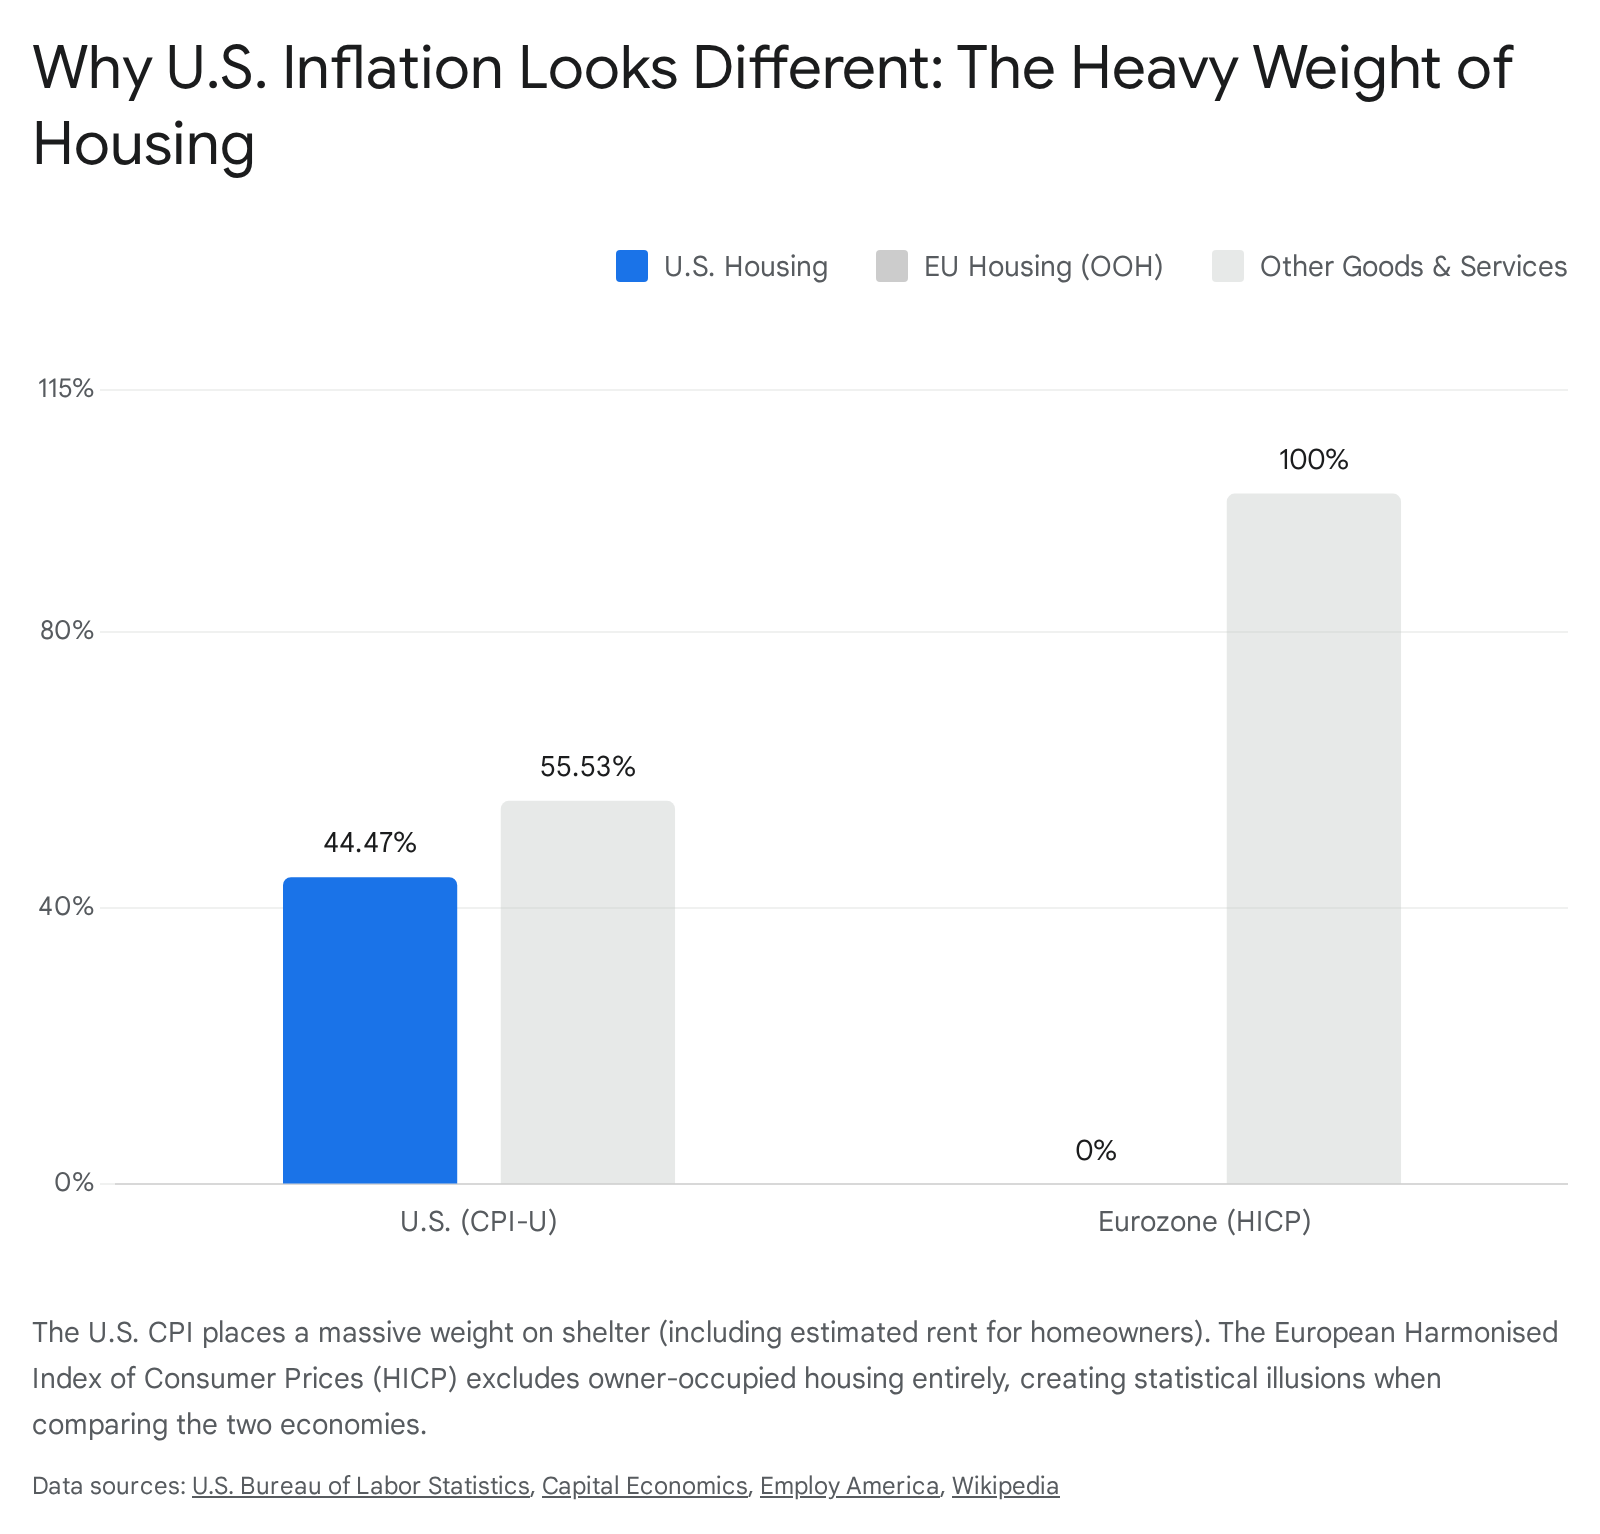
If you compare "core inflation" (inflation excluding volatile food and energy prices) in the United States versus Europe during a housing boom, the U.S. will almost always appear to be running significantly hotter 15. But this is largely an optical illusion caused by fundamentally different housing methodologies.
The European Central Bank uses the Harmonised Index of Consumer Prices (HICP) to measure inflation across the Eurozone. Unlike the U.S. CPI, the HICP entirely excludes owner-occupied housing from its calculations 1516. European statisticians historically argued that purchasing a home is a form of capital formation (an investment), not consumption, and thus has no place in an inflation index 16. While there is ongoing debate within the European Parliament and the ECB about eventually incorporating an owner-occupied housing index, the current HICP remains structurally blind to the costs of homeownership 16.
Because the U.S. places a heavy weight on OER and Europe completely ignores it, a global spike in housing costs will cause U.S. core inflation to surge while European core inflation barely flinches. When economists adjust the U.S. CPI to strip out owner-occupied housing - putting it on an apples-to-apples basis with the European HICP - the transatlantic inflation gap effectively vanishes 1523.
The UK's Three-Tiered Approach
The United Kingdom manages this complexity by publishing three distinct inflation measures, each treating housing differently: 1. CPI: Similar to the European HICP, this measure excludes housing costs like rents and council tax, making it less comprehensive for domestic tracking but useful for international comparisons 1718. 2. CPIH: The ONS's preferred leading measure of inflation. It mirrors the CPI but includes owner-occupiers' housing costs (OOH) calculated via rental equivalence, making it conceptually similar to the U.S. CPI-U 171826. 3. RPI (Retail Prices Index): An older, legacy metric established in 1947. Unlike the CPI and CPIH, the RPI directly includes actual mortgage interest payments and house price depreciation 17. It also calculates aggregates using an arithmetic mean (the Carli formula) rather than the geometric mean (Jevons formula) used by the CPI. Because geometric means account for consumer substitution and arithmetic means do not, the RPI almost always runs higher than the CPI or CPIH 17. Despite losing its status as the official national statistic, the RPI is still heavily used for wage negotiations, train fare hikes, and indexing government bonds 17.
Sub-Populations: Does One Index Fit All?
The headline CPI-U represents an "average" urban household. But macroeconomic averages can obscure microeconomic realities. A wealthy homeowner in the suburbs who commutes by train experiences a fundamentally different personal inflation rate than a low-income renter in the city who drives an older, gas-guzzling car 261920. To address this, statisticians compute distinct sub-population indexes.
The True Living Cost (TLC) Critique
Labor advocates and economic critics often argue that the standard CPI does not accurately capture the inflation felt by middle- and low-income families. The proposed True Living Cost (TLC) index highlights several structural blind spots in the CPI-U.
First, the CPI assumes most Americans own their homes (weighting OER heavily at roughly 32% of the total index, and actual cash rent lightly at roughly 7-8%) 2021. However, among the bottom 60% of U.S. earners, only about half were homeowners in 2020 20. Therefore, critics argue the CPI underweights the devastating impact of soaring cash rents on the working class 20. Second, the CPI's medical care category tracks total payments to healthcare providers, essentially ignoring health insurance premiums, which constitute the vast majority of out-of-pocket medical spending for average households 20.
The CPI-W and Social Security COLAs
The most financially consequential sub-index in the United States is the Consumer Price Index for Urban Wage Earners and Clerical Workers (CPI-W). It represents a subset of the population (about 32%) who derive more than half their household income from clerical or wage occupations 122.
By federal statute, the CPI-W dictates the annual Cost-of-Living Adjustment (COLA) for tens of millions of Social Security and Supplemental Security Income (SSI) beneficiaries 2324.
The mathematics behind the COLA are rigid. The Social Security Administration averages the CPI-W for the third quarter (July, August, and September) of the current year, and compares it to the Q3 average of the last year a COLA was paid 2324. If the index rises, benefits rise; if it falls or remains at zero, benefits stay flat - by law, nominal benefits cannot go down 2324.
For example, the COLA computation for December 2025 (payable in January 2026) was calculated precisely as follows:
* The average CPI-W for Q3 2024 (the base year) was 308.729 23.
* The average CPI-W for Q3 2025 was 317.265 23.
* Calculation: (317.265 - 308.729) / 308.729 x 100 = 2.76%.
* Rounded to the nearest tenth of a percent, the final COLA is 2.8% 232526.
While mathematically precise, retirees argue that the CPI-W is the wrong tool for the job.
The Case for the CPI-E (Elderly)
Retirees have long pointed out that their cost of living rises faster than that of younger, urban wage earners. In 1987, Congress directed the BLS to create an experimental index to track this disparity: the CPI-E (Consumer Price Index for Americans 62 Years of Age and Older) 127.
A look at the relative weights explains the divergence. Seniors spend a significantly higher proportion of their fixed incomes on medical care and housing, and less on transportation, apparel, and education 2829.
| Expenditure Category | CPI-W Weight (Urban Wage Earners) | CPI-E Weight (Elderly 62+) |
|---|---|---|
| Medical Care | 6.946% | 11.296% |
| Housing | Lower relative proportion | Higher relative proportion |
| Education & Communication | 5.534% | 3.652% |
| Apparel | 2.751% | 1.863% |
Source: The Senior Citizens League analysis of BLS data 29. Note: Specific snapshot weights vary by year, but the structural disparity remains constant.
Because healthcare costs historically outpace broader economic inflation, the CPI-E often runs higher than the CPI-W. From 1982 to 2014, the average annual increase for the CPI-E was 2.9%, compared to 2.7% for the CPI-W 38. While a two-tenths of a percent difference sounds negligible in a single year, the compounding effect over a 20-year retirement results in a roughly 5% shortfall in real purchasing power for seniors whose benefits are strictly pegged to the CPI-W 24.
Despite lobbying efforts from senior advocacy groups to switch the Social Security COLA calculation to the CPI-E, the BLS continues to classify it as "experimental." This is primarily because its underlying survey sample size is only about one-third the size of the CPI-U, making it subject to higher statistical sampling error 38.
Global Perspectives and Engel's Law
How a country weights its CPI basket reveals deep truths about its economic maturity and the living standards of its citizens. A guiding principle in development economics is Engel's Law, which dictates that as a family's (or a nation's) income rises, the proportion of total expenditures devoted to food falls 1939.
We see this theory playing out globally. In highly developed economies like the United States and the United Kingdom, food and non-alcoholic beverages generally account for only 10% to 15% of the CPI basket 319. But in developing and emerging economies, food is the dominant driver of the cost of living, consuming a massive share of household income.
India's Massive 2024 Rebase
A prime example of Engel's Law in action is India's recent, sweeping overhaul of its inflation metrics. In early 2026, India's Ministry of Statistics and Programme Implementation (MoSPI) rolled out a revised CPI series, establishing 2024 as its new base year to replace antiquated consumption data from 2011 - 12 393031.
Over the previous decade, India experienced rapid economic growth, urbanization, and digitalization. Consequently, household spending patterns shifted dramatically away from basic sustenance and toward services and housing. Recognizing this, the new Indian CPI basket drastically reduced the relative weight of food and beverages from 45.86% down to 36.75% 393031. Simultaneously, India increased the weight of housing from 10.07% to 17.66%, and expanded its basket to track modern necessities like online media streaming services and CNG/PNG fuels 393233.
This shift is highly consequential for the Reserve Bank of India (RBI). The RBI operates under a Flexible Inflation Targeting mandate, aiming for 4% headline inflation with a tolerance band of 2% to 6% 3930. Because agricultural food prices are notoriously volatile - driven by unpredictable weather shocks, monsoons, and supply-chain glitches rather than macroeconomic demand - a CPI heavily weighted toward food forces central banks to react to temporary supply issues 3930. By structurally reducing the weight of food, India's headline inflation metric will become inherently less volatile. This will provide policymakers with a clearer signal of core economic conditions and improve the transmission of monetary policy 3931.
Bottom line
The Consumer Price Index is not a static list of retail prices; it is a dynamic, highly engineered reflection of a society's priorities, technology, and economic health. By applying hedonic regressions to strip out technological improvements, shifting to annual weight updates to mitigate substitution bias, and utilizing rental equivalence models to separate housing consumption from investment, statistical agencies attempt to isolate the pure erosion of purchasing power. However, no single index perfectly captures everyone's reality - which is why the specific mathematical choices behind these baskets continue to dictate the financial fates of retirees, wage earners, and central banks globally.