What Data You Need to Train a Swing-Trading AI
To train a successful swing-trading artificial intelligence model, developers must combine clean, point-in-time historical price data with macroeconomic indicators and natural language sentiment analysis. The greatest challenge in this process is not writing the actual machine learning algorithm, but rather acquiring survivorship-bias-free datasets that accurately reflect what information was publicly available to traders at any specific second in history. Without rigorously adjusted and historically pristine data, even the most sophisticated deep learning models will generate false signals and fail in live markets.
The Anatomy of the Swing-Trading Timeframe
Before accumulating datasets, quantitative researchers must precisely define the operational horizon of the algorithm they are attempting to build. Financial markets operate across vastly different time scales, and an artificial intelligence model trained for one paradigm will inevitably fail if deployed in another. Swing trading occupies the strategic middle ground between high-frequency day trading and long-term, macroeconomic investing 1. The objective of a swing-trading algorithm is to capture short- to medium-term price momentum, typically holding positions from a few days to several weeks 2.
This specific temporal horizon dictates the foundational data architecture the machine learning model requires. A high-frequency trading (HFT) algorithm demands ultra-low latency, millisecond-level tick data to front-run order flow and capture fractions of a cent 3. Conversely, a long-term value investing algorithm relies heavily on decades of quarterly fundamental reports and balance sheet analysis. A swing-trading AI, however, requires a specialized hybrid approach: it needs high-quality daily price data to capture broader momentum trends, fused with short-term sentiment analysis and macroeconomic indicators to gauge sudden shifts in market regimes 24.
Because swing traders sit in this middle ground - aiming to take advantage of fluctuations that occur within broader macroeconomic trends - they rely heavily on technical analysis 1. The machine learning models must be trained to recognize patterns, momentum oscillators, and moving average crossovers that historically signal when market momentum is shifting 15. However, teaching an AI to recognize these patterns requires a deep understanding of data granularity, noise filtering, and historical accuracy.
The Granularity Dilemma: Daily vs. Intraday Data
When constructing the foundational historical dataset for a swing-trading AI, developers are immediately faced with a choice regarding the time resolution of their data - a concept known in quantitative finance as data granularity 6. The standard format for financial price data is OHLCV, which stands for Open, High, Low, Close, and Volume 1. This dataset powers the mathematical indicators and decision-making processes of virtually all trading algorithms 1.
Novice quantitative developers often operate under the misconception that feeding a model the highest resolution data available - such as 1-minute, 5-minute, or even tick-level data - will inherently produce a smarter, more profitable strategy 8. In the context of swing trading, this assumption is fundamentally flawed. Overly granular data introduces market microstructure noise that obscures the actual trends the AI needs to learn.
When training an algorithm on minute-by-minute data, the model is exposed to transient liquidity spikes, bid-ask bounces, and high-frequency noise that are largely irrelevant to a trade intended to be held for two weeks 6. Furthermore, intraday data places an immense burden on local hardware and cloud storage. A single currency pair or high-volume stock can generate hundreds of thousands of tick data points in a single day, compared to just a single data point in a daily summary 8. Processing decades of this high-frequency data to train a deep learning model can lead to excessive processing loads, crashing systems, and exponentially inflating cloud computing costs 8.
More dangerously, high granularity frequently leads to overfitting 69. Overfitting occurs when an algorithm learns the exact historical noise of the training data rather than the underlying predictive patterns. An overfitted model will perform exceptionally well in backtesting but will fail spectacularly in real-time live trading 69.
Conversely, daily (End-of-Day or EOD) data strips out the chaotic intraday noise, allowing the algorithm to focus clearly on the broader momentum trends that define a successful swing trade 6. However, relying solely on daily data has its own drawbacks; it blinds the model to extreme intraday volatility, meaning the algorithm might miss sudden profit opportunities or fail to understand why a live stop-loss was triggered during a mid-day flash crash 6.
| Feature | Daily (End-of-Day) OHLCV Data | Intraday (Tick / Minute) Data |
|---|---|---|
| Primary Use Case | Trend following, multi-day pattern recognition, and broad swing trading strategies 56. | High-frequency trading, precise entry/exit optimization, and market microstructure analysis 8. |
| Storage & Computing Needs | Low to moderate. Can often be processed locally or with standard cloud instances 8. | Immense. Requires big data infrastructure, specialized time-series databases, and high computing costs 68. |
| Signal-to-Noise Ratio | High. Smooths out daily volatility to reveal core momentum 1. | Low. Model must filter out bid-ask bounces, temporary liquidity gaps, and high-frequency algorithms 6. |
| Transaction Cost Modeling | Easier to model standard slippage, but less accurate for precise intra-day fills 6. | High precision for slippage modeling, but frequent trading signals rapidly inflate modeled transaction costs 6. |
To resolve this dilemma, sophisticated retail and institutional developers often utilize a dual-granularity approach. They train the core directional and predictive algorithm on daily OHLCV data to establish the overarching trade thesis. Once the daily model generates a "buy" signal, a separate, lightweight execution algorithm utilizing real-time or 5-minute intraday data takes over to optimize the exact entry price and minimize slippage 2.
The Corporate Action Trap: Raw vs. Adjusted Data
Acquiring daily OHLCV data is relatively straightforward, but raw price data straight from an exchange is notoriously messy and entirely unsuitable for direct machine learning ingestion. For an AI model to learn historical patterns accurately, the data must be mathematically sanitized to reflect the economic reality of holding the asset over time. The primary culprits that distort raw price data are corporate actions, specifically stock splits and dividend payouts 211.
Preventing Algorithmic Hallucinations
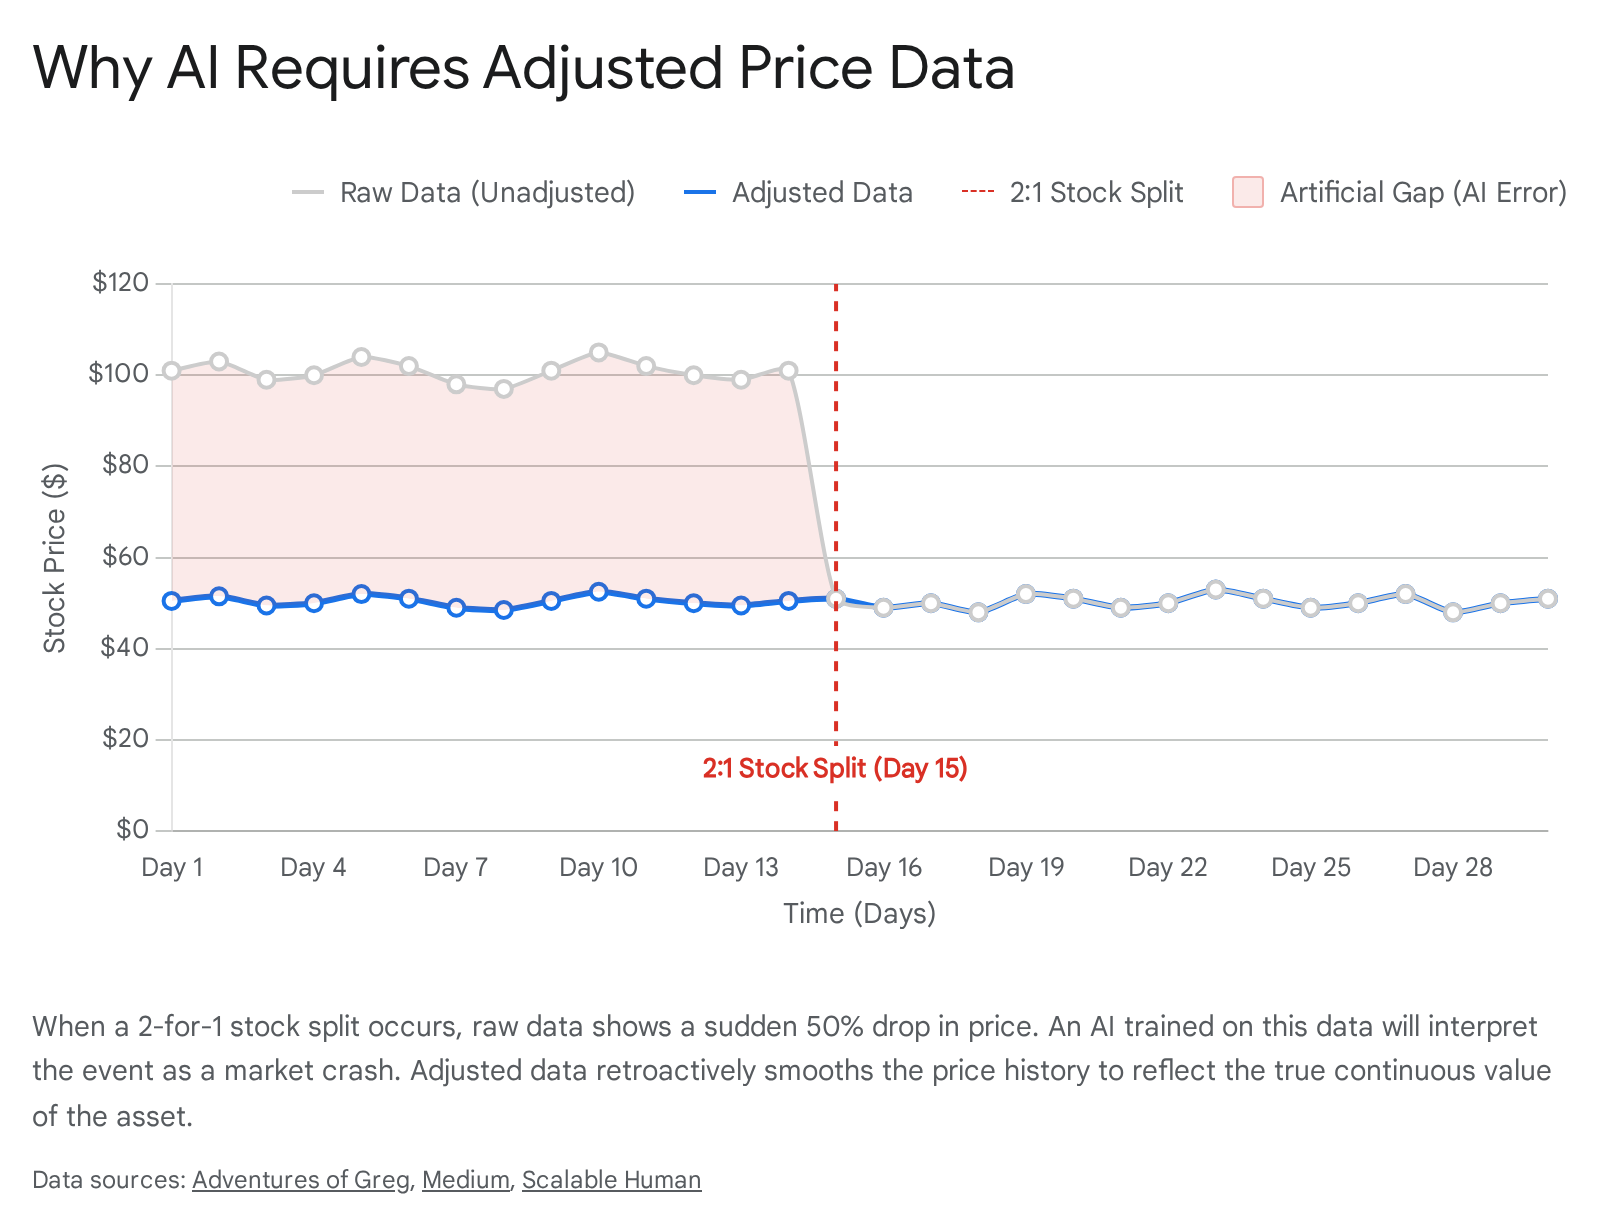
Imagine training a neural network to recognize price crashes and market panic. You feed the model raw historical data for a prominent technology stock. On a Tuesday, the stock closes at $150.00. The following morning, the stock opens at $75.00. Looking purely at the numerical data, the AI will learn this event as a catastrophic 50% loss of value, associating the preceding days' indicators with an impending market collapse 211.
However, if that company simply executed a 2-for-1 stock split, the fundamental value of the company and the investor's portfolio did not change. The investor simply awoke to own twice as many shares at half the price per share 11. Stock splits do not alter a company's fundamentals, but they do temporarily distort technical indicators such as moving averages, support levels, and momentum oscillators 11. If a machine learning model is trained on raw, unadjusted data, it will interpret these routine corporate events as extreme volatility, leading to wildly inaccurate predictions, false bearish signals, and erroneous automated sell-offs 211.
Dividends create a similar, albeit smaller, disruption. On an ex-dividend date, a stock's price typically drops by the exact amount of the dividend payout, reflecting the transfer of cash to shareholders rather than a loss of corporate value 11. An algorithm that does not account for this drop might flag the movement as a bearish signal, leading to premature exits from otherwise healthy swing trades 11.
To solve this, quantitative researchers must train their AI on adjusted data. This data retroactively modifies the entire history of the stock's price to account for splits, reverse splits, and dividends, creating a seamless, continuous price series 212. Adjusted data perfectly reflects the total return of holding the asset over time, preventing the AI from being fooled by artificial price gaps 2.
However, raw data is not entirely useless; in fact, it is a mandatory secondary dataset for backtesting execution rules. While adjusted data is required for signal generation and training the AI's pattern recognition, raw data must be used to simulate the actual execution of the trade, calculate slippage, and determine exact position sizing based on available capital 212. Because share quantities change during a split, calculating realistic historical transaction costs demands the unadjusted price that was physically seen on the exchange at that specific moment 12.
The Silent Killers: Survivorship and Look-Ahead Bias
Even with perfectly adjusted, highly granular data, an artificial intelligence model is virtually guaranteed to fail in live markets if the training dataset suffers from structural biases. Financial data is uniquely perilous because the market ecosystem is constantly evolving, and the participants - the companies themselves - frequently cease to exist. The two most insidious flaws that plague algorithmic trading development are survivorship bias and look-ahead bias 13315.
Survivorship Bias: Training on Ghosts
Survivorship bias is the most dangerous phenomenon in quantitative finance. It occurs when a historical dataset only includes assets that have survived to the present day, completely ignoring companies that went bankrupt, were delisted, or were acquired during the testing period 3161718.
Consider a developer attempting to build a swing-trading AI focused on the S&P 500 index. If they download a free dataset from a popular finance portal containing the historical prices of the current 500 constituents and run a backtest starting from 2010, the AI's performance will likely look extraordinary 16. It will appear to be a foolproof, highly profitable system. The reality, however, is that the algorithm is cheating. By only looking at the 500 companies that were successful enough to remain in the index today, the dataset has pre-selected the historical winners 1318.
The model never experiences the devastating losses from companies that crashed to zero, were relegated to over-the-counter (OTC) penny stock status, or were removed from the exchange entirely 19. Of the nearly 3,000 constituents of the Russell 3000 index when it was created in 1986, fewer than 20% have survived to the present day 3. If your strategy occasionally holds positions in distressed companies, a standard free dataset will never capture those losses because those failed companies have been scrubbed from the record 19.
The academic consensus on this is stark. Research by Elton, Gruber, and Blake demonstrated that survivorship bias in mutual fund databases overstates average returns by roughly 0.9% per year 19. In the volatile cryptocurrency sector, a comprehensive study covering 2014 to 2021 found that survivorship bias artificially inflated equal-weighted buy-and-hold portfolio returns by an astonishing 62.19% 20.
To train a robust and honest model, developers must acquire a survivorship-bias-free dataset 21. These premium datasets, usually sourced from institutional vendors, maintain the historical price records of "dead" companies exactly as they traded before delisting 17212223.
Look-Ahead Bias and Point-In-Time (PIT) Data
While survivorship bias relates to which assets are in the dataset, look-ahead bias - also known as future leak - relates to when the data was actually known. Look-ahead bias happens when a quantitative model accidentally incorporates information that would not have been publicly available at the exact historical moment the AI is simulating a trade decision 1524.
This error is incredibly common when integrating fundamental corporate data or macroeconomic indicators. For example, a company officially closes its first fiscal quarter on March 31. However, the audited earnings report detailing that quarter's performance might not be released to the public until May 15 324. If a developer maps the Q1 earnings data to the March 31 date in their training database, the AI will "learn" to buy or sell the stock throughout April based on earnings data that did not exist yet 324.
Similarly, macroeconomic data like GDP or the Consumer Price Index (CPI) is frequently revised weeks or months after its initial release. If a model trains on the finalized, revised numbers rather than the preliminary numbers that traders actually saw on the release day, the AI is effectively trading with a crystal ball 15.
To eliminate this future leakage, professional algorithms require Point-in-Time (PIT) data 252627. A PIT database utilizes bitemporal modeling: it records not only the period the data applies to, but the exact timestamp of when that specific data point became publicly known to the market 2628. Building or buying a true PIT database is a massive technical challenge, but it is mandatory for ensuring the AI only analyzes the market exactly as a human trader would have experienced it on any given historical date 2627.
Feature Engineering: Making Data AI-Readable
Machine learning algorithms rarely ingest raw historical prices directly. Deep learning models like Long Short-Term Memory (LSTM) networks or tree-based ensemble algorithms like XGBoost struggle to extract predictive meaning from raw, non-stationary price series 945. Financial time-series data is inherently non-stationary, meaning its statistical properties, such as mean and variance, shift wildly over time depending on market conditions 9.
Instead of feeding the AI raw closing prices, quantitative researchers use a process called feature engineering to transform the data into mathematical representations that algorithms can easily process 3132. Essential features engineered for swing-trading models include:
- Fractional Differentiation: Traditional statistics often require taking the difference between consecutive prices (integer differencing) to make data stationary. However, this destroys the "memory" or historical context of the asset's price trajectory. Advanced financial machine learning models apply fractional differentiation, a technique that carefully removes the underlying trend while preserving maximum historical memory, allowing the AI to understand the context of a price movement 931.
- Normalized Technical Indicators: Algorithms are fed rolling calculations like the Relative Strength Index (RSI), Moving Average Convergence Divergence (MACD), and Exponential Moving Averages (EMA). These technical indicators normalize price action, helping the AI identify momentum shifts, breakouts, and mean-reversion setups regardless of the asset's absolute dollar value 5133.
- Event Filters (CUSUM): To prevent the AI from processing every minor tick as important, quants apply Cumulative Sum (CUSUM) filters to the data. These filters act as triggers, only passing data to the model when a statistically significant change or structural break in the trend has occurred 931.
Expanding the Dataset: Macroeconomics and Alternative Data
In the highly competitive landscape of modern quantitative finance, relying solely on historical OHLCV data is no longer sufficient to generate consistent, market-beating returns. If an AI only analyzes price charts, it is competing against every other basic algorithmic bot on the market. To generate true alpha, models increasingly rely on macroeconomic context and unstructured alternative data.
Macroeconomic Regime Detection
A sophisticated swing-trading AI must understand the broader economic environment to know whether its technical signals are occurring in an expansionary bull market or a recessionary bear market. Machine learning models are now routinely trained on historical macroeconomic series to provide this context 3234.
Key macroeconomic features injected into the training data include: * Interest Rates: The Federal Funds Rate dictates the cost of capital. Changes in this rate fundamentally alter the flow of liquidity between high-risk equities and safe-haven fixed-income assets 3234. * Inflation Metrics (CPI): Sustained inflation erodes corporate earnings and consumer purchasing power, acting as a headwind for specific retail and growth sectors 532. * Gross Domestic Product (GDP) & Unemployment: These lagging indicators provide a baseline for the overall health of the economy, helping the model contextualize long-term trends 532.
By feeding these macroeconomic variables into a multi-horizon prediction system, the AI can learn complex, non-linear relationships. For example, it might learn that a bullish technical breakout pattern that succeeds 80% of the time during a low-interest-rate environment fails 70% of the time during a high-inflation tightening cycle 3233.
Alternative Data: NLP and the Sentiment Revolution
The most profound evolution in algorithmic swing trading over the past five years has been the integration of alternative data, specifically sentiment analysis derived from global financial news and social media 353637.
Traditional financial theory assumes that market prices instantly reflect all available information. However, the retail trading phenomena of the 2020s - most notably the meme-stock short squeezes - demonstrated that investor psychology, coordinated on platforms like Reddit and Twitter (X), can completely overwhelm fundamental corporate valuations and drive massive swing-trading momentum 38640.
To harness this, data scientists utilize advanced Natural Language Processing (NLP) models. Early sentiment algorithms relied on basic dictionary approaches, simply counting the ratio of "positive" words to "negative" words in an article. These rudimentary systems fail miserably in finance, as they cannot detect sarcasm, irony, or domain-specific jargon (e.g., understanding that a company "lowering guidance" is highly negative despite containing neutral vocabulary) 35367.
Modern systems utilize Transformer-based deep learning architectures like FinBERT 36378. FinBERT is a language model explicitly pre-trained on vast corpuses of financial texts, allowing it to understand the nuanced context of earnings call transcripts, analyst reports, and chaotic Reddit threads 36379.
When training an AI, researchers increasingly fuse these NLP sentiment scores with traditional LSTM time-series networks to create hybrid, multimodal algorithms.
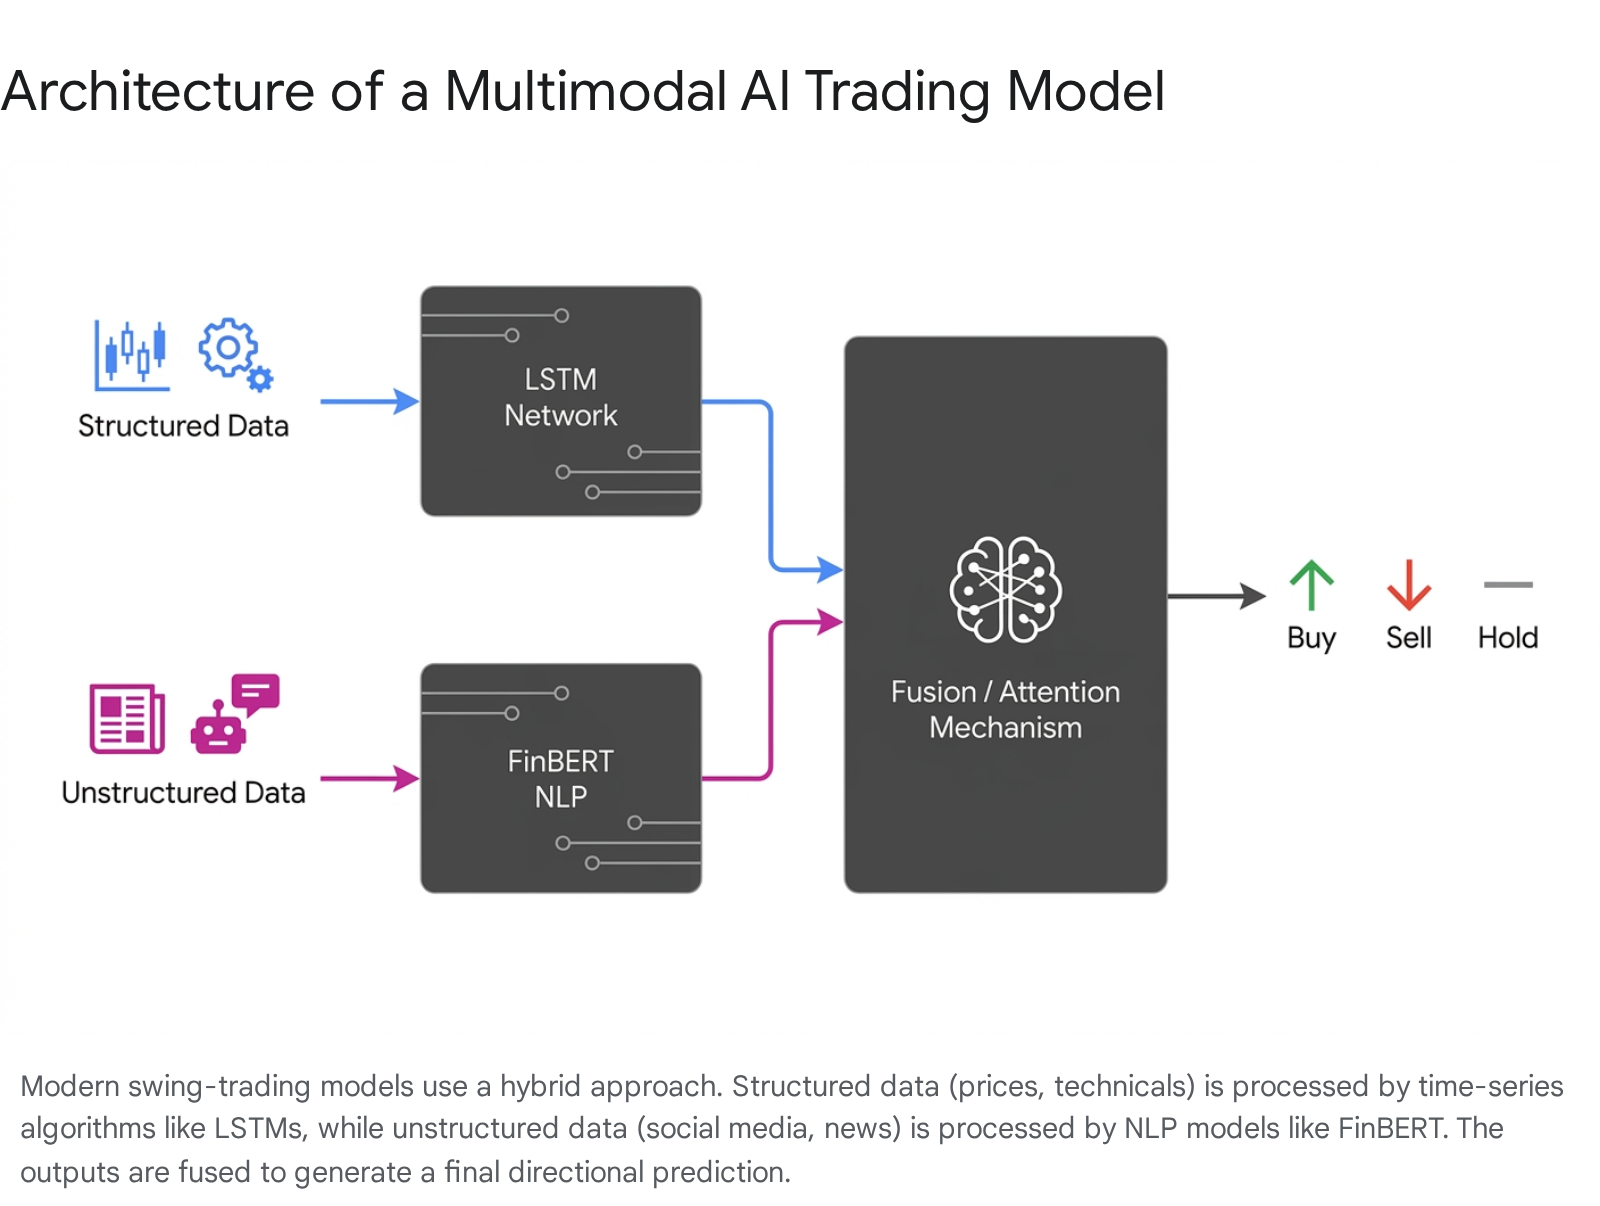
Academic research demonstrates that models looking simultaneously at structured price momentum and unstructured emotional sentiment achieve significantly higher directional accuracy than models relying on numerical price data alone 33910. Interestingly, research shows a divergence in the predictive horizon of these alternative datasets: formal news sentiment tends to predict stock returns for one to two days (and occasionally up to a quarter), while the chaotic velocity of social media sentiment is highly predictive for acute, short-term intraday or multi-day volatility 71146.
However, incorporating this data presents steep technical barriers. Following stringent API pricing changes implemented by platforms like Twitter (X) and Reddit in 2023, the cost of scraping real-time social media data at scale has skyrocketed, effectively locking many independent retail traders out of the institutional-grade sentiment game 68.
Asset Class Specifics: Crypto and Emerging Markets
The data requirements for a swing-trading AI also shift dramatically depending on the specific asset class being traded. A model trained successfully on U.S. equities cannot simply be deployed into emerging markets or digital assets without a fundamental overhaul of its data architecture.
The Crypto Data Exception
The cryptocurrency market presents unique algorithmic challenges. First, crypto trades 24 hours a day, 365 days a year. There is no opening or closing bell, rendering the traditional "Daily Close" price an entirely arbitrary timestamp (usually pegged to 00:00 UTC) 1248. This non-stop operation makes the market highly susceptible to sudden, off-hour volatility spikes and liquidity drainages.
Second, because crypto lacks the centralized structure of traditional stock exchanges, liquidity is highly fragmented across hundreds of decentralized exchanges (DEXs) and centralized venues (e.g., Binance, Coinbase) 13. Because of this fragmentation, training an AI solely on basic OHLCV data is highly discouraged. To build a reliable crypto AI, developers must train models on deep Level 2 (L2) and Level 3 (L3) order book data 13.
L2 data reveals the depth of the market, showing the multiple tiers of bids (buy orders) and asks (sell orders) resting on the exchange 13. L3 data provides even more granularity by tracking individual orders, allowing the AI to see exactly how market makers are adding or pulling liquidity in real time 13. Because cryptocurrency pricing is so acutely driven by immediate liquidity rather than long-term corporate fundamentals, an AI must "see" the order book to understand the microstructure mechanics driving the swing 13.
Furthermore, survivorship bias is notoriously severe in crypto. Thousands of "altcoins" launch, briefly surge in volume, and then vanish or are delisted by major exchanges. Failing to include these dead coins in historical backtesting drastically inflates the perceived success of trend-following strategies 2050.
Emerging Markets Data
Similarly, training a model for emerging markets (EM) requires careful data curation. Emerging markets tend to experience massive price swings, creating deep valuation peaks and valleys that swing-trading algorithms love to target 14. Furthermore, EM equities often exhibit lower correlations with U.S. indices, providing excellent diversification benefits for global models 1516.
However, the data environment in emerging markets is far more challenging. Index turnover (the rate at which companies are added or removed from a major index) is nearly twice as high as in developed markets, exacerbating the risks of survivorship bias 17. Furthermore, trading costs, taxation structures, and liquidity constraints are significantly higher, meaning the AI must be fed highly accurate historical transaction cost models to ensure theoretical backtested profits are not entirely erased by slippage and fees in live execution 17.
Sourcing the Data: Providers and Costs
Ultimately, the quality of a swing-trading AI is entirely dependent on the quality of its data provider. Building proprietary infrastructure to ingest, clean, split-adjust, and store point-in-time financial data is a monumental task that distracts from actual algorithm development 1856. Therefore, nearly all quantitative researchers rely on specialized third-party data vendors.
The market is distinctly split between institutional-grade terminals and developer-friendly retail APIs. Institutional platforms like the Bloomberg Terminal, Refinitiv Eikon, or S&P Capital IQ offer unparalleled global coverage, real-time depth, proprietary alternative datasets, and pristine point-in-time accuracy. However, these systems are priced for enterprise use, often costing between $12,000 to over $30,000 per user, per year 575859.
For independent algorithmic traders, boutique quant funds, and academic researchers, a tier of specialized API providers has emerged, offering clean, historically accurate data at a fraction of the enterprise cost.
| Data Provider | Target Audience | Key Strengths | Historical Coverage & Bias | Pricing Estimate |
|---|---|---|---|---|
| Bloomberg / Refinitiv 5758 | Institutional / Enterprise | Unmatched global scale, fixed income, OTC, messaging, proprietary news feeds. | Complete PIT architecture, entirely bias-free, deep historical archives. | $24,000 - $30,000+ / year 58 |
| Norgate Data 236019 | Systematic EOD Traders | The gold standard for survivorship-bias-free data. Historically accurate index constituents. | Exceptional. Includes delisted stocks back to 1950. No intraday data provided 601920. | $150 - $300 / 6 months 63 |
| Polygon.io 32165 | Algorithmic Developers | Ultra-low latency real-time feeds, highly developer-friendly WebSockets. | Good for recent data, but handling recycled or delisted tickers can be technically complex 66. | $29 - $199 / month 367 |
| Alpha Vantage 36567 | Beginners / Researchers | Generous free tier, global coverage, built-in technical indicators accessible via API. | Prone to survivorship bias on lower tiers. Lacks strict point-in-time guarantees 65. | Free to ~$100 / month 67 |
| Tiingo 3 | Quants / Data Scientists | Highly affordable EOD data, extensive news archive (50M+ articles) ideal for NLP sentiment training. | Good historical depth for the price. | $10+ / month 3 |
For a swing-trading AI that relies heavily on daily data to establish momentum trends, Norgate Data is widely considered the optimal retail provider. It explicitly solves the survivorship bias problem by maintaining thousands of delisted tickers and provides historically accurate index constituents - meaning the AI knows exactly which 500 stocks were actually in the S&P 500 on any specific day in history, preventing future leakage 231920. For models requiring high-frequency execution or cryptocurrency data, providers like Polygon or CoinAPI bridge the gap by delivering synchronized order-book depth necessary for live execution 1365.
Bottom line
Training a successful swing-trading AI requires much more than simply feeding raw price charts into an advanced neural network. Developers must construct a rigorous pipeline of point-in-time, split-adjusted historical data that explicitly includes bankrupt and delisted companies to eliminate devastating survivorship and look-ahead biases. While combining this pristine time-series data with macroeconomic indicators and NLP-driven social sentiment offers the clearest path to generating true market edge, the ultimate success of the model relies almost entirely on the cleanliness of its data infrastructure. An AI is only as intelligent as the data it consumes; the true challenge of algorithmic trading is not mastering the math, but mastering the data.