What College Graduation Rates Tell You About a School
College graduation rates serve as the single most powerful indicator of an institution's ability to support its students academically, financially, and socially, heavily predicting a student's likelihood of securing a positive financial return on their educational investment. However, because traditional federal metrics often exclude part-time and transfer students, prospective families must look beyond the top-line percentage to examine retention data, demographic gaps, and post-graduation earnings to accurately evaluate a school's true quality.
The Anatomy of a Graduation Rate
When a college advertises its graduation rate on a glossy brochure or during an enthusiastic campus tour, it is usually referencing a highly specific, federally mandated metric. Under the Student Right-to-Know Act of 1990, colleges and universities that participate in federal financial aid programs (Title IV) are legally required to report their completion rates to the Integrated Postsecondary Education Data System (IPEDS), a core program administered by the National Center for Education Statistics (NCES) 123.
However, the "traditional" graduation rate is not a simple calculation of everyone who enrolls in a given year versus everyone who eventually crosses the commencement stage. Historically, the standard IPEDS metric has measured completion based on a very strict cohort: "first-time, full-time" (FTFT) degree-seeking undergraduate students 134.
Furthermore, the timeline for graduation has shifted. Because modern students increasingly require more than four years to finish a bachelor's degree - due to changing majors, working while enrolled, navigating complex prerequisite paths, or fulfilling extensive internship requirements - the standard benchmark for evaluating a four-year institution is actually the six-year graduation rate, which represents 150 percent of normal program time 145. For two-year community colleges, the equivalent benchmark is the three-year rate 6.
Establishing the National Benchmark
To understand what constitutes a "good" graduation rate, one must first look at the national averages. According to comprehensive tracking by the National Student Clearinghouse (NSC) Research Center, the national six-year completion rate for the fall 2019 cohort was 61.1 percent 7. This number has held relatively steady over the last four tracked cohorts, though it dipped slightly from 61.4 percent the previous year. This minor decline was not necessarily due to a surge in dropouts, but rather because a higher share of students (9.0 percent) remained enrolled past the six-year mark rather than stopping out or completing their degree 7.
When tracking students out to eight years - representing 200 percent of normal time - the national completion rate edges up to 64.8 percent, as seen with the cohort starting in fall 2017 7. Tracking post-secondary outcomes out to an eighth year reveals that improvements in long-term completion rates are primarily driven by students finishing within their first six years, rather than lingering into their seventh or eighth years of study 7.
Sector Variations and Institutional Selectivity
Graduation rates are far from uniform across the higher education landscape. They vary wildly depending on the sector, the fundamental mission of the institution, and the socioeconomic resources available to the incoming student body. Evaluating a school requires placing its graduation rate within the context of its institutional peers.
| Institution Type (4-Year) | Average 6-Year Graduation Rate | Average Retention Rate (Full-Time) | Sector Characteristics & Context |
|---|---|---|---|
| Private Nonprofit | 68% - 76% | ~58% - 68% | Often feature smaller classes, substantial median endowments (~$42.2M), and selective admissions. They boast the highest overall rates, though the trend has slightly declined in recent cohorts 5789. |
| Public / State | 63% - 71% | ~60% - 68% | Serve the vast majority of four-year students. Rates vary heavily based on whether the school is a highly resourced state flagship or a regional campus serving local populations 57910. |
| Private For-Profit | 29% - 36% | ~50% - 60% | Historically yield the lowest completion rates. These institutions tend to enroll older, non-traditional students but face ongoing criticism for high debt burdens and inadequate academic support 59. |
| Highly Selective | 90%+ | 95%+ | Schools accepting fewer than 25% of applicants (e.g., Ivy League institutions like Harvard or Princeton) see the highest rates, largely due to admitting highly prepared, highly resourced students 111213. |
| Open Admissions | ~28% | Varies | Institutions that accept all applicants naturally face steeper challenges with academic preparedness, financial strain, and consequently, lower overall student retention 11. |
While a 97 percent graduation rate at Harvard University or Princeton University is undeniably impressive, it is largely a function of institutional selectivity 1213. These elite colleges admit students who possess robust academic foundations and significant resources, making them overwhelmingly likely to succeed regardless of where they enroll. In contrast, regional public universities that accept the majority of their applicants but manage to maintain graduation rates well above the 61 percent national average are often executing remarkable feats of institutional support, proactive advising, and effective teaching. A high graduation rate at an inclusive institution is arguably a stronger indicator of institutional value-add than a high rate at an exclusive one.
The Flaw in the Federal Formula: Who Gets Left Out?
If a prospective student or policy analyst relies solely on the traditional IPEDS graduation rate, they are only seeing a fraction of the actual student body. Because the standard metric relies strictly on first-time, full-time students, it effectively excludes a massive, growing portion of the modern college population. In fact, traditional official graduation rates exclude students who attend college part-time or transfer out of the institution where they first enrolled, limiting the data to only about 47 percent of new undergraduates each fall 4.
If a student begins their post-secondary journey at a local community college, earns an associate degree, and transfers to a four-year state university to finish their bachelor's degree, they are entirely excluded from the receiving university's traditional graduation rate 13. If a student enrolls part-time so they can work to support their family or care for dependents, they are similarly excluded from the headline metric 13.
Recognizing this severe data limitation, the Department of Education established the Committee on Measures of Student Success, which led to the creation of a newer, more comprehensive survey component called Outcome Measures (OM) 3. First implemented for the 2015 - 16 collection year, the OM survey tracks completion outcomes for all entering degree-seeking undergraduates, including non-first-time transfer students and part-time learners, measuring the highest credential earned over an eight-year horizon 34. Based on the most recently published OM data, the survey reported eight-year outcomes for approximately eight million degree-seeking undergraduates, providing a vastly more accurate picture of how institutions serve non-traditional populations 3.
The Part-Time Penalty
When examining the broader data provided by the National Student Clearinghouse and the new Outcome Measures, a stark reality emerges: American higher education is largely engineered for the full-time student, and part-time students suffer severe completion penalties as a result.
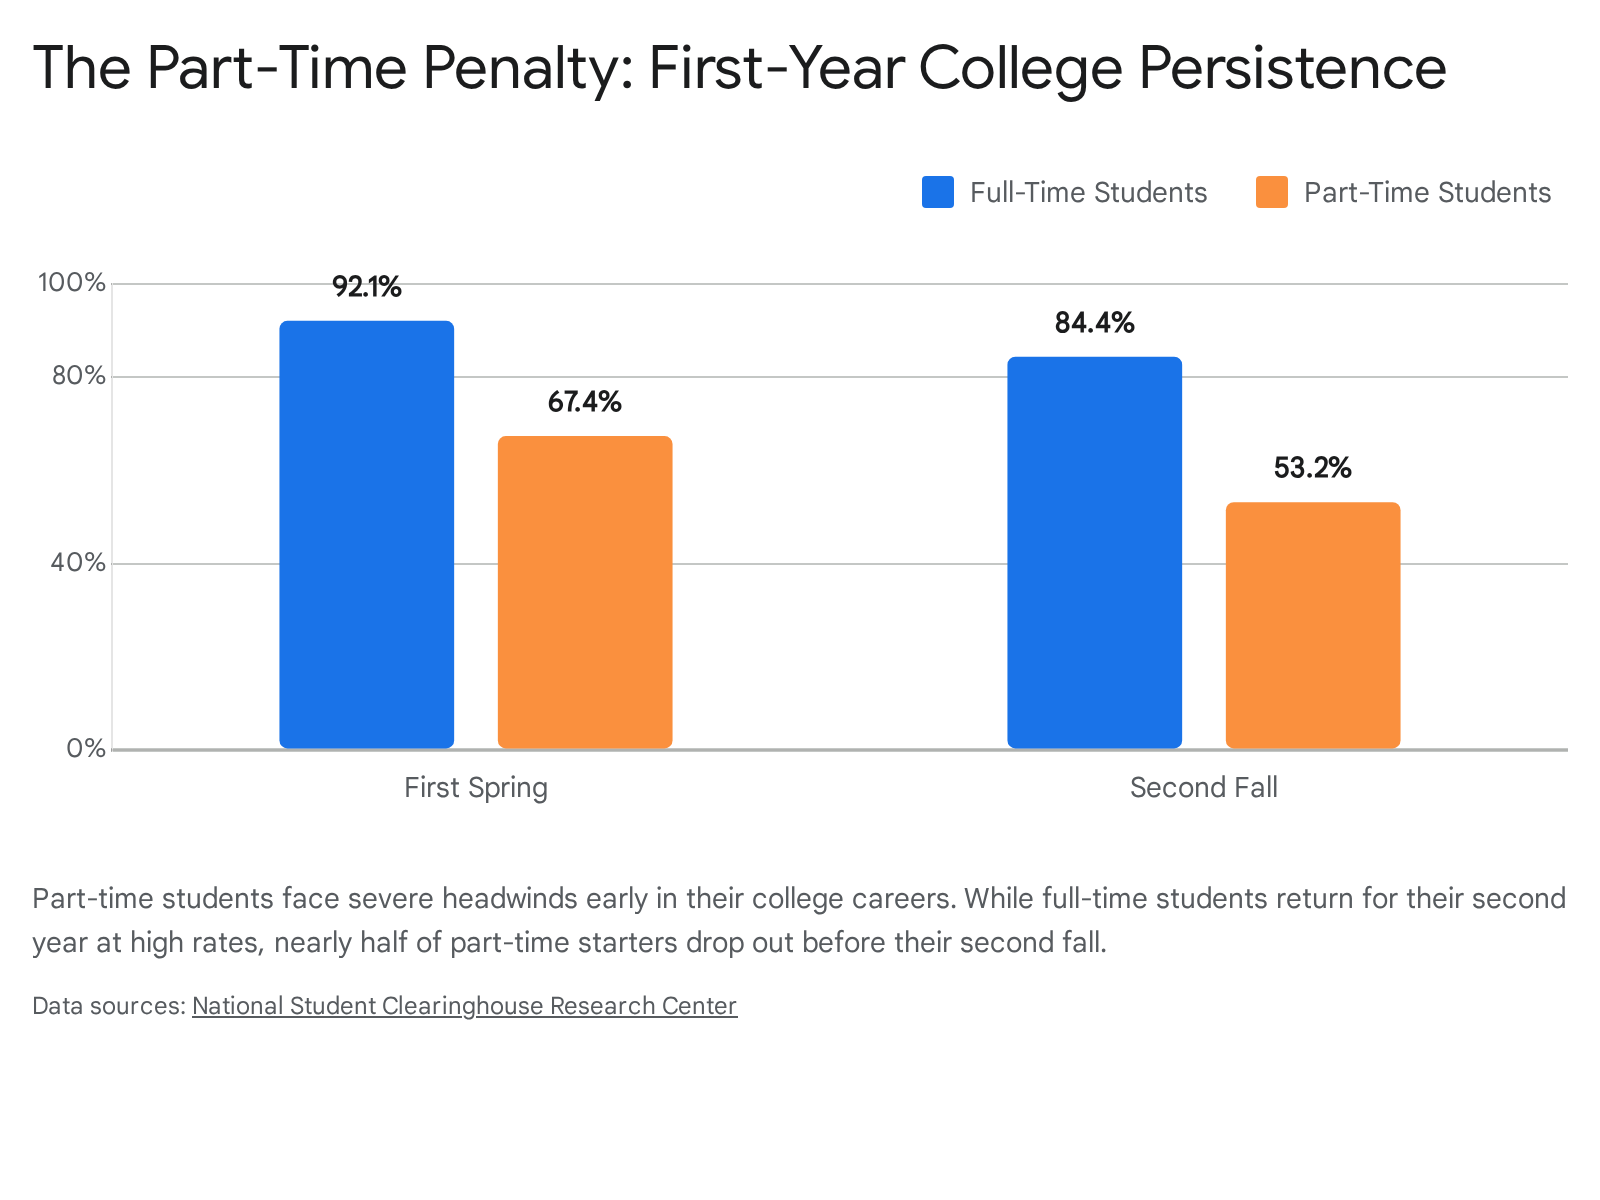
Part-time students face substantial headwinds early in their college careers, struggling to maintain momentum while balancing academic rigor with external work and family obligations. According to recent NSC data for the Fall 2023 entering cohort, the first-spring persistence rate - measuring students who remain enrolled anywhere for the spring term immediately following their first fall - was 92.1 percent for full-time students. For their part-time peers, that rate plummeted to 67.4 percent 1415.
The attrition only compounds as time goes on. By the second fall of their enrollment, the persistence rate was 84.4 percent for full-time starters, compared to a devastating 53.2 percent for part-time starters 14. This indicates that nearly half of all part-time students effectively end their college careers within a single calendar year.
The Transfer Trap
Community colleges are frequently touted by policymakers and high school guidance counselors as an affordable, accessible gateway to a four-year bachelor's degree. In theory, the pathway is highly efficient; in practice, it is heavily fractured.
Transfer enrollment represents a significant portion of the higher education ecosystem, making up roughly 13.2 percent of all continuing and returning undergraduates in the fall of 2023 16. Despite this volume, the actual outcomes for these students are alarming. Data tracking the 2018 cohort of community college starters reveals that fewer than one in five students (18.0 percent) successfully earned a bachelor's degree within six years 151718.
When evaluating a four-year college, it is crucial to investigate how well they support transfer populations. Some universities have seamlessly integrated articulation agreements and dedicated transfer-specific advising, allowing transfer students to graduate at rates that actually exceed the national average 19. For example, data from Texas public universities shows that many institutions boast higher graduation rates for transfer students than their national Carnegie Classification averages 19. Conversely, institutions that accept community college credits poorly force transfer students to repeat extensive coursework. This friction causes students to run out of federal financial aid eligibility, exhaust their personal savings, and ultimately drop out before securing their intended degree.
The Demographics Behind the Data: Uncovering Inequities
Graduation rates do not merely reflect an institution's overall academic quality; they frequently expose deep systemic inequities within the education system. Disaggregating graduation data by demographic characteristics reveals distinct, persistent gaps in who actually succeeds in American higher education.
Gender disparities, for example, have become entrenched across all sectors. The six-year graduation rate is consistently higher for female students than for male students at both public institutions (66 percent versus 60 percent) and private nonprofit colleges (71 percent versus 64 percent) 511. The only sector where this trend reverses is at private for-profit institutions, where males maintain a slightly higher, albeit exceptionally low, completion rate than females (31 percent versus 28 percent) 5.
Racial disparities are equally stark and reflect broader societal resource gaps. Looking at the entry class of 2018, approximately 77 percent of Asian students and 73 percent of white students successfully graduated within six years. In contrast, completion rates fell to 52 percent for Hispanic students and 45 percent for Black students 9. When evaluating a college's graduation rate, one must ask whether the institution is successfully graduating its underrepresented minority populations or if its high overall average is masking severe outcome disparities among marginalized groups 20.
| Demographic Subgroup | 6-Year Graduation Rate (Recent Cohorts) | Post-Graduation Debt Context |
|---|---|---|
| Asian Students | ~77% | Highest overall completion rates; highly represented in selective institutions 9. |
| White Students | ~73% | Standard benchmark for majority demographics 9. |
| Female Students | 67% (Overall) | Outperform male counterparts in both public and private non-profit sectors 5. |
| Male Students | 60% (Overall) | Lag behind females nationally, presenting a growing retention challenge for universities 5. |
| Hispanic Students | ~52% | Represent a rapidly growing segment of college enrollees, yet face a 20+ point completion gap compared to top cohorts 9. |
| Black Students | ~45% | Face systemic barriers; institutions must be evaluated on how they support these specific cohorts through graduation 9. |
The First-Generation Completion Crisis
One of the most concerning variables in college completion is a student's parental education level. A "first-generation" student is broadly defined as an individual whose parents did not attain a credential at or above a bachelor's degree 21.
Demographically, the landscape is shifting. The overall proportion of first-generation students enrolled in U.S. degree-granting institutions has actually declined over the last two decades, dropping from 66 percent in 1996 to 53 percent in 2020 2121. However, researchers at the Pell Institute note that this decline is primarily due to rising educational attainment among American adults - meaning more parents hold degrees today than in the 1990s - rather than a reduction in college access 2121.
While the pool of first-generation students is shrinking relative to the total population, the structural barriers they face remain formidable. Research consistently demonstrates a massive completion gap. Only about 24 to 27 percent of first-generation students complete a bachelor's degree within four years, compared to roughly 42 to 59 percent of their continuing-generation peers 2322. Even when given a longer runway and tracked out to six years, the completion gap remains stubbornly fixed at 17 percentage points (69 percent for first-generation versus 86 percent for continuing-generation students at comparable four-year institutions) 22.
When investigating why first-generation students leave campus without a degree, researchers have found that the attrition rarely reflects a lack of academic capability or intellectual rigor. Instead, the dropout rate is driven by a trifecta of systemic barriers. First is profound financial strain. Nearly 70 percent of first-generation students receive Pell Grants, indicating high financial need, and they consistently score higher on metrics of financial stress 2323. Furthermore, first-generation college graduates incur more debt, with 65 percent owing $25,000 or more in student loans, compared to 57 percent of continuing-generation graduates 23.
Second is navigational friction. First-generation students inherently lack the familial "college knowledge" required to decipher confusing financial aid award letters, navigate complex major prerequisites, or understand the critical importance of utilizing professors' office hours 23. A significant percentage of high school juniors, particularly from first-generation backgrounds, lack awareness of basic financial aid terminology like the FAFSA 23.
Third is a persistent lack of institutional belonging. Feelings of isolation or "imposter syndrome" can swiftly drive highly capable students to disengage and drop out. Educational researchers note that belonging gaps are statistically just as damaging to student retention as financial or academic deficits 23. First-generation students are known to utilize health services, academic advising, and tutoring at lower rates than their peers, not because the services do not exist, but due to a lack of awareness and comfort in accessing them 23.
Colleges that successfully close this first-generation completion gap do not rely on students to independently seek out help. The institutions that boast the highest graduation rates for under-resourced students treat academic and financial support as core infrastructure rather than optional add-ons. They employ structured, mandatory interventions: embedded tutoring within difficult gateway courses, proactive early-alert advising systems that trigger when a student misses class, emergency grant funds for unexpected expenses, and summer bridge programs that build college literacy and academic confidence before the first semester even begins 23.
The Financial Stakes: Graduation Rates and the ROI of College
The national conversation surrounding higher education has increasingly focused on a single, pressing question: is a college degree actually "worth it"? The answer to that question is inextricably linked to an institution's graduation rate.
On a macroeconomic level, a college education remains a highly profitable long-term investment. Research from the Georgetown University Center on Education and the Workforce demonstrates that a decade after enrolling, 60 percent of college students earn more than high school graduates 24. The median return on investment (ROI) - calculated as the increase in lifetime earnings minus the costs of tuition, fees, and lost earnings while enrolled - for a bachelor's degree program is estimated at a robust $160,000 25. Recent longitudinal studies analyzing millions of Americans suggest that earning a degree provides an annualized rate of return between 9 and 10 percent throughout a professional career 26.
However, this impressive return on investment is absolutely not guaranteed, and the primary mechanism of financial failure in higher education is dropping out. The financial trajectory of a college student represents a profound fork in the road, heavily determined by whether they actually attain their degree. Students who take on debt but fail to graduate face severe financial headwinds. Dropping out carries a massive penalty, effectively reducing a student's expected return on investment by 57 percent 27. These individuals find themselves in the worst possible socioeconomic position: burdened with non-dischargeable student loan debt but lacking the formal credential required to unlock the salary premium needed to pay that debt off 1227.
How Institutional Graduation Rates Predict Financial Success
A college's overall graduation rate is one of the strongest statistical predictors of whether its students will ultimately see a financial payoff. Comprehensive ROI analyses, such as those conducted by the Foundation for Research on Equal Opportunity (FREOPP) using College Scorecard data, find a direct, undeniable correlation between on-time completion rates and post-graduation earnings.
The data illustrates a stark divide. Schools with the lowest on-time completion rates consistently generate a median ROI below $50,000 for their enrollees 25. Conversely, institutions where more than two-thirds of students graduate on time yield a median ROI exceeding $367,000 25. High graduation rates effectively derisk the financial investment of college.
This profound dynamic explains why the U.S. Department of Education's recently updated College Scorecard now prominently features median earnings at both the institution and program level - measured four and ten years after enrollment - right alongside graduation data and net price 24282930. Transparency advocates argue that students deserve to know the long-term financial implications of their enrollment decisions 29.
When looking closely at the earnings data by institution, a substantial number of laggards emerge. At roughly 30 percent of all colleges examined - representing over 1,200 institutions - more than half of the students enrolled earned less than high school graduates ten years after they first set foot on campus 24. In almost all of these cases, the institution suffered from high dropout rates, low transfer success, or a heavy concentration in fields of study with structurally low compensation.
Actionable Advice: How to Interrogate Graduation Rates on a College Tour
When families step onto a college campus, official tours and information sessions are often dominated by discussions of newly renovated dining halls, luxury dorm layouts, and campus safety protocols 3334. While these quality-of-life factors certainly matter for a student's immediate happiness, they do not dictate whether a student will successfully cross the finish line with a degree in hand.
Parents and prospective students must approach the college selection process as informed consumers, utilizing graduation rates not as a definitive, unquestionable judgment, but as a strategic starting point for deeper interrogation 31. A high graduation rate is a strong signal that a college possesses the institutional machinery to foster success, but a middling or low rate requires prospective families to aggressively ask why students are leaving 32.
Rather than accepting the brochure statistics at face value, families should pose specific, data-driven questions to admissions officers, financial aid counselors, and current students during their campus visits.
Probe the Freshman Retention Rate
Before a student can graduate in six years, they must survive their critical first year. The national retention rate for the top 100 national universities is generally 89 percent or higher, and 84 percent for top liberal arts colleges 32. If a school's retention rate dips significantly below these benchmarks, it is an immediate red flag indicating systemic dissatisfaction or lack of support. Families should ask specifically what percentage of freshmen return for their sophomore year, and critically, what the institution has identified as the primary reasons students leave 3233.
Investigate Financial Aid Continuity
A common, yet rarely discussed, reason students drop out in their second or third year is financial exhaustion. Some colleges offer generous "merit" scholarships to freshmen to boost enrollment numbers, but these awards are notoriously difficult to renew due to strict GPA requirements that catch first-year students off guard. Families must ask whether financial aid packages and institutional grants usually stay the same after freshman year, or if there is a historical trend of aid decreasing as students progress 33.
Demand the Breakdown Between Four-Year and Six-Year Rates
Institutions prefer to advertise their six-year graduation rate because it is inevitably higher. However, extending college by two years means two more years of tuition payments and two lost years of full-time professional income. If a school boasts a strong six-year rate but an abysmal four-year rate, it indicates deep structural problems within the curriculum. Families should ask if students frequently struggle to register for the mandatory classes they need to graduate on time, and whether popular opportunities like study-abroad programs or professional co-ops inherently extend the time to degree 31.
Assess Proactive Academic and Career Support
Colleges with exceptional graduation rates do not wait for failing students to raise their hands and ask for help; they intervene early. Prospective students should inquire about how faculty advising actually works, particularly for undeclared majors or students looking to double major 31. Furthermore, graduation is only the first step toward realizing an ROI. Families must ask about post-graduation outcomes, specifically questioning the activity level of the career center, the job placement rate for the previous year's graduating class, and how long it typically takes recent graduates to secure full-time employment in their desired fields 3433.
Break the Tour Guide Script
Campus tour guides are highly trained student ambassadors whose job is to sell the institution's best features. To gain authentic insight, families must break the script by asking second-level, reflective questions. Asking a current student what they consider the most challenging part of their transition to the college, what their biggest complaint about the school is, or what sort of student would not be happy on that campus will reveal the hidden cultural, social, and academic hurdles that standard graduation statistics mask 3134.
Bottom line
A college's graduation rate is the single most vital indicator of institutional health, directly correlating to a student's likelihood of securing a strong financial return on their higher education investment. However, these top-line federal metrics often mask severe systemic inequities, particularly the harsh completion penalties faced by part-time learners, transfer students, and first-generation populations. While post-COVID retention data shows promising signs of a slight rebound in persistence, prospective students and their families must rigorously interrogate college admissions offices about retention drop-offs, proactive advising structures, and financial aid continuity to ensure the institution is truly equipped to support them all the way to a diploma.