How to Tell If a College Is Worth the Money
To determine if a college is a good financial value, you must calculate its return on investment by weighing your expected post-graduate earnings against your true net price and the statistical risk of dropping out. While traditional four-year degrees generally offer the highest lifetime earnings, high-demand trade school programs provide a vastly superior early-career financial advantage. By utilizing federal data tools and strictly adhering to safe debt-to-income borrowing benchmarks, you can separate lucrative programs from those that result in a negative net worth.
The Paradigm Shift in Higher Education Value
For generations, an American college degree was widely regarded as a universally safe investment - an automatic ticket to the middle class that justified almost any cost. Families were actively encouraged to borrow whatever funds were necessary to cover tuition, operating on the assumption that a bachelor's degree would effortlessly pay for itself through guaranteed lifetime wage premiums. However, as we navigate 2026, soaring tuition costs, a ballooning $1.7 trillion national student debt crisis, and rapidly shifting labor markets have fundamentally shattered that monolithic assumption 123.
Today, the most critical question facing prospective students and their families is no longer simply whether college is worth it, but rather when and where it is worth it 45.
A degree's financial value is highly variable, behaving more like a complex risk-return profile than a fixed career pipeline 6. While the median bachelor's degree offers a net return on investment (ROI) of around $160,000 over a lifetime, hundreds of individual programs leave their students financially worse off than if they had never enrolled at all 47. Assessing a college's true value requires treating higher education like a major capital investment. This means looking past campus amenities and institutional prestige to calculate precise ROI, understanding the critical difference between sticker and net prices, properly evaluating debt-to-income ratios, and navigating the sweeping federal student loan changes recently introduced by the federal government.
Decoding the College ROI Formula
Return on investment (ROI) is the standard metric used by economists and labor market analysts to determine the financial value of a degree 7. Several leading policy organizations, including the Foundation for Research on Equal Opportunity (FREOPP), the Georgetown University Center on Education and the Workforce (CEW), and the Bipartisan Policy Center (BPC), have built complex, data-driven models to quantify this exact figure 17.
While their specific methodological formulas vary - with some focusing on institution-level outcomes and others drilling down to specific programs of study - a robust ROI calculation generally combines four core elements 1810:
1. Realized Earnings
This represents the total amount a graduate with a specific credential can expect to earn over the course of their lifetime 810. Calculating this involves tracking early-career wages and projecting them across a 30- to 40-year career horizon, adjusting for inflation and average wage growth within that specific industry 711.
2. Counterfactual Earnings (Opportunity Cost)
To understand what a degree actually adds to a person's wealth, researchers cannot just look at a graduate's total salary; they must subtract what that person would have made anyway 8. Counterfactual earnings represent the amount the same student would have earned over their lifetime had they not pursued the credential 10.
Different models handle this differently. The BPC calculates counterfactual earnings simply by looking at the median earnings for high school graduates 1. FREOPP's model is more nuanced, estimating counterfactual earnings based on demographics, student characteristics, and the specific opportunity cost of sitting in a classroom 1. Crucially, opportunity cost includes the income a student sacrifices by studying instead of working full-time during their years of enrollment 410. The opportunity cost of a four-year degree is not just the tuition paid; it is the four years of missed full-time wages and missed compound interest on early investments 12.
3. The True Cost of Education
The ROI calculation subtracts the amount the student spends on tuition, required fees, books, and equipment 810. Importantly, rigorous ROI models do not include living expenses such as rent, room and board, and food 810. This is because a human being must pay for the basic costs of food and shelter regardless of whether they are enrolled in college or working in the labor force 810. Furthermore, ROI calculations must use the "net price" of tuition - the cost after all federal, state, local, and institutional grant aid is applied - rather than the published sticker price 8.
4. Completion Risk (The Dropout Penalty)
The biggest hidden variable in college ROI - and the one most frequently ignored by optimistic high school students - is the dropout rate. Many students calculate their future financial prospects assuming they will graduate in four years 510. However, the financial penalty for dropping out is severe: the student absorbs the high cost of college and the burden of debt without receiving the lifetime earnings premium of the degree 4.
When FREOPP modeled the ROI for students who graduate on time, the median bachelor's degree showed a net financial value of $306,000 5. However, when adjusting the model to account for the statistical risk of dropping out, the expected value of that same median degree plummeted to between $129,000 and $160,000 45. FREOPP researchers calculate this by creating a weighted average. For example, if a college has an 87% four-year graduation rate, a 7% five-year graduation rate, a 1% six-year graduation rate, and a 5% dropout rate, the ROI is adjusted proportionally to those outcomes 10. For dropouts, the ROI of a median bachelor's degree is a devastating negative $99,000 to negative $100,000 45. Therefore, if a college has a low on-time graduation rate, its financial value as an investment is severely compromised, no matter how high the salaries are for the few who make it to the finish line 4.
What You Study Trumps Where You Study
When evaluating whether a college is a good financial value, data consistently shows that the field of study (the major) explains far more of the variation in lifetime earnings than the prestige of the institution itself 14.
While attending an elite, highly selective university does provide access to premium job markets and influential alumni networks, it is not a golden ticket. In fact, some degrees from Ivy League institutions still result in a negative ROI 5. A comprehensive analysis of nearly 30,000 bachelor's degree programs reveals that differences in ROI between specific majors can amount to millions of dollars 5.
Degrees rooted in quantitative analysis, technology, and healthcare consistently yield the highest returns. Engineering degrees have the highest median payoff, sitting at roughly $949,000 in net lifetime value 4. Four in five engineering programs across the country offer an ROI above $500,000 5. Other consistently high-value majors include computer science (median ROI of $652,000), nursing ($619,000), and economics ($549,000) 4. Financially, the single best program in the nation is the computer science major at the California Institute of Technology, where graduates can expect a lifetime ROI of over $4.4 million 5.
Conversely, majors that do not translate directly into high-paying, specialized fields carry tremendous financial risk. Over a quarter of all bachelor's degree programs (roughly 28%) have a negative return on investment, meaning students will be financially worse off for having participated in them compared to if they had never gone to college 5. Bachelor's degrees in fields like fine arts (including music and drama), psychology, education, and religion frequently offer zero or negative net financial value 45. For example, while 80% of engineering programs beat the $500,000 ROI mark, the same is true for just 1% of psychology programs 5.
However, the intersection of major and institution can still produce outliers. While fine arts is generally a low-ROI field nationally, the specific fine arts program at California Polytechnic State University yields an impressive ROI of $785,000 due to high starting salaries and regional demand 4. Similarly, the business program at the University of Virginia boasts an ROI exceeding $3 million, even though 13% of business programs nationally have a negative ROI 4.
A Note on Graduate Degrees
The assumption that more education automatically equals more money is deeply flawed. Recent ROI analyses reveal that nearly half of all master's degree programs leave students financially worse off 49. Many common master's degrees fail to generate a sufficient wage premium to justify the additional tuition and time out of the workforce. The notable exceptions are professional degrees in law, medicine, and dentistry, which remain extremely lucrative and frequently provide returns well in excess of $1 million 49.
Sticker Price vs. Net Price
When calculating whether a college is affordable, one of the most common and damaging mistakes families make is looking exclusively at the "sticker price."
By law, universities are required to publish their Cost of Attendance (COA), which includes tuition, mandatory fees, room and board, books, supplies, and estimated personal and transportation expenses 1011. This publicly reported amount is colloquially known as the sticker price 10.
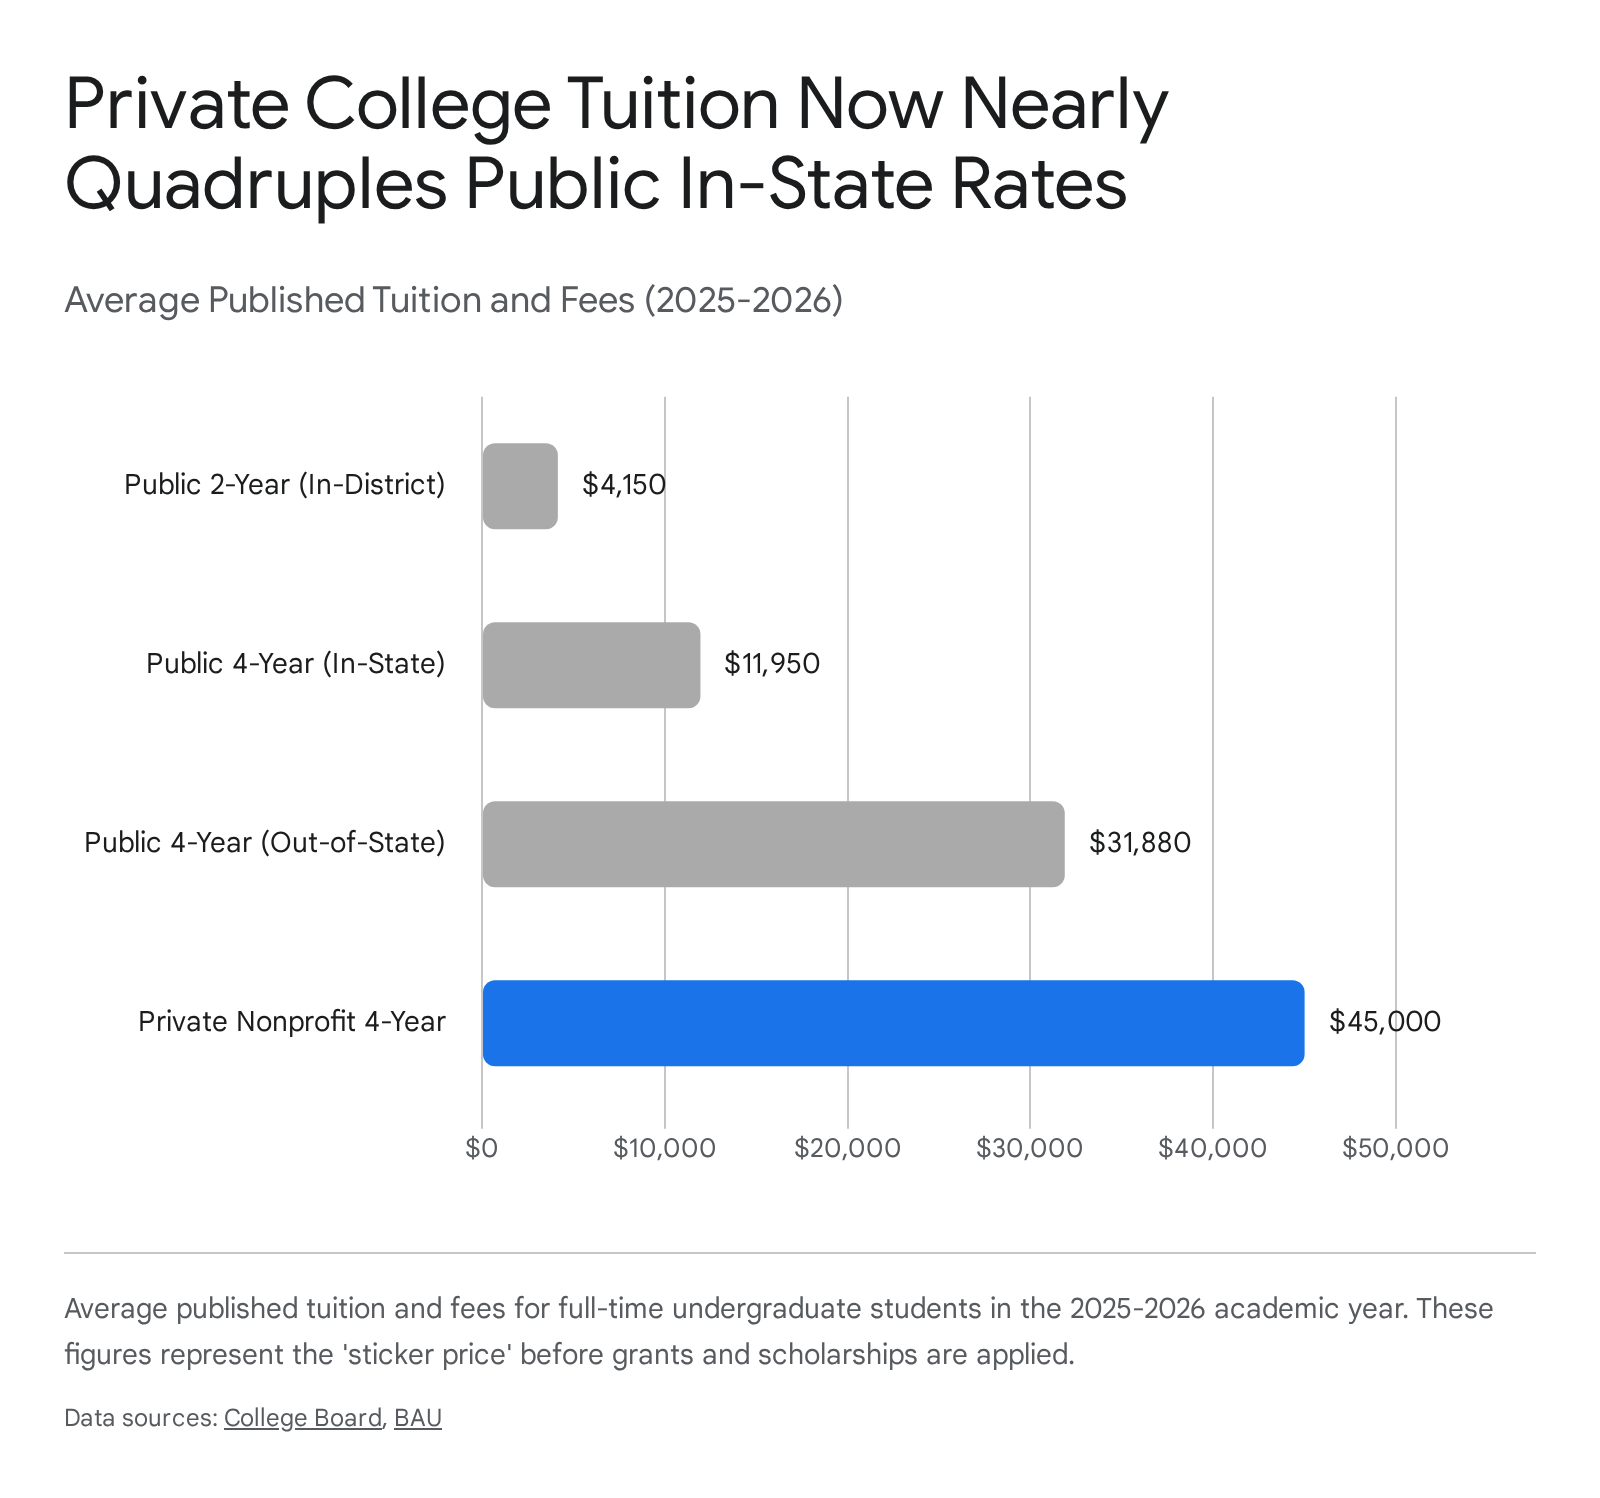
While the sticker prices outlined above are intimidating, very few students actually pay them 10. Financial aid drives a massive wedge between the published COA and reality. The number that actually matters for determining college value is the net price - the total cost of attendance minus any "gift aid" (grants and scholarships that do not need to be repaid) 10.
Historically, the sticker price has become an increasingly poor indicator of actual college costs, regardless of a family's income level 10. In the 2019-2020 academic year, only 26% of in-state public college students and a mere 16% of private nonprofit students paid the sticker price 10. This represents a massive drop from 1995-1996, when 53% and 29% of students, respectively, paid full price 10.
To remain competitive with lower-priced public flagship universities, private colleges frequently engage in aggressive "institutional discounting." By the 2022-2023 academic year, private nonprofit schools were discounting tuition for first-year students by an average of more than 56.2% 1617. Consequently, a high-priced private school with a massive endowment that offers generous need-based or merit-based aid can sometimes be cheaper out-of-pocket than a supposedly "affordable" out-of-state public university that offers no financial aid 17.
Navigating the Federal College Scorecard
To find the true net price and historical outcomes of a specific college, prospective students should rely on the U.S. Department of Education's College Scorecard 1819.
Launched by the federal government in 2015 to provide unprecedented transparency into higher education outcomes, the Scorecard integrates data from four primary federal sources: the Integrated Postsecondary Education Data System (IPEDS), the National Student Loan Data System (NSLDS), the Common Data Set, and, most importantly, IRS tax records 182012.
Before the Scorecard, post-graduation earnings data relied heavily on self-reported surveys conducted by colleges or private ranking magazines. These surveys suffered from low response rates and severe self-selection bias (as successful graduates are far more likely to respond to a survey than unemployed ones) 18. By directly linking federal student aid records with Treasury and IRS tax data, the Scorecard provides objective, comprehensive earnings data for the vast majority of graduates, effectively eliminating self-reporting bias 1812.
When evaluating a college's value on the Scorecard, families should focus on three critical outcome-based metrics:
- Completion Rates: Look for the percentage of students who graduate within 150% of the normal time (which is six years for a bachelor's degree) 18. The national average for a six-year graduation rate is roughly 60% 20. If a school's rate is significantly lower than this benchmark, the financial risk of enrollment is exceptionally high.
- Average Annual Cost (Net Price): The Scorecard breaks down the average annual cost paid by students after grants and scholarships, categorized by family income bracket 1820. This allows you to estimate what a family in your specific tax bracket typically pays out-of-pocket, providing a much more accurate picture than the sticker price.
- Median Earnings by Major: The tool shows the actual IRS-reported median earnings of graduates 6 and 10 years after initially enrolling 1820. Crucially, the Scorecard allows you to filter these salaries by specific fields of study, proving visually that a biology degree and an education degree from the exact same institution yield vastly different financial realities 2012.
Note on limitations: While incredibly powerful, the Scorecard only tracks students who received federal financial aid (Pell Grants or federal loans) 1213. This covers about 70% of students nationwide, though the Department of Education suggests that students receiving federal aid generally mirror the outcomes of those who do not, aside from baseline family income 12.
Evaluating Debt: The Golden Rules of Borrowing
Even a high-ROI degree can transform into a crippling financial burden if a student over-borrows to obtain it. To determine if a specific college's cost is a safe investment, economists and financial advisors rely on strict debt-to-earnings benchmarks.
The golden rule of thumb in student finance is that your total student loan debt at graduation should never exceed your expected first-year salary 141525.
For example, if you are pursuing a degree in marketing and expect to earn a starting salary of $50,000 in your first job, your total student loan debt at graduation (including capitalized interest and loan fees) should be capped at $45,000 to $50,000 15.
This ratio is not arbitrary; it is mathematically designed to keep monthly student loan payments manageable. Standard financial budgeting guidelines dictate that your total monthly debt obligations - including student loans, car payments, and credit card minimums - should not exceed 36% of your gross monthly income 15. By keeping total student debt at or below your starting salary, your standard 10-year loan repayment will equal roughly 8% to 12% of your gross monthly income, allowing you to stay safely within that 36% overall debt threshold 2516.
Borrowing more than a single year's salary easily pushes a graduate past that threshold. Taking on excessive debt relative to income creates a negative ripple effect throughout a graduate's life, resulting in delayed milestones, an inability to save for a mortgage or retirement, and heavy psychological stress 1115. Furthermore, high debt restricts career flexibility, often forcing graduates to abandon fulfilling lower-paying careers (like teaching or social work) in favor of high-stress corporate jobs simply to service their loan payments 15.
Federal Benchmarks for Debt
Historically, the Department of Education has looked at similar metrics to determine institutional accountability. Under previous "gainful employment" standards, a program's debt-to-earnings ratio was considered "passing" if the estimated annual loan payments required 8% or less of the median graduate's annual earnings, and "failing" if the ratio exceeded 8% 27. Data analyzed from the College Scorecard indicates that while median debt-to-earnings ratios have ticked downward slightly for bachelor's and master's degrees in recent cohorts, wide swaths of higher education - including many private colleges and HBCUs - still struggle to meet this basic affordability benchmark 2717.
The Rise of the Trades: Certificates vs. 4-Year Degrees
Rising university tuition, ballooning student debt, and a well-documented national shortage of skilled trades workers have aggressively shifted the ROI conversation toward vocational and technical training 218. In 2026, trade schools have moved from a fallback option to a highly strategic first choice for students prioritizing financial freedom 18.
When analyzing short-term value (the first 10 to 20 years of a career), trade schools, certificate programs, and associate's degrees consistently outperform traditional four-year colleges 2719. This early-career dominance is driven by three variables:
- Drastically Lower Initial Cost: A four-year degree at a public in-state university averages roughly $120,000 over four years (including tuition, fees, room, and board) 12. In stark contrast, the average trade program in 2026 costs between $5,000 and $33,000 total, resulting in minimal or zero education debt 1219.
- The Speed-to-Income Advantage: Trade programs typically take 6 to 24 months to complete 12. While a university student is sitting in a lecture hall during their third year accumulating interest on loans, a trade school graduate is already 20 years old and earning a full-time salary 121819. Over a four-year period, a young HVAC technician earning $50,000 annually has already accumulated $200,000 in gross earnings before their high school peers have even received a bachelor's diploma 18. That head start on saving and investing compounds massively over decades 12.
- High Regional Demand and Surging Wages: Bureau of Labor Statistics (BLS) data projecting workforce needs from 2024 through 2034 shows structural shortages in skilled labor, driving up wages significantly 1820. Heavy and tractor-trailer truck drivers are projected to see 237,600 openings annually 20. Elevator installers, radiation therapists, and experienced HVAC technicians specializing in smart building systems regularly earn median wages between $90,000 and $107,000 1218.
The Importance of Time Horizons
However, time horizons matter deeply in the ROI calculation. While trades offer a powerful sprint out of the gate, bachelor's degrees represent a long-term marathon.
Data from the Georgetown University Center on Education and the Workforce (CEW) indicates that while certificates and associate's degrees boast a superior median ROI at the 10-year, 15-year, and 20-year marks, bachelor's degrees eventually overtake them 7. By the 40-year horizon, 81% of institutions that predominantly offer bachelor's degrees sit in the top ROI decile, compared to just 11% of certificate-granting institutions 721. This is because bachelor's degrees tend to offer a higher ceiling for late-career wage growth, opening doors to management, executive roles, and specialized fields that are structurally closed to workers without a four-year credential 733.
Comparing Expected Financial Trajectories
| Credential Type | Typical Duration | Average Tuition Profile | Short-Term ROI (10 Years) | Long-Term ROI (40 Years) |
|---|---|---|---|---|
| Trade Certificate | 6 - 24 months | $5,000 - $33,000 total | Very High (Rapid workforce entry, low debt) | Low to Moderate (Slower peak wage growth) |
| Associate's Degree | 2 years | $4,150 / year | High | Moderate |
| Bachelor's Degree | 4 - 6 years | $11,950 / year (Public) | Moderate (Delayed entry, higher initial debt) | Very High (Steeper wage compounding ceiling) |
Public, Private, and For-Profit Colleges: A Sector Divide
Not all institutions are created equal when it comes to long-term financial value. The sector and tax status of the college plays a massive role in expected outcomes, debt accumulation, and post-graduate security.
Public Institutions
Generally, in-state public universities offer the highest, most consistent return on investment 1134. Because their operations are heavily subsidized by state and local governments (averaging $11,680 in state funding per student in 2023-24), they feature vastly lower sticker prices for residents 22. Consequently, students at public universities borrow less on average, leading to a faster payoff period 1116. At the 40-year career horizon, the median ROI for a public bachelor's degree-granting institution is nearly $1.8 million ($1,794,000) 723. Third Way's Price-to-Earnings Premium (PEP) model shows that students at 85% of public and private non-profit colleges can recoup their net tuition costs within 10 years 34.
Private Nonprofit Institutions
Private nonprofits have much higher tuitions, and their students typically borrow more than twice the amount of public university students 1624. However, the ROI of private colleges is highly stratified. Elite private colleges (such as the Ivy League, Caltech, Stanford, and MIT) boast some of the highest ROIs in the nation - with top-tier degrees generating net values exceeding $2 million to $4 million - due to their powerful endowments, exclusive alumni networks, and direct pipelines to top-paying industries 516. However, mid-tier and lower-tier private colleges often struggle to justify their premium prices. If a private college cannot offer aggressive financial aid discounting to offset its high tuition, the resulting student debt drastically erodes the degree's ROI 41638.
Private For-Profit Institutions
Academic research and federal data universally advise extreme caution regarding for-profit colleges. Operated as businesses and beholden to investors and shareholders, these institutions rely heavily on federal student aid (Pell Grants and loans) to drive revenue, but they consistently yield the worst outcomes for students 3825.
Studies comparing individuals before and after enrollment show that for-profit attendees experience lower earnings gains than public sector students (earning roughly $2,100 less per year than their public peers) and are 1.5 percentage points less likely to be employed at all 25. In fact, the earnings gains for for-profit students are often no better than the wage growth of high school graduates with no college education 25. Furthermore, they take on significantly more debt and default on their loans at much higher rates 25. A Third Way analysis found that a staggering 45% of private for-profit colleges leave students struggling to recoup their educational costs even 26 years after enrollment, rendering the degree a negative financial asset 34.
Reading the Fine Print: Comparing Financial Aid Offers
If a student has been accepted to multiple colleges, the ultimate test of value occurs in the spring when comparing financial aid offers. These letters are notoriously confusing, largely because there is no federal mandate requiring universities to use a standardized format or transparent terminology 1140.
Some colleges present a massive "total aid package" that intentionally blurs the line between free money and money you must repay 4026. One school might show a total aid package of $34,000 that secretly includes $18,000 in high-interest loans, while another might offer $22,000 that is entirely grant money. The first number looks bigger, but it costs the family significantly more 40.
To calculate the true value of an offer, families must manually strip the package down to its core components 4026:
- Calculate the True Cost of Attendance (COA): Look for a breakdown of both direct costs (money paid directly to the school, like tuition, fees, and on-campus housing) and indirect costs (estimates for books, off-campus rent, travel, and personal expenses) 1126. A commuter school with high parking fees or a cross-country college requiring expensive holiday flights will have higher indirect costs 11.
- Subtract ONLY the "Gift Aid": Subtract federal Pell grants, state grants, and institutional merit or need-based scholarships. This is free money you keep and never have to repay 4026. (Note: Your eligibility for need-based aid is determined by your Student Aid Index, or SAI, which recently replaced the Expected Family Contribution (EFC) on the FAFSA) 11.
- Isolate the True Net Price: Total COA minus Gift Aid equals your actual cost. Do not subtract student loans or Federal Work-Study from this number. Federal loans (whether subsidized or unsubsidized) are a financial obligation that will accrue interest, not a discount 1140. Work-Study is simply the opportunity to work a part-time minimum-wage job on campus to earn a paycheck; it does not reduce your tuition bill directly 40.
- Watch for Predatory Packaging: Some financial aid offices artificially inflate their offers by including Parent PLUS loans or private credit-based loans in the "award" section to make it look like 100% of the cost is covered. These are highly risky financing mechanisms, not student aid 26.
Once you determine the true net price for each school, project that amount over four (or realistically, five) years to see if the total required borrowing falls safely below your expected first-year salary 40.
How the 2026 Student Loan Overhaul Changes the Math
Calculating college ROI has become even more complex due to sweeping federal student loan overhauls taking effect in 2026. Stemming from the "One Big Beautiful Bill Act" (OBBBA), these massive reforms to the federal student aid system officially trigger on July 1, 2026, fundamentally altering how students borrow, how much they can borrow, and how they repay debt 3272829.
The End of Unlimited Graduate Borrowing
Previously, the federal Grad PLUS loan program allowed graduate and professional students to borrow up to the full cost of attendance, regardless of the amount. This blank-check system insulated universities from market forces, incentivizing them to raise tuition aggressively. The result was a 343% surge in graduate debt since 2005, outpacing wage growth and severely damaging the ROI of many master's programs 30.
Under the 2026 OBBBA rules, the Grad PLUS program is entirely eliminated for new borrowers 2830. Instead, borrowing is strictly capped to force universities to compete on affordability 2830:
2026 OBBBA Federal Loan Borrowing Limits
| Borrower Category | New Annual Limit | New Lifetime Limit | Notes |
|---|---|---|---|
| Graduate Students | $20,500 | $100,000 | Includes Master's, Nursing, and Public Health programs 28. |
| Professional Students | $50,000 | $200,000 | Restricted to Medical, Law, Dental, and Veterinary fields 28. |
| Parents (PLUS Loans) | $20,000 per child | $65,000 per child | Parents taking these loans no longer qualify for Public Service Loan Forgiveness (PSLF) 2728. |
These hard caps force students to evaluate the ROI of graduate degrees and out-of-state bachelor's programs with intense scrutiny. Any tuition costs that exceed these federal limits must now be covered out-of-pocket, through savings, or via riskier, high-interest private bank loans that lack federal protections 30. (Note: Students who received a Direct Loan disbursement before July 1, 2026, and remain in the same program are grandfathered into the legacy Grad PLUS system for up to three years) 30.
The New Repayment Assistance Plan (RAP)
For loans disbursed after July 1, 2026, the confusing web of older income-driven repayment plans (like PAYE, ICR, and the SAVE plan) is being phased out 272829. New borrowers will only have two options: the traditional Standard Repayment Plan (fixed monthly payments over 10 to 25 years) or the new Repayment Assistance Plan (RAP) 2829.
RAP is an income-driven model that ties monthly payments directly to a borrower's Adjusted Gross Income (AGI) 2829. Borrowers earning under $10,000 pay a flat $10 a month. Those earning between $10,000 and $20,000 pay 1% of their income, scaling up to a maximum cap of 10% for those earning $100,000 or more 2829.
Crucially, RAP eliminates negative amortization. Under older plans, if a borrower's required income-based payment was lower than the monthly interest generated by the loan, their total balance would actually grow every month. Under RAP, if a borrower makes their on-time payment, the government subsidizes the remaining interest and pays up to $50 of the principal, ensuring the loan balance shrinks 328. However, there is a catch: the forgiveness timeline on RAP is stretched. Borrowers must make qualifying payments for 30 years before any remaining balance is forgiven, a stark increase from the 20- or 25-year timelines of older plans 28.
The Creation of Workforce Pell Grants
The 2026 OBBBA reforms also radically improve the financial accessibility and value of short-term vocational training 314732. Historically, federal Pell Grants (money for low-income students that does not need to be repaid) could only be used for traditional, longer-term degree and certificate programs.
Starting in July 2026, the new Workforce Pell Grants program allows eligible students to use federal grant money (up to the maximum $7,395 annual cap) to pay for short-term, intensive credential courses lasting just 8 to 15 weeks (150 to 599 clock hours) 3147. This allows low-income students to enter high-demand fields like information technology, skilled trades, and healthcare without taking on any student debt 3147.
To protect taxpayers and students from predatory programs, the federal government placed strict accountability guardrails on Workforce Pell eligibility. Programs must be approved by state governors and workforce boards based on regional labor demands 3249. Furthermore, these short-term programs must prove a minimum 70% job placement rate and pass a strict Value-Added Earnings (VAE) test 3149. The VAE test ensures that the tuition charged by the program does not exceed the financial value it creates for the student (specifically, the median earnings of the program's graduates minus 150% of the federal poverty level must exceed the program's tuition and fees) 3149. If programs fail to hit the 70% placement or VAE metrics, they lose Workforce Pell eligibility for at least two years 49.
Uniquely, the rules for Workforce Pell offer a lifeline to university graduates who chose low-ROI majors. Unlike standard Pell rules, students who already hold a bachelor's degree but are struggling in the labor market are eligible to use Workforce Pell grants to rapidly retrain and pivot into high-demand technical careers 4733.
Bottom line
A college is only a good financial value if the expected lifetime earnings of your specific major comfortably outweigh your true net out-of-pocket costs and the statistical risk of dropping out before completion. While four-year bachelor's degrees tend to offer the highest long-term wage ceilings over a 40-year career, trade schools and short-term certificate programs provide a massive early-career advantage by rapidly putting graduates into high-demand jobs with little to no debt. To ensure financial stability, always limit your projected total borrowing so it does not exceed your expected first-year salary, strip away deceptive loans from financial aid award letters, and rely on federal College Scorecard data - not institutional marketing - to verify a program's graduation rates and alumni earnings.