How to Evaluate a College's ROI and Career Outcomes
To reliably evaluate the return on investment of a college education, prospective students and policymakers must prioritize field of study over institutional prestige, utilizing federal administrative data to calculate the net present value of specific degree programs. True economic evaluation demands analyzing long-term earnings premiums against total out-of-pocket costs, opportunity costs, and debt servicing requirements, rather than relying on the frequently flawed and self-reported job placement rates published directly by universities.
For generations, the pursuit of a higher education credential has been viewed as the most reliable escalator to the middle class - a virtually guaranteed mechanism for upward social and economic mobility. Grounded in this historically accurate belief, attending college has become the second-largest financial investment most families will make in their lifetimes, surpassed only by the purchase of a home. Yet, unlike purchasing a home or allocating capital into equities, where appraisals, interest rates, and market comparables dictate the transaction, the decision of where to attend college is frequently driven by emotion, familial legacy, and institutional "brand name." This information asymmetry, coupled with the aggressive marketing of prestige by universities, often leads students to make choices devoid of empirical economic backing. The consequences of making a higher education decision based on campus aesthetics or a generalized institutional ranking, rather than rigorous financial data, can be catastrophic. Students frequently find themselves trapped in a cycle of underemployment, leading to decades of crippling, non-dischargeable student debt 1. As the aggregate student loan deficit in the United States eclipses the trillion-dollar mark, the necessity of evaluating higher education as a rigorous financial investment - one requiring a demonstrable and predictable return - has never been more urgent 1.
How Do We Actually Measure the Financial Value of a Degree?
Historically, the value of a college degree was measured primarily in abstract and qualitative terms: the development of critical thinking skills, the expansion of civic engagement, and the cultivation of a well-rounded citizenry. While these intangible benefits remain vital components of the higher education ecosystem, the rapidly accelerating cost of tuition demands a strictly quantitative analysis of the economic returns.
To achieve this, education economists rely on Net Present Value (NPV), a standard corporate finance metric adapted to evaluate human capital investment. In the context of higher education, NPV estimates the current value of an educational investment by calculating the present value of the lifetime incremental earnings that college provides, minus the full costs of attendance 24. These costs include not only the net price of tuition, mandatory fees, books, and supplies, but also the critical metric of opportunity cost - the wages a student forfeits by sitting in a classroom instead of working full-time in the labor market during the years of their enrollment 25. Because capital acquired in the future is fundamentally worth less than capital held today, these future cash flows must be discounted back to the present. Calculations based on recent tuition rates and data on earnings by education indicate that, utilizing a standard discount rate of approximately 4 percent, the NPV of a college investment is currently estimated around $480,000 for men and $342,000 for women 26.
Prominent independent think tanks, including the Georgetown University Center on Education and the Workforce (CEW) and the Foundation for Research on Equal Opportunity (FREOPP), have pioneered the application of NPV and Return on Investment (ROI) to higher education. These organizations utilize comprehensive, tax-linked data from the U.S. Department of Education's College Scorecard to bypass institutional marketing claims 734. The CEW methodology is particularly notable for calculating ROI across multiple time horizons - specifically at intervals of 10, 15, 20, 30, and 40 years following initial enrollment - revealing a highly dynamic trajectory of degree valuation 4.
In the short term, specifically the 10-year horizon, public institutions that predominantly grant sub-baccalaureate credentials, such as vocational certificates and associate's degrees, consistently demonstrate a higher ROI than traditional four-year bachelor's programs 567. The median 10-year ROI for public certificate-granting institutions sits at approximately $233,000, and $232,000 for associate's degrees, which easily surpasses the $174,000 median for public bachelor's degree institutions 6. This early economic advantage is driven by the substantially lower cost of attendance and the rapid entry into the workforce. Graduates of these programs require fewer years to complete their education - often one to two years compared to the assumed five years for a modern bachelor's degree - allowing them to begin accruing earnings while traditional four-year students are still accumulating debt and forfeiting wages 46.
However, when expanding the economic models to a 40-year horizon, the data demonstrates a clear inversion. The earnings premium of a bachelor's degree compounds significantly over a lifetime, allowing the long-term ROI of four-year institutions - particularly private, non-profit colleges - to vastly outpace sub-baccalaureate degrees 5713. The median 40-year ROI for a public bachelor's degree reaches nearly $1.8 million, compared to $1.43 million for associate's degrees and $1.37 million for certificates 6. This divergence indicates that while short-term, technically focused credentials provide an immediate economic floor and rapid payback periods, a bachelor's degree remains the most stable path toward a high-ceiling financial future - provided the specific degree program is chosen correctly 6.
Does Your Major Matter More Than the College?
One of the most pervasive and financially destructive misconceptions in higher education is the belief that institutional prestige guarantees a high financial return on investment. The prevailing cultural narrative suggests that admission to a highly selective, elite university acts as a universal shield against underemployment and financial hardship, regardless of what the student actually studies. Comprehensive economic data collected from 2023 onward comprehensively debunks this myth: what a student studies is vastly more determinative of their financial future than where they study.
According to an exhaustive 2024 analysis published by FREOPP, which evaluated 53,000 specific degree and certificate programs, an astonishing 23 percent of all bachelor's degree programs in the United States have a negative return on investment 148. This indicates that nearly one-quarter of college graduates would have accumulated more wealth over their lifetimes if they had never attended their chosen program and simply entered the workforce with a high school diploma, completely avoiding tuition costs and foregone earnings 14. Furthermore, nearly half of all master's degree programs leave students financially worse off, largely due to exorbitant tuition costs combined with un-subsidized federal loan interest that do not translate into corresponding bumps in mid-career earning power 789.
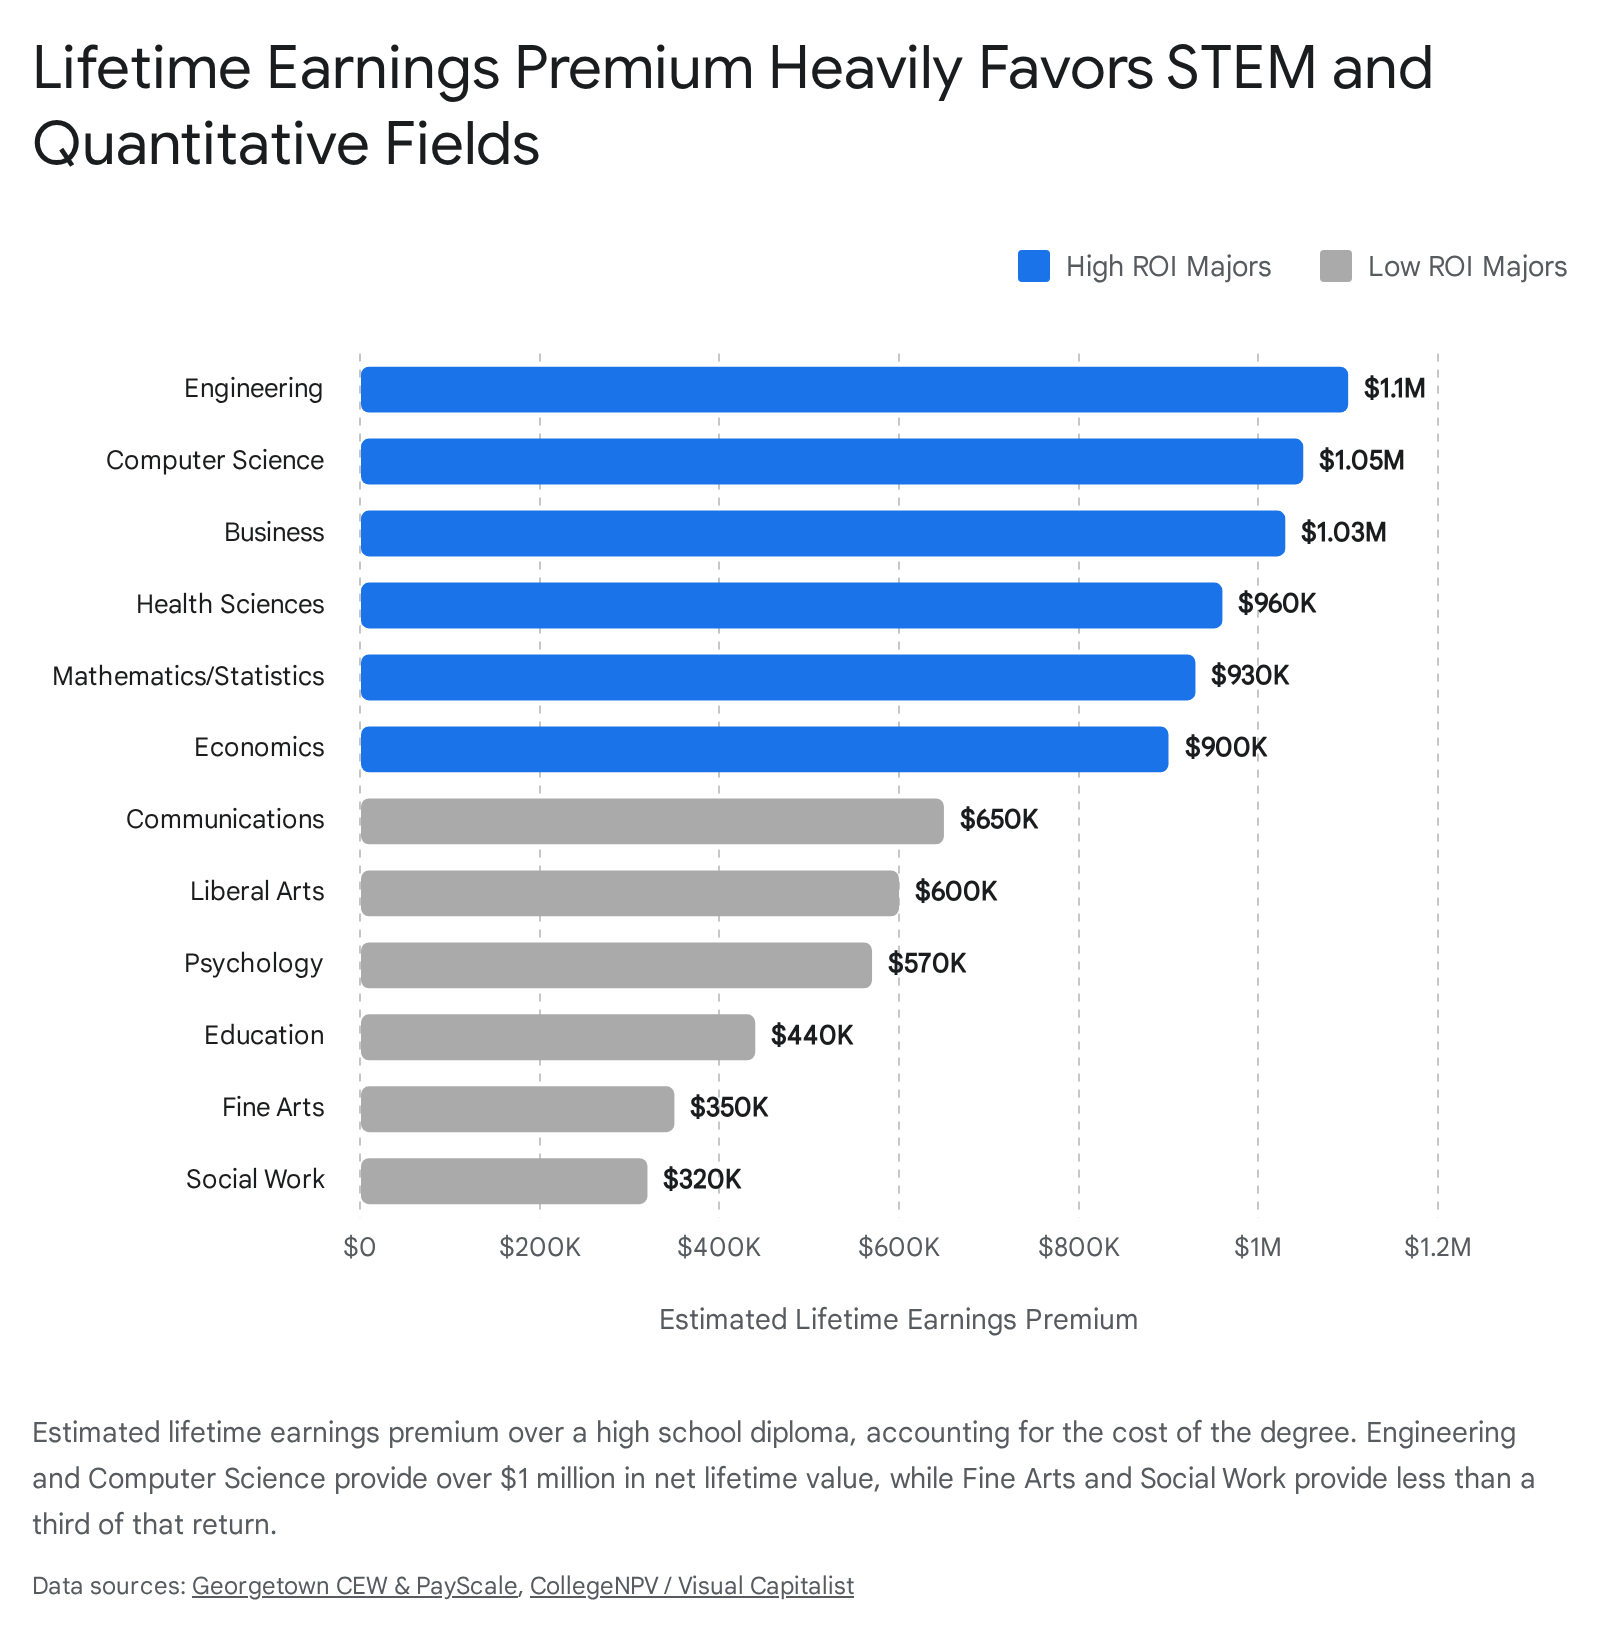
The variation in ROI is primarily driven by the chosen field of study. STEM (Science, Technology, Engineering, and Mathematics) disciplines, alongside highly specialized fields like nursing and economics, dominate the highest echelons of value creation. Bachelor's degree programs in engineering and computer science consistently yield a net present value of $500,000 to well over $1 million, while degrees in fine arts, education, English literature, and psychology routinely generate marginal, zero, or completely negative financial returns 7817.
To illustrate how the choice of major supersedes the impact of the institutional brand, one must only look at programmatic outcomes within the exact same highly ranked university. At the University of California, Berkeley - one of the most prestigious public universities in the world - the lifetime ROI for business majors and chemical engineers sits at a highly lucrative $1.52 million and $1.06 million, respectively 18. However, within the exact same institution, graduates who majored in anthropology and classical/ancient studies face a negative lifetime ROI of -$57,987 and -$238,293, respectively 18. Similarly, at New York University, an institution known for high tuition and limited need-based aid, finance majors see a lifetime ROI of $1.9 million, while the university's dance and music majors endure catastrophic lifetime ROIs of negative $571,110 and negative $610,941, respectively 18.
The data unequivocally proves that a computer science or nursing graduate from a regional state university will, on average, easily out-earn a fine arts graduate from an Ivy League institution over the course of their career 1920. For example, workers with an associate's degree in nursing from Santa Rosa Junior College in California routinely earn more in their first year after graduation than graduate degree holders from certain humanities programs at Harvard University 19. The disparity is driven by structural realities in the macroeconomic labor market: technical and quantitative fields produce higher salary floors, rapid wage growth, and consistent labor market demand 1720. STEM graduates at public universities typically recover their tuition costs within two to four years 17. Conversely, non-STEM graduates at expensive private institutions may require 8 to 15 years simply to break even, assuming they are able to secure employment in a relevant field at all 17.
What is a Good Debt-to-Earnings Ratio?
Understanding raw earnings potential is only half of the ROI equation; analyzing how student debt restricts those earnings in the crucial first decade of a graduate's career is equally important. A widely accepted financial rule of thumb dictates that students should not borrow more for a bachelor's degree than they expect to earn in their first full year post-graduation - effectively advising a debt-to-earnings ratio that does not exceed 1.0 1. When the debt-to-earnings ratio climbs above 1.0, graduates face severe liquidity crises, as their earnings are insufficient to cover standard living expenses alongside aggressive loan amortization.
Data compiled by the Brookings Institution reveals the heavy burden placed on recent graduates when this ratio is ignored. Today, roughly 70 percent of American bachelor's graduates leave school with debt, with typical balances for those who borrow ranging from $30,000 to $40,000 110. While a college degree undoubtedly provides an earnings premium over a high school diploma, the absolute necessity of servicing debt during a graduate's lowest-earning years creates severe economic friction. The Brookings analysis demonstrates that the average graduate sacrifices roughly 23 percent of their early-career college earnings premium just to service their student loans 11.
The debt burden varies dramatically depending on the degree level obtained. Graduates with an associate's degree generally dedicate only about 9 percent of their earnings premium to debt repayment, while bachelor's degree holders spend 19 percent 11. Master's degree holders - who frequently accumulate high levels of federal grad PLUS loans, which have higher interest rates and no aggregate borrowing limits - surrender a staggering 57 percent of their earnings premium to debt servicing, rendering a significant portion of master's programs financially toxic 11.
When analyzing the debt burden by field of study under a standard 10-year loan amortization plan, the discrepancies become immense. The standard 10-year repayment plan requires the heaviest payments early in a career when wages are lowest. Graduates who borrowed for degrees in drama and theater arts routinely face initial loan payments consuming up to 24 percent of their gross earnings in their first year of repayment 10. In stark contrast, graduates in energy and extraction engineering, who benefit from much higher starting salaries, face initial repayment burdens of only 7 percent of their earnings 10.
To systematically determine whether an institution is leaving its students in a financially sustainable position, the U.S. Department of Education has historically utilized a Gainful Employment framework. Under these federal standards, an academic program is deemed to be failing if the annual loan payment of its median graduate exceeds 12 percent of their total earnings (or 8 percent for discretionary income) 12. Programs that fail this metric risk losing access to Title IV federal student aid, effectively shutting them down 12. While the advent of modern Income-Driven Repayment (IDR) plans, and newer frameworks like the Repayment Assistance Plan (RAP), have provided a safety net against formal default by capping monthly payments between 1 percent and 10 percent of adjusted gross income, these programs extend the repayment timeline out to 20 or 30 years 11. Relying heavily on an IDR plan to survive financially post-graduation is fundamentally an admission that the degree did not generate the necessary cash flow to justify its upfront capital cost on a standard timeline.
Can You Trust a University's Job Placement Rate?
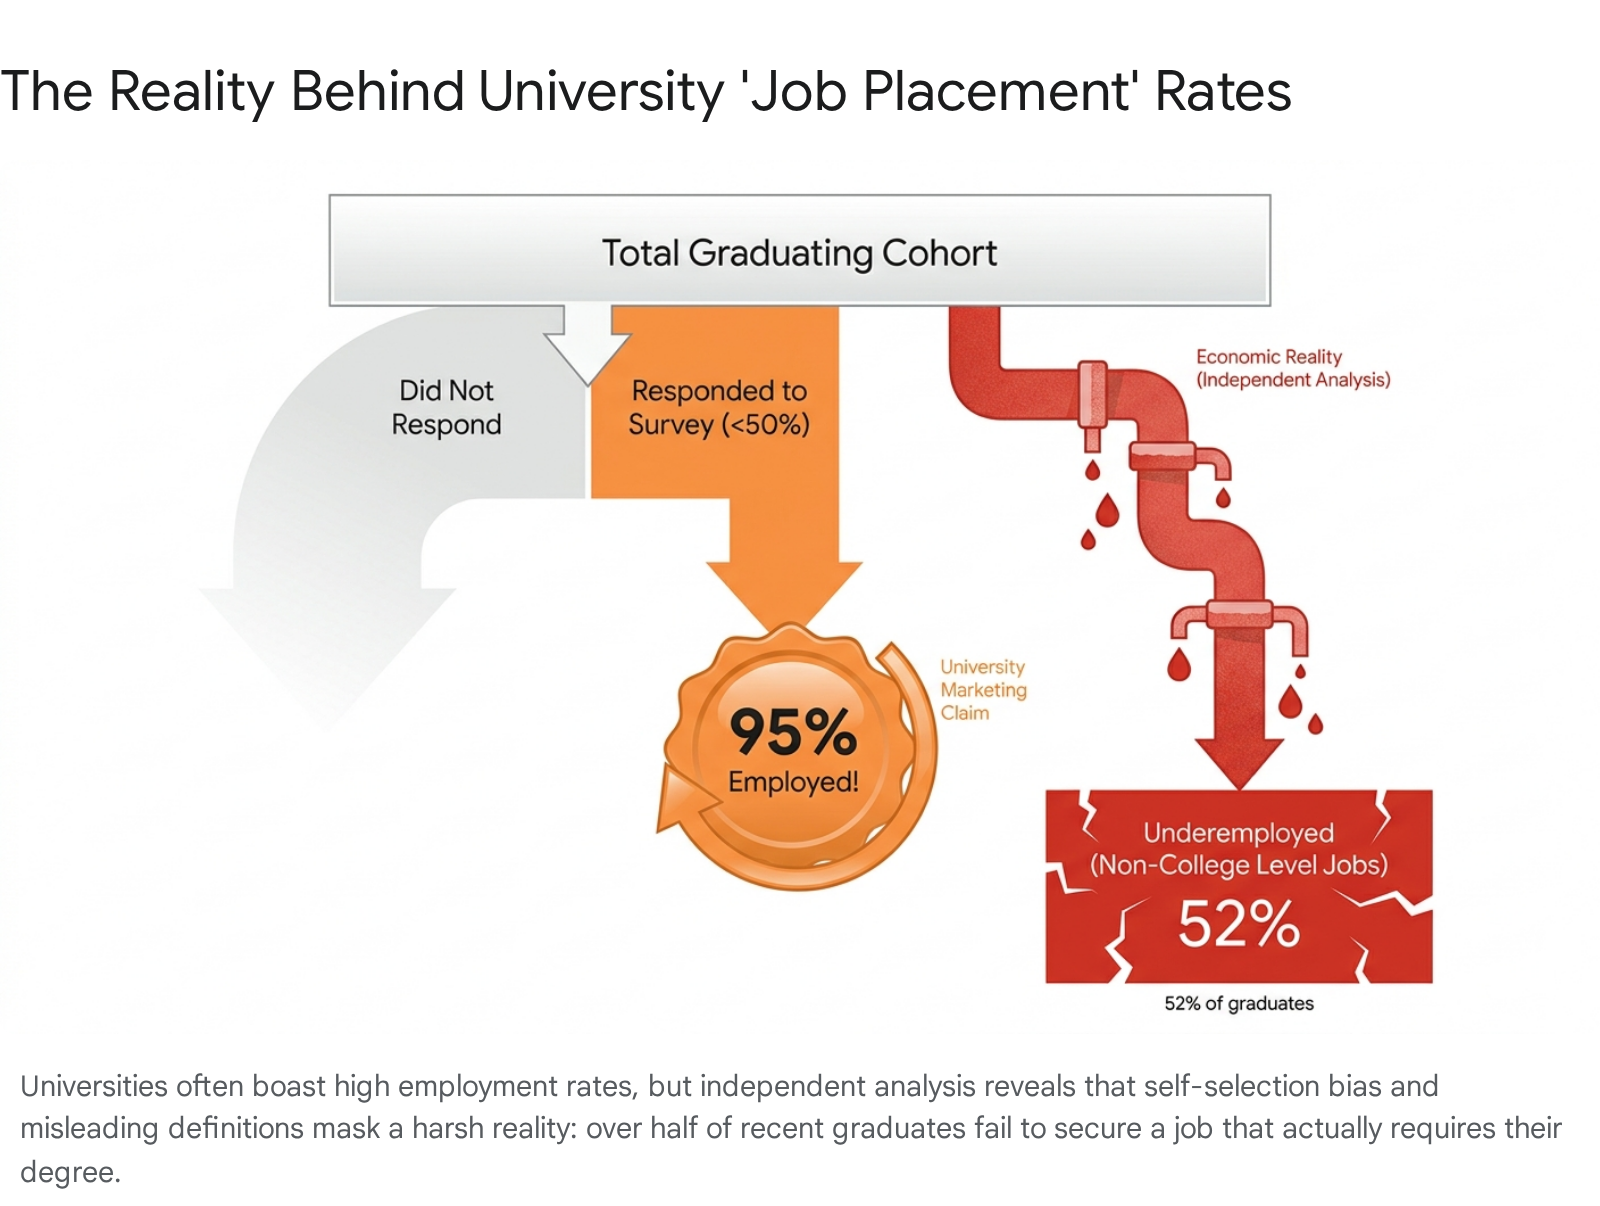
When prospective students attempt to evaluate post-graduate outcomes, they frequently turn to the "Job Placement Rates" or "First-Destination Surveys" published in glossy university marketing brochures and on admissions websites. These figures routinely claim that 90 to 95 percent of an institution's graduates are "employed or enrolled in graduate school within six months of graduation." These statistics should be treated with extreme skepticism, as they are frequently riddled with methodological flaws, severe selection bias, and highly misleading definitions of what constitutes employment 13.
First, the primary data collection methodology utilized by university career centers is fundamentally broken. The Collegiate Employment Research Institute notes that poor, inaccurate data collection is an endemic problem across the higher education sector 13. Universities rely almost entirely on self-reported surveys sent to new alumni, and the response rates for these queries are notoriously low. In many instances, an institution's published placement rates are based on survey responses from less than half of the graduating class 13. The inherent flaw here is survivorship bias: graduates who are unemployed, struggling to find work, or working minimum-wage service jobs are far less likely to respond to a voluntary alumni survey than a graduate who just secured a prestigious, high-paying position at a top-tier firm. The resulting data is heavily skewed upward, presenting a polished illusion that does not reflect the reality of the entire cohort.
Second, universities frequently conflate "employed" with "gainfully employed in a relevant, degree-requiring field." If a student graduates with a $200,000 degree in biochemistry and subsequently takes a part-time, minimum-wage position as a retail barista because they cannot find laboratory work, the university's First-Destination survey technically counts that student as a "successful placement" because they are technically employed 13. Very few institutions rigorously distinguish between full-time, college-level employment and part-time survival labor in their marketing materials.
Investigative reporting and massive macro-data analyses conducted by independent think tanks reveal the true, unvarnished landscape of the graduate labor market. Utilizing a combination of online career histories spanning tens of millions of graduates alongside census microdata, the Burning Glass Institute and the Strada Education Foundation have accurately mapped the reality of postgraduate outcomes 141516. Their comprehensive research demonstrates that 52 percent of bachelor's degree graduates are "underemployed" one year after graduation - meaning they are working in a job where a four-year degree is not typically necessary 1416.
The optimistic belief that underemployment is merely a temporary, post-graduate stepping stone is also empirically false. The longitudinal data paints a deeply troubling picture of long-term career stagnation: ten years after graduation, the vast majority of those who started their careers underemployed remain trapped in non-college-level jobs 16. These persistently underemployed graduates face massive salary penalties, earning roughly $40,000 a year 16. This figure is only modestly better than what workers with just a high school diploma earn, and it is vastly lower than the $60,000 average earned by their peers who successfully secured college-level employment right out of the gate 16.
This phenomenon highlights the broader macroeconomic issue of degree inflation, where employers increasingly demand bachelor's degrees for middle-skill jobs that historically did not require them 1416. While there has been recent corporate posturing regarding a shift toward "skills-based hiring" - with firms publicly dropping degree requirements from job listings - the Burning Glass Institute notes that actual hiring practices have barely moved, with the hiring of non-degree workers increasing by a mere 3.5 percentage points in those roles 1416. Consequently, as the labor market tightens and automation and artificial intelligence disrupt entry-level knowledge work, recent graduating classes face almost unparalleled challenges. Reports covering the Class of 2026 indicate that despite unprecedented efforts by students to secure internships and attend career fairs, successful job offer rates have steadily declined from previous years, reinforcing the necessity of relying on independent federal tax and wage data rather than university marketing materials to forecast outcomes 1718.
Are We Prioritizing Wealth or True Economic Mobility?
While raw ROI metrics, Net Present Value models, and median salary outcomes are vital for individual decision-making, macroeconomic researchers are increasingly urging a structural shift in focus from absolute wealth generation to true "economic mobility." A highly selective, elite college that enrolls exclusively wealthy students and outputs wealthy graduates may boast incredibly high median salary outcomes, but it accomplishes very little in terms of societal advancement or reducing economic inequality.
To capture the true socio-economic utility of higher education, researchers at Opportunity Insights (led by economist Raj Chetty at Harvard University), the Brookings Institution, and the think tank Third Way have pioneered new evaluation frameworks, most notably the Economic Mobility Index (EMI) 19202122. Distinct from traditional, prestige-based rankings (such as U.S. News & World Report, which historically over-weighted alumni giving and exclusionary acceptance rates), the EMI seeks to highlight institutions that are fulfilling higher education's fundamental democratic promise: lifting students from the lowest socioeconomic quintiles into the middle and upper classes 192034.
The EMI achieves this by altering the underlying mathematics of success. Researchers first calculate a Price-to-Earnings Premium (PEP) specifically for low-income students - defined as those from families earning $30,000 or less annually 20. This metric determines exactly how long it takes these specific disadvantaged students to recoup the net cost of their degree based on their post-graduation earnings boost. Crucially, the index then takes that performance percentile and multiplies it by the percentage of Pell Grant recipients the institution actually enrolls 20. This methodology intentionally penalizes elite, highly selective universities that generate high salaries but act as walled gardens, admitting only a minute fraction of low-income applicants. Conversely, it rewards schools that are actually doing the heavy lifting of educating the working class.
The findings of the 2023 Economic Mobility Index are highly illuminating and disrupt traditional hierarchies. The institutions unambiguously delivering the strongest economic mobility outcomes (Tier 1) are not the Ivy League, but rather broad-access public regional universities and Minority-Serving Institutions (MSIs) 20. Over one-third of the schools in the top 20 percent of the EMI are Hispanic-Serving Institutions (HSIs), alongside several Historically Black Colleges and Universities (HBCUs) 20. Institutions located in California, New York, and Texas dominate the upper echelons. Specifically, the California State University (CSU) system and the City University of New York (CUNY) system serve as the nation's premier engines for economic mobility 1920. By offering low tuition costs, enrolling massive cohorts of high-financial-need students, and providing rapid ROI through highly localized workforce pipelines, these regional public universities punch vastly above their weight class. They prove empirically that an institution does not need billions of dollars in endowment funds or single-digit acceptance rates to profoundly alter a student's economic trajectory 620.
How Do Global Data Systems Track Post-Graduate Outcomes?
The shift toward data-driven, objective evaluation of higher education ROI is not strictly an American phenomenon; it is a global imperative. Recognizing the fundamental flaws of self-reported university surveys and the necessity for accurate labor market forecasting, governments worldwide have begun leveraging state administrative data to accurately track post-graduate outcomes. This provides an important international context for how higher education value should be measured.
The United Kingdom (LEO Data): The United Kingdom has established the Longitudinal Education Outcomes (LEO) dataset, which is widely considered a gold standard in tracking post-graduate financial outcomes. Unlike voluntary alumni surveys, LEO operates as a relational database that links education data directly from the Department for Education (DfE) with administrative tax and benefits data from His Majesty's Revenue and Customs (HMRC) and the Department for Work and Pensions (DWP) 232437. By utilizing National Insurance numbers, LEO systematically tracks the employment status and exact earnings of approximately 39 million individuals at one, three, five, and ten years post-graduation 232425. This comprehensive, cohort-based approach allows researchers to precisely measure the early-career earnings impact of specific undergraduate degrees. Most importantly, it allows economists to control for confounding variables such as socioeconomic background, ethnicity, and prior academic attainment (GCSE results), thereby isolating the true "value added" by the university and entirely bypassing institutional reporting bias 2437.
Australia (QILT): In Australia, the federal government funds the Quality Indicators for Learning and Teaching (QILT) suite, which includes the Graduate Outcomes Survey (GOS) and its longitudinal counterpart (GOS-L) 2627. Administered by the Social Research Centre, QILT measures short-term outcomes (four to six months after course completion) and medium-term outcomes (three years post-completion) 2627. The 2024 QILT data highlights critical nuances in the labor market, such as how economic tightness disproportionately impacts international graduates compared to domestic graduates 28. Furthermore, QILT rigorously tracks the critical metric of "underutilization" or underemployment - specifically tracking the percentage of graduates working part-time who prefer to work more hours, noting that while underemployment peaks immediately after graduation, it tends to narrow significantly over the medium term 2627.
Canada (PSIS): Canada utilizes the Postsecondary Student Information System (PSIS), a highly detailed national survey administered by Statistics Canada 29. While PSIS focuses heavily on providing granular, macro-level information regarding enrollments, demographic characteristics, and graduation rates across public postsecondary institutions (categorized by the standard Classification of Instructional Programs, or CIP codes), it is increasingly being integrated with other national administrative data sets 293031. For example, by linking PSIS data with the Non-permanent Resident File (NPRF), Canada can accurately track the flow of international students, their specific fields of study, and their subsequent integration into the Canadian labor market 31.
In the United States, the equivalent mechanism is the U.S. Department of Education's College Scorecard. Launched fully in 2015, the Scorecard matches student enrollment records from the National Student Loan Data System (NSLDS) with de-identified tax records from the Department of the Treasury to produce median earnings data 3246. While incredibly powerful for analyzing cohorts, it has historical limitations, primarily that it only tracks outcomes for students who utilized federal financial assistance (Title IV aid), potentially skewing data at elite institutions with highly affluent populations who pay tuition entirely out-of-pocket 3233.
Where is the Data Coming From? A Comparison of Sources
To successfully navigate the conflicting claims of university marketing departments and economic realities, analysts, prospective students, and policymakers must intimately understand the strengths and biases inherent in the different higher education datasets available.
| Data Source | Primary Mechanism | Strengths | Limitations & Biases | Best Use Case |
|---|---|---|---|---|
| U.S. College Scorecard | Links U.S. Department of Education loan records (NSLDS) directly with IRS tax data. | Highly accurate, objective salary data at the 10-year mark. Entirely immune to self-selection survey bias 324633. | Only tracks students who received federal aid. System-level reporting can sometimes obscure data for specific branch campuses 3233. | Comparing long-term median earnings and debt metrics across different academic majors and institutions. |
| University First-Destination Surveys | Self-reported alumni questionnaires administered by individual university career centers. | Captures immediate post-grad plans, including specific graduate school enrollments and exact corporate job titles 13. | Extreme self-selection bias. Notoriously low response rates. Frequently equates non-degree-requiring employment with "successful placement" 13. | Reviewing specific employers who recruit on campus; should not be trusted for average salary expectations or ROI. |
| Independent Think Tanks (e.g., FREOPP, Georgetown CEW) | Synthesizes federal Scorecard data into advanced economic models (NPV, ROI over 10 to 40 years). | Adjusts for completion rates and opportunity costs. Translates raw, abstract data into lifetime financial trajectories and actionable metrics 748. | Requires complex assumptions regarding long-term wage growth and standard discount rates that may not apply uniformly across all economic cycles 448. | Evaluating the absolute financial worth of a specific degree and major combination over a lifetime. |
| Third-Party Rankings (e.g., U.S. News & World Report) | Proprietary algorithms weighting academic reputation, graduation rates, and social mobility. | Provides a holistic, weighted score that factors in peer reputation, faculty resources, and institutional environment 34. | Methodologies change annually. Historically over-weighted prestige and wealth inputs; subject to data manipulation by universities 34. | Assessing overall institutional resources, generalized academic prestige, and social mobility initiatives. |
| Self-Reported Platforms (e.g., PayScale) | Crowdsourced salary data from alumni actively utilizing the platform's compensation tools. | Excellent coverage for mid-career salaries; captures affluent students who did not receive federal aid 33. | Subject to self-selection bias (individuals seeking salary negotiation tools may inherently earn more or less than the true median) 33. | Benchmarking mid-career salaries in specific corporate sectors or geographic regions. |
A Practical Framework for Prospective Students and Parents
Translating complex macroeconomic concepts like Net Present Value and Economic Mobility Indexes into kitchen-table decision-making is essential for prospective students and their parents. When comparing two or more college acceptance letters, families must pivot away from evaluating campus amenities, dormitories, or athletic prestige, and focus on the cold math of human capital investment. The following practical framework, derived from rigorous economic principles, provides an actionable, step-by-step methodology for evaluating college ROI 4549.
Step 1: Calculate the True "Net Price," Not the Sticker Price The advertised tuition rate is largely irrelevant. Utilizing federal Net Price Calculators and the specific financial aid award letters provided by the institution, isolate the total out-of-pocket cost per year. Crucially, subtract only "gift aid" - such as Pell Grants, institutional merit scholarships, and state grants - from the total cost of attendance (which includes tuition, mandatory fees, room, and board). Do not subtract federal or private student loans from the cost, as loans are simply deferred payments that will accrue interest 42050. Multiply this annual net price by the expected time to completion. To be conservative, assume 4.5 to 5 years for a standard bachelor's degree, as four-year graduation rates are declining nationally 451.
Step 2: Assess the Counterfactual (The Opportunity Cost) College is not just the explicit cost of tuition; it is the implicit cost of lost time in the labor market. Estimate the baseline salary the student could reasonably earn if they entered the workforce immediately after high school graduation (e.g., a full-time minimum wage, entry-level retail, or trade apprenticeship position). Multiply this annual figure by the years expected to be spent in college. This sum represents the opportunity cost 245. A college degree is only a mathematically sound investment if the future earnings premium it provides significantly exceeds this baseline figure plus the net tuition paid 4.
Step 3: Forecast Realistic Early-Career Earnings by Specific Major Do not use the university's generalized "average graduate salary" metric, which misleadingly blends high-earning STEM degrees with low-earning humanities degrees. Instead, utilize the U.S. Department of Education College Scorecard or Georgetown CEW data tools to find the median starting salary for the specific major at the specific institution being considered 3. For example, evaluate the specific salary outcomes for a mechanical engineering degree at University A versus a mechanical engineering degree at University B.
Step 4: Run the 10-Year Debt Amortization Stress Test Calculate the total anticipated student loan burden upon graduation, factoring in likely interest accrual. Apply a standard 10-year repayment schedule to determine the projected monthly payment 1012. Compare this monthly obligation against the projected monthly take-home pay of the specific major calculated in Step 3. If the projected loan payments exceed 10 to 12 percent of the graduate's gross starting salary, the investment is entering highly hazardous territory, mimicking the failure thresholds of federal Gainful Employment standards 112. If the overall debt-to-earnings ratio exceeds 1.0 (meaning total accumulated debt is higher than the projected first-year salary), alternative educational pathways must be prioritized, such as completing general education requirements at a community college before transferring to a four-year institution 117.
Step 5: Evaluate the Structural "Underemployment" Risk Finally, assess the labor market reality of the chosen field. Does the desired career path strictly require a specialized, licensed bachelor's degree (e.g., Nursing, Civil Engineering, Accounting), or is it a generalized degree highly susceptible to the 52 percent underemployment trap identified by the Burning Glass Institute 16? In an economic era increasingly pivoting toward skills-based hiring for middle-skill jobs, the ROI of a degree without a direct, specialized occupational pipeline is rapidly diminishing 1416.
Bottom line
The cultural narrative that any college degree from a prestigious institution guarantees lifetime financial security is an outdated relic of a less expensive macroeconomic era. Today, higher education must be scrutinized with the exact same rigor and skepticism applied to any major capital or real estate investment. By understanding that the specific field of study is the paramount driver of wealth generation, utilizing independent, tax-linked data sources to verify institutional claims, and rigorously applying Net Present Value calculations to minimize debt burdens, students and families can navigate the higher education marketplace safely. Ultimately, the true value of a college degree is not found on a diploma's letterhead, but in its proven, mathematical capacity to sustainably elevate a graduate's economic trajectory without saddling them with unmanageable debt.