The Everyday Hook: Why Algorithmic AI Trends Matter
The proliferation of artificial intelligence in financial forecasting is not merely an abstract academic exercise confined to university laboratories; it is a structural transformation that directly impacts global liquidity, pension funds, and the viability of individual retail investments. Automated systems and algorithms currently execute between 60% and 75% of all United States equity trades, while an estimated 85% of foreign exchange trading volume is algorithmically driven 1. This saturation dictates that when a retail investor executes a manual trade on a brokerage application, the counterparty is statistically likely to be a high-frequency machine.
For the average market participant with no background in coding or quantitative finance, understanding how these underlying algorithms function - and precisely where they fail - is a critical defensive mechanism. Institutional adoption of AI has entirely reshaped how the market moves, how liquidity evaporates or floods around macroeconomic news events, and why prices sometimes react in ways that feel disconnected from traditional economic fundamentals 12. Furthermore, the financial technology sector is aggressively marketing consumer-facing automated trading bots that promise exorbitant returns using sophisticated buzzwords like "neural networks," "agentic AI," and "quantum algorithms" 34. Understanding the stark mathematical realities and limitations behind these systems is the only reliable defense against deceptive marketing and the pervasive illusion of autonomous, risk-free wealth generation 4.
Can AI Really Predict Stock Prices?
The fundamental question governing quantitative finance is whether financial time-series data contains deterministic signals that can be reliably harvested, or if market movements represent a purely random walk. Artificial intelligence models, particularly deep neural networks, operate on the mathematical assumption that hidden patterns exist within vast datasets. However, the exact nature of these patterns dictates the ultimate theoretical limits of algorithmic prediction.
The Illusion of Perfect Prediction: Sine Waves vs. Chaotic Systems
A critical and widespread misconception regarding AI forecasting is the assumption that deep learning models can predict financial markets with the same deterministic precision they apply to natural physical phenomena. Predicting a mathematical sine wave, a repeating mechanical pattern, or a controlled physical system like orbital mechanics is a trivial task for an LSTM. A sine wave is deterministic, perfectly stationary, and cyclically flawless. Once the neural network calculates the amplitude and frequency during its training phase, it can forecast the wave infinitely into the future with near-zero error because the underlying rules generating the data never change.
The stock market, conversely, is a chaotic, highly efficient system. Chaos theory provides the foundational mathematical framework for understanding why perfect, long-term market prediction remains a persistent illusion 51. At its core, a chaotic system is deterministic - meaning it follows rules governed by human behavioral economics, institutional liquidity flows, and global macroeconomic forces - but it exhibits extreme "sensitive dependence on initial conditions" 512.
This phenomenon, popularized by mathematician Edward Lorenz in 1961 as the "Butterfly Effect," dictates that an infinitesimally small change in the starting state of a complex system can lead to vastly different, unpredictable outcomes over time 1. Lorenz discovered that a microscopic rounding error of just one part in a million in his computer models completely altered simulated long-term weather patterns 1. Financial markets exhibit this exact fractal, strange-attractor behavior, driven primarily by unpredictable human emotion and sudden external shocks 18. A single social media post by a prominent chief executive, an unexpected inflation print deviating by a fraction of a percent, or a localized geopolitical event can trigger cascading liquidity sweeps that instantly invalidate an AI model's deterministic projections 1. The mathematician Benoit Mandelbrot famously observed that a mere 20% of inputs are responsible for the vast majority of extreme financial market behavior, meaning that the most critical drivers of price are inherently the least predictable 1.
Therefore, if financial markets are chaotic, they are not purely random - which opens a narrow window for short-term, probabilistic predictability 51. However, long-term forecasting remains mathematically impossible due to instability and the system's exponential sensitivity to minor initial discrepancies 5. Advanced academic frameworks, such as the CMG (Chaos-Markov-Gaussian) Framework, attempt to navigate this reality by using chaos theory to map non-linear dynamics, Markov chains to detect abrupt market regime shifts, and Gaussian processes to quantify strict probabilistic uncertainty 5. Yet, even these state-of-the-art hybrid systems merely seek to establish a marginal statistical edge for risk management, explicitly rejecting the notion of clairvoyant prediction 5.
The Architecture of Memory: How LSTM Gates Process Information
To understand why AI models like Long Short-Term Memory (LSTM) networks are so heavily favored in financial forecasting despite market chaos, one must examine how they process sequential time. Traditional Recurrent Neural Networks (RNNs) suffer from a severe mathematical limitation known as "short-term memory" or the vanishing gradient problem 93. When processing long sequences of historical price data, standard RNNs rapidly lose the context of the beginning of the sequence by the time they reach the end, making them unsuitable for identifying long-range financial cycles 9. LSTMs, introduced by Hochreiter and Schmidhuber in 1997, were engineered specifically to solve this temporal degradation through an internal "cell state" and three regulatory "gates" 91112.
The complex mathematical mechanism of an LSTM can be understood through the accessible analogy of a human reader summarizing a dense, complicated book chapter: 1. The Forget Gate (Deciding what to erase): Imagine reading a lengthy historical chapter and realizing that a minor subplot introduced dozens of pages ago is completely irrelevant to the main narrative. The reader naturally discards this trivial information from their working memory to maintain focus. Mathematically, the LSTM's forget gate looks at the previous hidden state and the new market input, passing them through a sigmoid activation function that outputs a number strictly between 0 and 1 911. A value of '0' commands the network to "completely forget this historical noise," while a '1' means "retain this entirely" 11. In quantitative finance, this mechanism allows the model to continuously "forget" the baseline micro-volatility of yesterday when a massive, structural earnings shock occurs today. 2. The Input Gate (Taking crucial notes): As the reader progresses through the chapter, a major plot twist occurs. The reader immediately recognizes its importance, highlights the text, and commits the detail to their mental notepad. The LSTM's input gate functions identically; it determines which new, incoming market data (such as a sudden, anomalous volume spike) is significant enough to be mathematically written into the long-term cell state 911. It uses a hyperbolic tangent (tanh) function to create new candidate values between -1 and 1, scaling them by the input gate's sigmoid filter to precisely control the flow of new information 11. 3. The Output Gate (Delivering the summary): After finishing the chapter, the reader synthesizes their deep, long-term understanding of the characters with the short-term notes they just highlighted to provide a concise, accurate summary of what will likely happen next. The LSTM's output gate calculates the final hidden state for the current time step by combining the filtered long-term memory (the cell state) with the immediate market inputs, ultimately producing a directional forecast for the next sequence 911.
By independently reading, writing, and erasing content from their memory cells through these gates, LSTMs preserve signals over long temporal horizons, making them theoretically ideal for detecting complex, separated interdependencies in financial markets that traditional statistical models overlook 1314. Recent advancements have even extended this architecture. For instance, the sLSTM variant replaces the standard sigmoid function with exponential gating, allowing for a broader range of outputs and increased flexibility in dynamically revising stored memory when market conditions suddenly shift 15. Other permutations, such as the Grid LSTM and Wavelet-LSTM hybrids, incorporate multi-dimensional data processing and mathematical noise reduction to further stabilize the cell state against market turbulence 1316.
Why Do LSTM Models Look So Accurate on Paper?
If long-term market prediction is mathematically restricted by the principles of chaos theory, why do academic journals, amateur data science blogs, and commercial pitch decks routinely display deep learning models with 90% to 96% directional accuracy 41718? The discrepancy between theoretical brilliance and practical application stems from profound methodological flaws in how financial time-series data is evaluated.
The In-Sample vs. Out-of-Sample Trap
The most common and destructive illusion in machine learning for finance is the "In-Sample vs. Out-of-Sample Trap." Machine learning models are fundamentally trained on historical data (in-sample) and subsequently evaluated on unseen future data (out-of-sample). Neural networks, due to their vast parameter counts - often numbering in the hundreds of thousands or millions - possess an immense mathematical capacity to memorize datasets 4. When an LSTM is evaluated on in-sample data, or data structurally identical to its training set, it inevitably produces beautiful, upward-trending equity curves that appear exceptionally profitable 5.
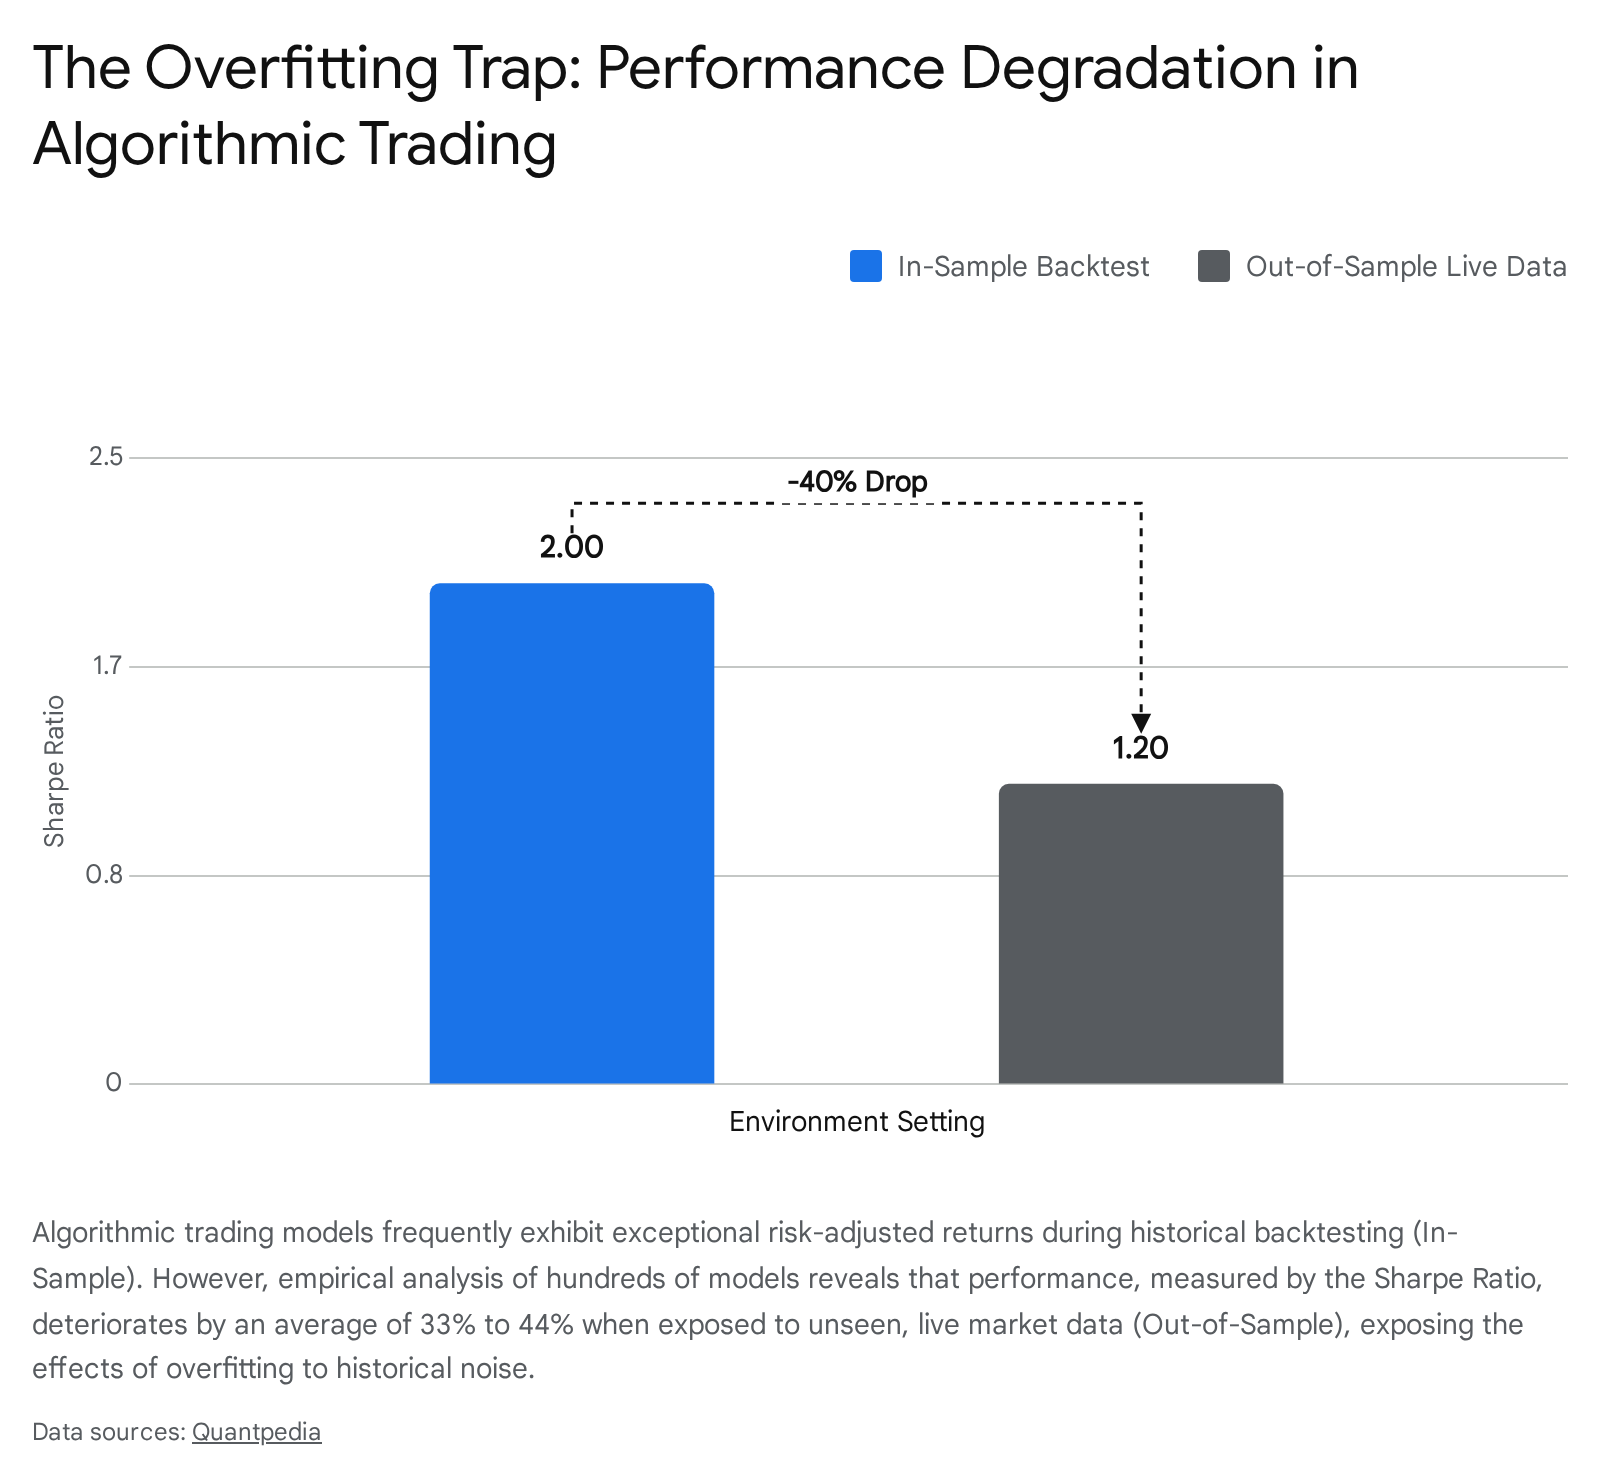
However, robust peer-reviewed studies reveal a severe, systemic degradation in performance when these over-parameterized models face true out-of-sample environments. A comprehensive empirical analysis evaluating 888 distinct algorithmic trading strategies across highly structured market regimes found that in-sample performance explains a mere 1% to 2% of out-of-sample behavior, yielding an $R^2$ correlation between 0.01 and 0.02 21. Furthermore, across published stock anomalies, the Sharpe ratio - a critical metric measuring risk-adjusted returns - deteriorates by an average of 33% to 44% the moment a model is moved from the pristine backtesting phase to the out-of-sample phase 6.
Other extensive reviews corroborate this phenomenon, demonstrating that portfolio returns derived from statistically significant historical variables drop by an average of 58% post-publication 6.
This trap occurs because the LSTM is not learning the underlying causal mechanics of the market; it is learning to perfectly fit historical noise. It maps the randomness of the past, critically mistaking temporary correlation for durable causation, resulting in a model that looks brilliant in hindsight but is entirely blind to the actual future 523. The more intense the backtesting and hyperparameter tuning, the wider the gap becomes between in-sample illusion and out-of-sample reality 21.
Data Leakage and the Look-Ahead Bias Illusion
Even more insidious than standard overfitting is the pervasive presence of "data leakage" and "look-ahead bias" in time-series validation pipelines. Data leakage occurs when future information unintentionally contaminates the training dataset, essentially providing the neural network with the answers to the test before the evaluation begins 5.
In LSTM sequence generation, a ubiquitous methodological flaw involves constructing input-output sequences before partitioning the dataset into distinct training and testing sets 24. Because LSTMs evaluate sliding windows of data (for example, analyzing a 60-day window to predict the price on day 61), improperly splitting the data after creating these overlapping sequences allows fragments of testing data to bleed backward into the training folds 24. Empirical studies systematically investigating this flaw demonstrate that evaluating LSTMs using standard 10-fold cross-validation under these "leaky" conditions artificially inflates the model's accuracy, resulting in Root Mean Square Error (RMSE) gains of up to 20.5% at extended lag steps compared to strictly separated, clean data 24.
Similarly, improper global data normalization injects catastrophic look-ahead bias. Analysts frequently scale an entire dataset using the global minimum and maximum prices over a decade before splitting the data chronologically 2526. Because the scaler applies linear extrapolation based on absolute future boundaries, the training data becomes mathematically infused with future price limits 25. When a model trained under these mathematically compromised conditions reports 94% or 96% accuracy on indices like the S&P 500 or NASDAQ 1718, it is not predicting the market; it is simply regurgitating the future data it illegally accessed during the preprocessing phase.
Why Do They Fail in Live Trading?
When quantitative researchers and retail traders transition these models from sanitized academic datasets into live market environments with real capital execution, the structural vulnerabilities of deep learning are violently exposed. LSTMs fail in live trading primarily due to persistent market non-stationarity, sudden regime shifts, and an overwhelmingly poor signal-to-noise ratio.
Market Non-Stationarity and Regime Shifts
Machine learning models, regardless of their depth, fundamentally rely on the assumption of statistical stationarity - the idea that the mathematical properties of a system, such as mean, variance, and autocorrelation, remain relatively constant over time. If an LSTM learns a pattern, it operates under the assumption that the pattern will hold. However, financial markets are strictly non-stationary 45. The underlying data generation process continuously mutates because macroeconomic conditions shift, central bank policies pivot, and aggregate participant behavior dynamically adapts 45.
A profound historical example of this occurred between 2011 and 2015 when the Swiss National Bank instituted a hard minimum exchange rate, capping the value of the Swiss Franc against the Euro 4. During this sustained four-year period, an LSTM trained on currency data would mathematically deduce that volatility is strictly capped and that the price inevitably mean-reverts at a specific ceiling. However, on January 15, 2015, the central bank abruptly and unexpectedly abandoned the policy 4. A model trained on the previous four years would fail catastrophically during this regime shift, as the underlying structural rules of the market were rewritten in a matter of seconds. Because deep neural networks function as opaque "black boxes" focused heavily on historical price geometries rather than fundamental macroeconomic context, they continue executing obsolete rules until the portfolio incurs devastating drawdowns 5.
Signal-to-Noise Ratios and Computational Reality
Financial data possesses a notoriously weak signal-to-noise ratio 5. Unlike natural language processing or image recognition - where a pixelated picture of a vehicle remains undeniably a vehicle - financial price movements are predominantly noise driven by algorithmic execution, retail flow, and micro-volatility 15.
Extracting genuine, actionable predictive signals from this chaotic noise requires vast computational resources and highly sophisticated data engineering that extends far beyond simple price inputs. Institutional models that actually achieve a statistical edge do so not with simple, off-the-shelf LSTM layers downloaded from amateur repositories, but with massive, proprietary ensemble architectures. For instance, institutional-grade predictive models often require dedicated clusters of 500 GPU nodes to process terabytes of high-frequency limit order book data, managing hundreds of thousands of parameters specifically tuned and constantly retrained for individual equities 4.
A consumer-grade LSTM trained on daily closing prices from standard APIs simply lacks the dimensionality, alternative data inputs, and computational horsepower required to identify genuine causal relationships 23. As a result, the model defaults to fitting randomness, leading to severe discrepancies between theoretical papers predicting 89% directional accuracy on emerging markets like the KSE-100 and the brutal reality of live capital deployment 16.
Comparing the Titans: ARIMA vs. LSTM vs. Transformers
To understand the current landscape of financial forecasting, one must analyze the evolution of the predictive models utilized by quantitative analysts. The field is broadly divided into classical statistical models (ARIMA), modern deep learning sequences (LSTM), and state-of-the-art attention mechanisms (Transformers and LLMs).
| Feature | ARIMA (Classical Statistics) | LSTM (Deep Learning) | Transformers / LLMs (Modern AI) |
|---|---|---|---|
| Core Architecture | Autoregressive moving average of past lagged errors 27. | Recurrent neural network with internal memory gates (Forget/Input/Output) 911. | Encoder-decoder architecture utilizing self-attention mechanisms 729. |
| Data Assumptions | Assumes linear relationships. Requires strict data stationarity (mean/variance stability) 2730. | Excels at non-linear dependencies. Can process complex, volatile sequences 3031. | Highly flexible, capable of reasoning across multi-modal data (prices plus textual sentiment) 3233. |
| Memory Capabilities | Limited strictly to explicitly defined short-term lags 27. | Captures long-term sequential dependencies but still suffers gradient loss over extreme lengths 93. | Global context. The attention mechanism allows equal, simultaneous access to all past data points 734. |
| Live-Market Efficacy | Strong baseline for short-term, stable periods. Demolished by sudden volatility and long horizons 303135. | Often outperforms ARIMA in directional accuracy, but highly vulnerable to regime shifts, noise, and overfitting 5318. | Exhibits superior capability to integrate macroeconomic news with prices, though struggles to extract alpha from raw numeric noise 293237. |
| Complexity & Cost | Low. Highly interpretable, mathematically transparent, and computationally cheap 3538. | High. Requires extensive hyperparameter tuning, scaling protocols, and significant GPU resources 531. | Extreme. Massive parameter counts requiring vast infrastructure; highly susceptible to data leakage 429. |
The Statistical Baseline: ARIMA
The Autoregressive Integrated Moving Average (ARIMA) model has served as the foundational baseline for time-series forecasting for decades. It is highly interpretable, easily implemented, and excels at modeling short-term trends in stationary environments 32735. However, ARIMA fundamentally relies on strict linear assumptions 2730. Because it cannot capture the intricate, non-linear feedback loops and asymmetric volatility clusters characteristic of modern algorithmic financial markets, it routinely underperforms deep learning models over longer forecasting horizons 3189. In comparative walk-forward validations predicting multi-day index prices, ARIMA's rigid structure frequently results in substantially higher Mean Absolute Percentage Errors (MAPE) compared to dynamic neural networks 1011.
The Deep Learning Standard: LSTM
LSTMs overtook ARIMA by recognizing that financial data is inherently non-linear and chaotic. By utilizing their sophisticated tripartite gating mechanisms, LSTMs can dynamically separate short-term market noise from long-term structural trends. Extensive comparative studies continuously highlight LSTM's superiority over ARIMA in environments with pronounced temporal dependencies 73135. For example, studies applying walk-forward validation on the S&P 500 spanning 24 years demonstrated LSTMs reducing prediction errors (RMSE and MAE) by 82% to 84% compared to ARIMA baselines 10. Similarly, analysis of the Moroccan Stock Exchange found LSTMs achieving remarkable $R^2$ scores exceeding 0.95, heavily outpacing traditional linear models 7.
However, the tradeoff for this accuracy is severe opacity. LSTMs are mathematically dense black boxes that require massive, perfectly curated datasets to optimize properly 35. To mitigate their weaknesses, researchers must continuously build hybrid structures. Examples include combining LSTMs with Graph Neural Networks (GNNs) to capture complex inter-stock relational data, or integrating Wavelet denoising algorithms to artificially smooth chaotic price signals before they enter the neural network 16424344. Even cutting-edge iterations like Quantum LSTMs (QLSTM), which leverage quantum computing principles to manage feature complexity, still face the fundamental barrier that historical correlation does not guarantee future execution 4546.
Recent Developments (2023+): Are Transformers and LLMs Displacing LSTMs?
As of 2024 to 2026, the artificial intelligence paradigm has shifted dramatically toward Transformer architectures and Large Language Models (LLMs). Originally designed for natural language processing tasks - such as translation and text generation - the Transformer's core innovation is the "self-attention mechanism" 2937. Unlike LSTMs, which must process data strictly sequentially step-by-step, self-attention allows the model to analyze all data points in a sequence simultaneously, drawing direct global dependencies across vast timeframes 734. This monumental success in NLP prompted intense academic and institutional interest in adapting Transformers for financial time-series forecasting 123747.
The Bifurcation of Forecasting: Multimodal Reasoning vs. Numeric Prediction
The immediate question is whether Transformers are rendering LSTMs obsolete in finance. The empirical answer is highly nuanced. If the forecasting task involves predicting strictly absolute numeric price sequences or analyzing high-frequency limit order book data, Transformers have not outright displaced LSTMs. Rigorous comparative analyses conducted between 2023 and 2025 indicate that Transformer-based models exhibit only a marginal 10% to 25% reduction in prediction error over LSTMs when predicting absolute prices, which is frequently insufficient to generate a reliable trading edge 123747. Furthermore, LSTMs consistently demonstrate superior and more robust performance when predicting differential sequences, such as mid-price movement and immediate market volatility 123747. The raw, noisy, purely numeric data of the stock market does not inherently benefit from linguistic attention mechanisms in the exact same way human language does 34.
However, where LLMs and Transformers are unequivocally disrupting the forecasting space is in "multimodal reasoning" - the integration of quantitative price data with qualitative macroeconomic context. State-of-the-art foundation models like Time-LLM, Chronos, and instruction-tuned variants of Open-LLaMA attempt to bridge the contextual gap that historically caused LSTMs to fail during regime shifts 29323334.
By utilizing LLMs, analysts can feed the model not just arrays of historical closing prices, but corresponding financial news articles, corporate earnings transcripts, supply chain disruptions, and central bank policy announcements 3233. This grants the LLM the ability to perform cross-sequence reasoning. When a sudden regime shift occurs - such as an unannounced interest rate hike or a geopolitical conflict - a pure LSTM fails because its historical price data contains no precedent for the sudden drop. An LLM, conversely, can parse the central bank's textual announcement, cross-reference it with historical inflation reactions embedded in its vast pre-trained knowledge base, and apply zero-shot inference to adjust the quantitative price forecast accordingly 3233.
Therefore, rather than a pure displacement, the quantitative industry is witnessing a structural bifurcation: LSTMs remain highly effective and computationally efficient for isolated, high-frequency quantitative pattern recognition, while LLMs and Transformers are rapidly becoming the required standard for macro-level, sentiment-integrated portfolio forecasting 3338.
Practical Takeaways: What This Means for Retail Investors
The rapid evolution of generative AI and deep learning has inadvertently created an aggressively unregulated consumer software market. Retail investors are increasingly bombarded with advertisements for autonomous "AI trading bots," "neural network algorithms," and "LLM-powered trading agents" promising effortless passive income. The reality of purchasing and deploying these systems is fraught with extreme financial risk.
Retail investors must understand that commercial bots claiming "95%+ win rates," "127% annualized average returns," or "guaranteed alpha" are almost exclusively deceptive marketing or outright fraudulent scams 448. Legitimate institutional algorithmic trading focuses on identifying microscopic arbitrage opportunities and managing highly sophisticated risk, operating on profit margins of fractions of a percent, not doubling capital in a matter of weeks 23. No real AI - whether driven by LSTMs, Transformers, or Quantum networks - can guarantee positive returns in a fundamentally chaotic market 4.
Furthermore, many of the commercially available bots sold to retail traders merely execute legacy, easily defeated technical indicators - such as the Relative Strength Index (RSI) or Bollinger Bands developed in the 1980s - draped in modern "AI" marketing buzzwords 3. Even systems that genuinely utilize machine learning often fall prey to the exact empirical pitfalls outlined in academic literature: they are heavily overfitted to historical backtests 35. They may execute perfectly during a simulated, low-volatility bull market, but they will relentlessly "catch a falling knife" during a live macroeconomic liquidity sweep because they lack true contextual awareness 3.
When engaging with AI-driven financial tools, investors must heavily calibrate their uncertainty and recognize the shifting power dynamics of the market 249. An AI forecast is merely a probabilistic mathematical input, not an infallible oracle 31. While deep learning provides unparalleled pattern recognition over massive datasets, it cannot foresee the inherent chaos of the real world. Relying on an automated consumer algorithm to blindly manage capital without rigorous human oversight, strict risk management protocols, and a deep, sober understanding of the model's mathematical limitations is a virtually guaranteed path to severe financial drawdown 323.
Bottom Line
While Long Short-Term Memory (LSTM) networks and modern Transformer architectures possess the profound computational capacity to map complex, non-linear relationships in sequential data, their application in live financial forecasting remains strictly limited by the chaotic, non-stationary mechanics of global markets. The exceptional predictive accuracy these models demonstrate in academic papers is frequently the result of in-sample overfitting, data leakage, and a failure to account for real-world execution friction, causing them to falter significantly during live trading. Ultimately, artificial intelligence serves as a highly advanced tool for institutional risk assessment and probabilistic sentiment analysis, but any system - or commercial product - claiming to offer deterministic, guaranteed foresight into the financial future is selling a mathematical impossibility.