Intergenerational Economic Mobility in the United States 2026
The Empirical Landscape of Upward Mobility
The assumption of robust intergenerational economic mobility - the statistical probability that a child will achieve a higher socioeconomic status than their parents - has long underpinned the concept of the American Dream. Empirical economics evaluates this phenomenon through two primary metrics: absolute mobility, which measures the percentage of children earning more than their parents at a comparable age after adjusting for inflation, and relative mobility, which measures the correlation between a parent's rank in the income distribution and their child's subsequent rank.
Over the latter half of the twentieth century, absolute mobility in the United States experienced a precipitous and sustained decline. While approximately 90 percent of American children born in the 1940s grew up to earn more than their parents, that figure fell to roughly 50 percent for children born in the 1980s 1. By 2026, the empirical understanding of social mobility has moved far beyond generalized national averages. Academic focus now centers on granular, disaggregated administrative data that isolates the specific impacts of race, geographic location, wealth inequality, and sweeping federal policy changes.
The study of these dynamics represents a continuation of decades of institutional research. Organizations such as the American Enterprise Institute (AEI) have analyzed poverty and social capital since the 1940s, evolving from early critiques of the Roosevelt administration's relief policies by Edna Lonigan in 1945, to Rose D. Friedman's 1965 critiques of the War on Poverty, and culminating in the 2023 launch of the Center on Opportunity and Social Mobility (COSM) 234. Recent longitudinal studies leveraging linked administrative tax and census records have fundamentally reshaped the sociological understanding of opportunity in the United States, revealing a highly fractured landscape where mobility trajectories are diverging sharply along class, geographic, and racial lines.
Divergence of Race and Class Gaps
One of the most consequential discoveries in contemporary mobility research is the rapid shift in intergenerational outcomes among different demographic cohorts. Extensive analyses published between 2024 and 2025 by researchers at the Census Bureau, Harvard University, and Opportunity Insights tracked the evolutionary divergence in economic mobility between the 1978 and 1992 birth cohorts 56.
The data indicates that the traditional Black-White income gap among individuals born to low-income parents is narrowing, while the "class gap" among White Americans - the disparity in adult earnings between those born to low-income versus high-income parents - is widening substantially 6. Specifically, for the 1978 birth cohort, Black children born to parents at the 25th percentile of the income distribution (an annual household income of approximately $26,000) went on to earn $12,994 less per year in adulthood than their White peers from the same income bracket 6. However, for the 1992 cohort, this earnings gap shrank by nearly 30 percent, reducing the deficit to $9,521 56.
This convergence is driven by two simultaneous forces: improvements in the upward mobility of low-income Black children and a marked decline in the adult earnings of low-income White children 6. At a national level, earnings outcomes for other racial and ethnic groups, such as Asian, American Indian, and Hispanic populations, saw comparatively little change across this specific time period, though Hispanic Americans generally exhibit rates of intergenerational mobility similar to White Americans 67.
Conversely, the class gap among White Americans is expanding rapidly. White children born to high-income parents (the 75th percentile) in the 1978 cohort earned $10,383 more in adulthood than their low-income White counterparts. By the 1992 cohort, this class-based premium expanded by 30 percent to $13,202 6. This widening gap reflects both declining upward mobility for White children from lower-income backgrounds and the increasing entrenchment of advantages for those born into high-income households 56.
Gender Dynamics within Mobility Gaps
The mechanisms underlying these shifting racial mobility gaps are highly gendered. When controlling for parent income, researchers found that the Black-White income gap is almost entirely driven by disparities in employment rates and wages between Black and White men 78. Statistically, there is no significant income gap between Black and White women raised in identical socioeconomic conditions 78. Black women, conditional on parent income, occasionally earn slightly more than their White female peers 7.
The persistence of the racial mobility gap for males is geographically widespread. Controlling for parental income, Black boys have lower adult incomes than White boys in 99 percent of U.S. Census tracts 78. The few areas where the Black-White gap is narrowest tend to be low-poverty neighborhoods characterized by low levels of racial bias among White residents and high rates of father presence among Black families 78. Black males who move to these specific types of neighborhoods earlier in childhood earn significantly more and face lower incarceration rates in adulthood, yet fewer than 5 percent of Black children grow up in such environments 8.
Intragenerational Income Volatility at the Top
While intergenerational mobility measures persistence across generations, intragenerational mobility tracks income volatility over a single individual's working life. Recent analyses by the Federal Reserve demonstrate significant circulation into and out of the top income brackets, complicating static measures of income inequality.
An examination of long-term tax data reveals that one-third of individuals who enter the top 1 percent of the income distribution exit that bracket within one year, and two-thirds exit within a decade 9. The churn is even more pronounced at the extreme tail of the distribution: 75 percent of those who enter the top 0.1 percent fall out of that bracket within ten years 9. Multi-year income measures that account for this long-run volatility demonstrate that intragenerational mobility over a two-decade period effectively lowers recent top 1 percent fiscal income shares by over 10 percent, and top 0.001 percent shares by 40 percent relative to single-year snapshots 9. This suggests that while structural wealth remains highly concentrated, high-earning labor income is characterized by a higher degree of temporal instability than cross-sectional data implies.
The Expanding Wealth Mobility Divide
A critical evolution in mobility research is the structural differentiation between income mobility, defined as the flow of capital via wages, and wealth mobility, representing the stock of accumulated assets. While income mobility has garnered historical focus, wealth inequality is significantly more entrenched, more unevenly distributed, and more predictive of intergenerational outcomes 10.
Local Wealth Inequality and Future Incomes
Recent spatial analysis demonstrates that local wealth inequality has a far stronger negative impact on a child's future income than local income inequality 10. Using the GEOWEALTH-US database, researchers at the University of North Carolina published landmark findings in 2025 indicating that children raised in geographic areas where asset ownership - such as real estate, equities, and business equity - is highly concentrated face substantially steeper odds of moving up the income ladder 10. Low-income children achieve lower adult incomes when they grow up in regions with severe wealth disparities, independent of the region's income disparities 10.
Disparities in Asset Accumulation by Race
The racial wealth gap remains one of the most rigid barriers to systemic mobility. Despite brief periods of nominal wage compression, the structural wealth deficit between White and Black households continues to expand. Between 2019 and 2022, according to the Federal Reserve's Survey of Consumer Finances, the mean net worth gap between Black and White households grew from $841,900 to $1.15 million - a 38 percent expansion that far outpaced inflation during the same period 11.
Human capital interventions, such as higher education, have proven insufficient to close this structural gap. Data reveals that Black households headed by an individual with a college degree possess less total wealth than White households headed by an individual whose highest educational attainment is a high school diploma or GED 11. Furthermore, Black households in the middle-income quintile hold less than one-third of the wealth of White households in the identical income bracket 11. This disparity underscores that earnings parity does not equate to wealth parity. Intergenerational transfers, inheritances, and familial financial assistance for major life events provide White households with cumulative economic advantages that are structurally absent for the majority of Black and Native American families 1112.
Intergenerational Wealth Transfers in the 2020s
The United States is currently undergoing the largest intergenerational wealth transfer in modern economic history. Projections indicate that between 2025 and 2048, an estimated $83.5 trillion to $105 trillion in personal assets will transfer hands 1314. This wealth is moving predominantly from the Baby Boomer and Silent generations to Generation X and Millennials 1413.
However, this wealth transfer serves as an accelerant for inequality rather than a democratizing force. Approximately 81 percent of the total wealth movement - representing roughly $100 trillion - is concentrated within older generations 13. An overwhelming $62 trillion of these transfers will be driven by high-net-worth and ultra-high-net-worth households, which represent just 2 percent of the U.S. population 13. Prior to reaching the younger generations, much of this wealth transfers horizontally between spouses. A projected $54 trillion will move in this manner, with $40 trillion going directly to widowed women in the Baby Boomer and older generations 13.
| Generation | Projected Inheritance Volume (Next Decade) | Long-Term Projected Inheritance (25 Years) | Average Baseline Wealth (2025) |
|---|---|---|---|
| Generation Z | Minimal | Moderate | $32,000 |
| Millennials | $8 Trillion | $46 Trillion | $173,000 |
| Generation X | $14 Trillion | $20+ Trillion | $311,000 |
| Baby Boomers | Horizontal Spousal Transfers ($40 Trillion) | N/A (Primary Benefactors) | $472,000 |
Table 1: Generational Wealth Baselines and Projected Inheritance Volumes in the United States 1314.
Because wealth provides an economic buffer, dictates residential location, and allows for entrepreneurial risk-taking, the concentration of inheritances drastically limits relative mobility for those excluded from the transfer 1012. Furthermore, studies suggest up to 90 percent of inherited wealth is lost by the third generation due to poor financial preparation, prompting an increase in specialized wealth preservation strategies among the ultra-wealthy 15.
Geographic Determinants and Social Capital
Economic outcomes are deeply intertwined with the sociological and geographic frameworks in which children are raised. Beyond pure financial capital, upward mobility is heavily influenced by community-level variables, institutional design, and access to localized social networks.
State-Level Social Mobility Rankings
The probability of upward mobility is highly contingent on state and local geography. Using large-scale census data to map the childhood roots of social mobility, researchers have identified distinct regional variations. The 2025 Social Mobility in the 50 States Index, published by the Archbridge Institute, synthesized state-level data across four pillars: entrepreneurship and growth, institutions and the rule of law, education and skills development, and social capital 1617.
The index reveals a stark geographic divide. The Mountain and Central regions provide the most robust environments for upward mobility, while the Deep South exhibits the highest structural barriers 1618.
| Rank | State | 2025 Social Mobility Score (0-10) | Regional Classification |
|---|---|---|---|
| 1 | Utah | 6.44 | Mountain |
| 2 | Vermont | 6.43 | New England |
| 3 | Montana | 6.31 | Mountain |
| 4 | Wyoming | 6.30 | Mountain |
| 5 | Idaho | 6.12 | Mountain |
| ... | ... | ... | ... |
| 48 | Alabama | 3.58 | South |
| 49 | Mississippi | 3.24 | South |
| 50 | Louisiana | 3.07 | South |
Table 2: Highest and Lowest Ranked U.S. States for Social Mobility. Data sourced from the 2025 Archbridge Institute Index 18.
States ranking at the bottom of the index, such as Louisiana and Mississippi, simultaneously record the highest rates of childhood poverty (25.2 percent and 24.3 percent, respectively) 19. Conversely, top-ranking states like Vermont and North Dakota possess childhood poverty rates near 10 percent 19. The index highlights that areas with high mobility generally feature less residential segregation, superior primary education, high levels of localized social capital, and robust family stability indicators 20.
The Components of Social Capital
The role of social networks in facilitating economic advancement has moved to the forefront of mobility research. Foundational studies analyzing billions of privacy-protected social media connections have quantified "social capital" into measurable indices, proving it to be a primary determinant of upward mobility 21.
Researchers categorize social capital into three distinct types: economic connectedness (the degree of interaction between low-income and high-income individuals), cohesiveness (the degree to which social networks are fragmented into cliques), and civic engagement (rates of volunteering and participation in community organizations) 21. Of these, economic connectedness is the only factor strongly associated with economic mobility. Children raised in communities with high levels of cross-class interaction demonstrate significantly higher probabilities of rising out of poverty 21. Holding economic connectedness constant, variables traditionally blamed for lower mobility - such as localized income inequality or strict racial segregation - lose their statistical significance 21.
The lack of economic connectedness in the United States is driven equally by two factors: geographic segregation, which physically separates classes across different schools and neighborhoods, and "friending bias," the sociological tendency for individuals to associate primarily with those of their own socioeconomic class, even when placed in integrated environments 21.
International Comparisons and The Great Gatsby Curve
To contextualize the state of American mobility in 2026, researchers frequently utilize the Intergenerational Income Elasticity (IGE) metric. IGE measures the percentage difference in a child's expected income associated with a 1 percent difference in their parents' income. A higher IGE indicates a stronger correlation between parent and child incomes, translating to lower social mobility.
The United States consistently exhibits lower intergenerational mobility than many of its industrialized peers, adhering to the macroeconomic phenomenon known as the "Great Gatsby Curve," which posits a strong negative correlation between high economic inequality and high intergenerational mobility 1222. The most recent OECD and World Bank global databases classify the United States among nations with structurally rigid income persistence, standing in stark contrast to the Nordic mobility model.
| Country | Intergenerational Mobility Environment | General IGE Range / Categorization | Inequality Context |
|---|---|---|---|
| Denmark | Highly Fluid | < 0.20 (Top Quintile Mobility) | Low Income Inequality |
| Norway | Highly Fluid | < 0.20 (Top Quintile Mobility) | Low Income Inequality |
| Canada | Fluid | 0.20 - 0.30 | Moderate Income Inequality |
| United Kingdom | Rigid | 0.40 - 0.50 | High Income Inequality |
| United States | Highly Rigid | > 0.50 (Bottom Quintile Mobility) | Very High Income Inequality |
Table 3: Comparative Intergenerational Income Mobility among selected OECD nations. Data reflects consolidated indices of income elasticity and mobility rigidity 2324.
A 2024 World Bank database covering 87 countries and 84 percent of the global population confirmed that the Great Gatsby Curve holds true globally, particularly extending into developing nations 22. Within the OECD, the U.S. remains an outlier in both income inequality and mobility rigidity. The ratio of the average income of the richest 10 percent to the poorest 10 percent of the population is 8.4 to 1 on average across OECD countries, but the U.S. distribution is significantly more skewed 25. In the U.S., 43 percent of children born into the bottom quintile remain there as adults, and only 4 percent manage to transition to the top quintile 1.
Labor Market Disruptions from Artificial Intelligence
While tax policies and wealth transfers dictate capital mobility, the labor market remains the primary arena for intragenerational advancement. In 2026, the rapid integration of Artificial Intelligence (AI) into the corporate landscape is fundamentally altering the architecture of career progression, presenting acute risks to workers without four-year college degrees.
Automation of Gateway Occupations
Historically, non-college-educated workers - categorized by researchers as "STARs" (Skilled Through Alternative Routes) - relied on specific entry-level and mid-level administrative roles to acquire the skills necessary for upward mobility. These roles, termed "Gateway" occupations, function as critical stepping stones to higher-paying "Destination" roles in sales, human resources, and management 2627.
According to 2026 reports from the Brookings Institution, AI deployment threatens to systematically dismantle this infrastructure. Of the 70 million STARs in the U.S. workforce, over 15.6 million are currently employed in jobs highly exposed to generative AI automation 27. Critically, nearly 11 million of these workers occupy Gateway roles - predominantly clerical, administrative, and customer service positions 2627. As AI systems absorb routine cognitive and administrative tasks, the availability of these entry-level stepping stones is shrinking.
Distributional Impacts on Career Pathways
The distributional consequence of this technological shift is the erosion of upward career pathways. If Gateway jobs are automated away, the bridge between low-wage service labor and high-wage Destination roles collapses. Almost half of the traditional career pathways between Gateway jobs and higher-paying Destination jobs are highly exposed to AI 26. This dynamic strands millions of workers in lower-tier employment with no structural mechanism for advancement, an issue geographically concentrated in the Northeast and Sun Belt regions 27.
While macro-economic models project that AI will boost total U.S. GDP by 1 to 4 percent over the next decade, early administrative payroll analyses from 2026 indicate that AI exposure has already resulted in relative employment declines for early-career workers in exposed occupations 28. Conversely, employment outcomes for senior, experienced workers remain stable 28. This suggests that AI, much like the broader legislative and wealth frameworks of 2026, inherently favors those who have already accumulated experience, capital, or specific educational credentials, further stifling fluid mobility for new labor market entrants.
Federal Policy Shifts in 2025 and 2026
The structural realities of economic mobility in 2026 are heavily dictated by the current legislative environment. In July 2025, the federal government enacted the "One Big Beautiful Bill Act" (OBBBA), a sweeping budget reconciliation package encompassing $5 trillion in tax provisions alongside historic structural overhauls to federal spending 2930. The macroeconomic implementation of this legislation has resulted in a distinct "barbell effect" on the U.S. economy, permanently expanding tax advantages for capital-intensive corporations and targeted segments of the working class, while simultaneously executing unprecedented contractions in the social safety net 29.
The OBBBA Tax Provisions
The OBBBA structurally altered individual and corporate tax frameworks by making permanent the reduced individual income tax brackets and higher standard deductions established in 2017 3031. For low-wage and hourly workers, the legislation introduced novel deductions designed to increase immediate liquidity. Nonexempt employees working over 40 hours a week can deduct up to $12,500 of overtime pay ($25,000 for joint filers), and service sector workers can exclude up to $25,000 in reported tip income from federal income taxation 30.
The legislation also expanded the Child Tax Credit to $2,200 per child, indexing it to inflation starting in 2026 293032. However, the refundable portion remains capped at $1,700, and households with zero federal income tax liability remain ineligible for the full credit, limiting the mobility-enhancing impact for the lowest earners 30. Conversely, the legislation benefits upper-middle-class households in high-tax jurisdictions by temporarily increasing the State and Local Tax (SALT) deduction cap from $10,000 to $40,000 through 2029 32. It also enacted 100 percent bonus depreciation for qualifying business property, favoring capital-intensive enterprises 2933.
Contractions in Medicaid and Disability Services
The most profound threat to the economic stability of the bottom quintile originates from the OBBBA's sweeping cuts to federal entitlement programs. The legislation mandates a roughly $1 trillion reduction in federal Medicaid funding over a ten-year horizon, marking the largest contraction of the health care safety net in U.S. history 34.
These cuts are achieved through stringent new work requirements for expansion populations, increased frequency of eligibility checks, and caps on federal matching funds that force states to bear greater financial burdens 3435. The downstream effects disproportionately target the 15 million disabled Americans reliant on Medicaid for long-term services and supports (LTSS). Because Home and Community-Based Services (HCBS) are categorized as "non-mandatory" Medicaid offerings, state-level budget crunches place these programs at acute risk of elimination 36. Hundreds of thousands of individuals are already on HCBS waitlists nationwide, and the funding constraints are expected to increase institutionalization rates 36.
Furthermore, the OBBBA implements stringent asset-testing mechanisms designed to force the liquidation of intergenerational wealth. By October 2028, Medicaid enrollees requiring LTSS will be subject to a strict home equity cap of $1 million 35. This provision explicitly requires disabled individuals and seniors to divest their primary real estate assets to qualify for essential care, severing one of the few mechanisms low-income and disabled households possess for transmitting generational wealth. Concurrent cuts to the Supplemental Nutrition Assistance Program (SNAP), totaling $186 billion over a decade, expand rigid work requirements to older adults and individuals previously exempt, severely dampening baseline economic security 35.
Restructuring of Federal Higher Education Finance
Education has historically operated as the primary lever for socioeconomic mobility. However, the OBBBA fundamentally rewrites the federal student aid framework, instituting aggressive caps that limit borrowing capacity, particularly for graduate study and parental contributions.
Beginning July 1, 2026, the Graduate PLUS loan program - which previously allowed graduate students to borrow up to the full cost of attendance - will be entirely eliminated 37. Graduate students will be restricted to Direct Unsubsidized Loans, capped at $20,500 annually with a strict $100,000 lifetime limit 38. Certain professional programs, such as medicine and law, receive a slightly higher cap of $50,000 annually and $200,000 lifetime 38.
Similarly, the Parent PLUS program, which traditionally allowed parents to finance the remainder of their children's undergraduate education without a hard monetary cap, faces severe new restrictions. The OBBBA caps Parent PLUS borrowing at $20,000 per year per student, with a hard lifetime maximum of $65,000 39.
| Loan Program | Pre-2026 Borrowing Limit | OBBBA Limit (Effective July 1, 2026) |
|---|---|---|
| Graduate PLUS | Up to Full Cost of Attendance | Eliminated |
| Parent PLUS | Up to Full Cost of Attendance | $20,000 / year ($65,000 Lifetime Cap) |
| Graduate Unsubsidized | $20,500 / year ($138,500 Lifetime) | $20,500 / year ($100,000 Lifetime Cap) |
| Professional Unsubsidized | N/A (Regulated under Grad PLUS) | $50,000 / year ($200,000 Lifetime Cap) |
| Total Lifetime Borrowing | No Aggregate Cross-Program Cap | Strict $257,500 Aggregate Cap |
Table 4: Federal Student Loan Borrowing Limit Changes under the 2025 OBBBA 373839.
While these caps are designed to curb the national student debt crisis and place downward pressure on tuition inflation, they introduce profound mobility constraints. Without access to federal graduate funding or parental gap financing, low-income students will likely be forced into the private loan market, which relies on credit scores and wealthy cosigners. Consequently, higher education risks reverting to an exclusionary mechanism accessible primarily to the wealthy.
The Mechanics and Equity of Federal Trump Accounts
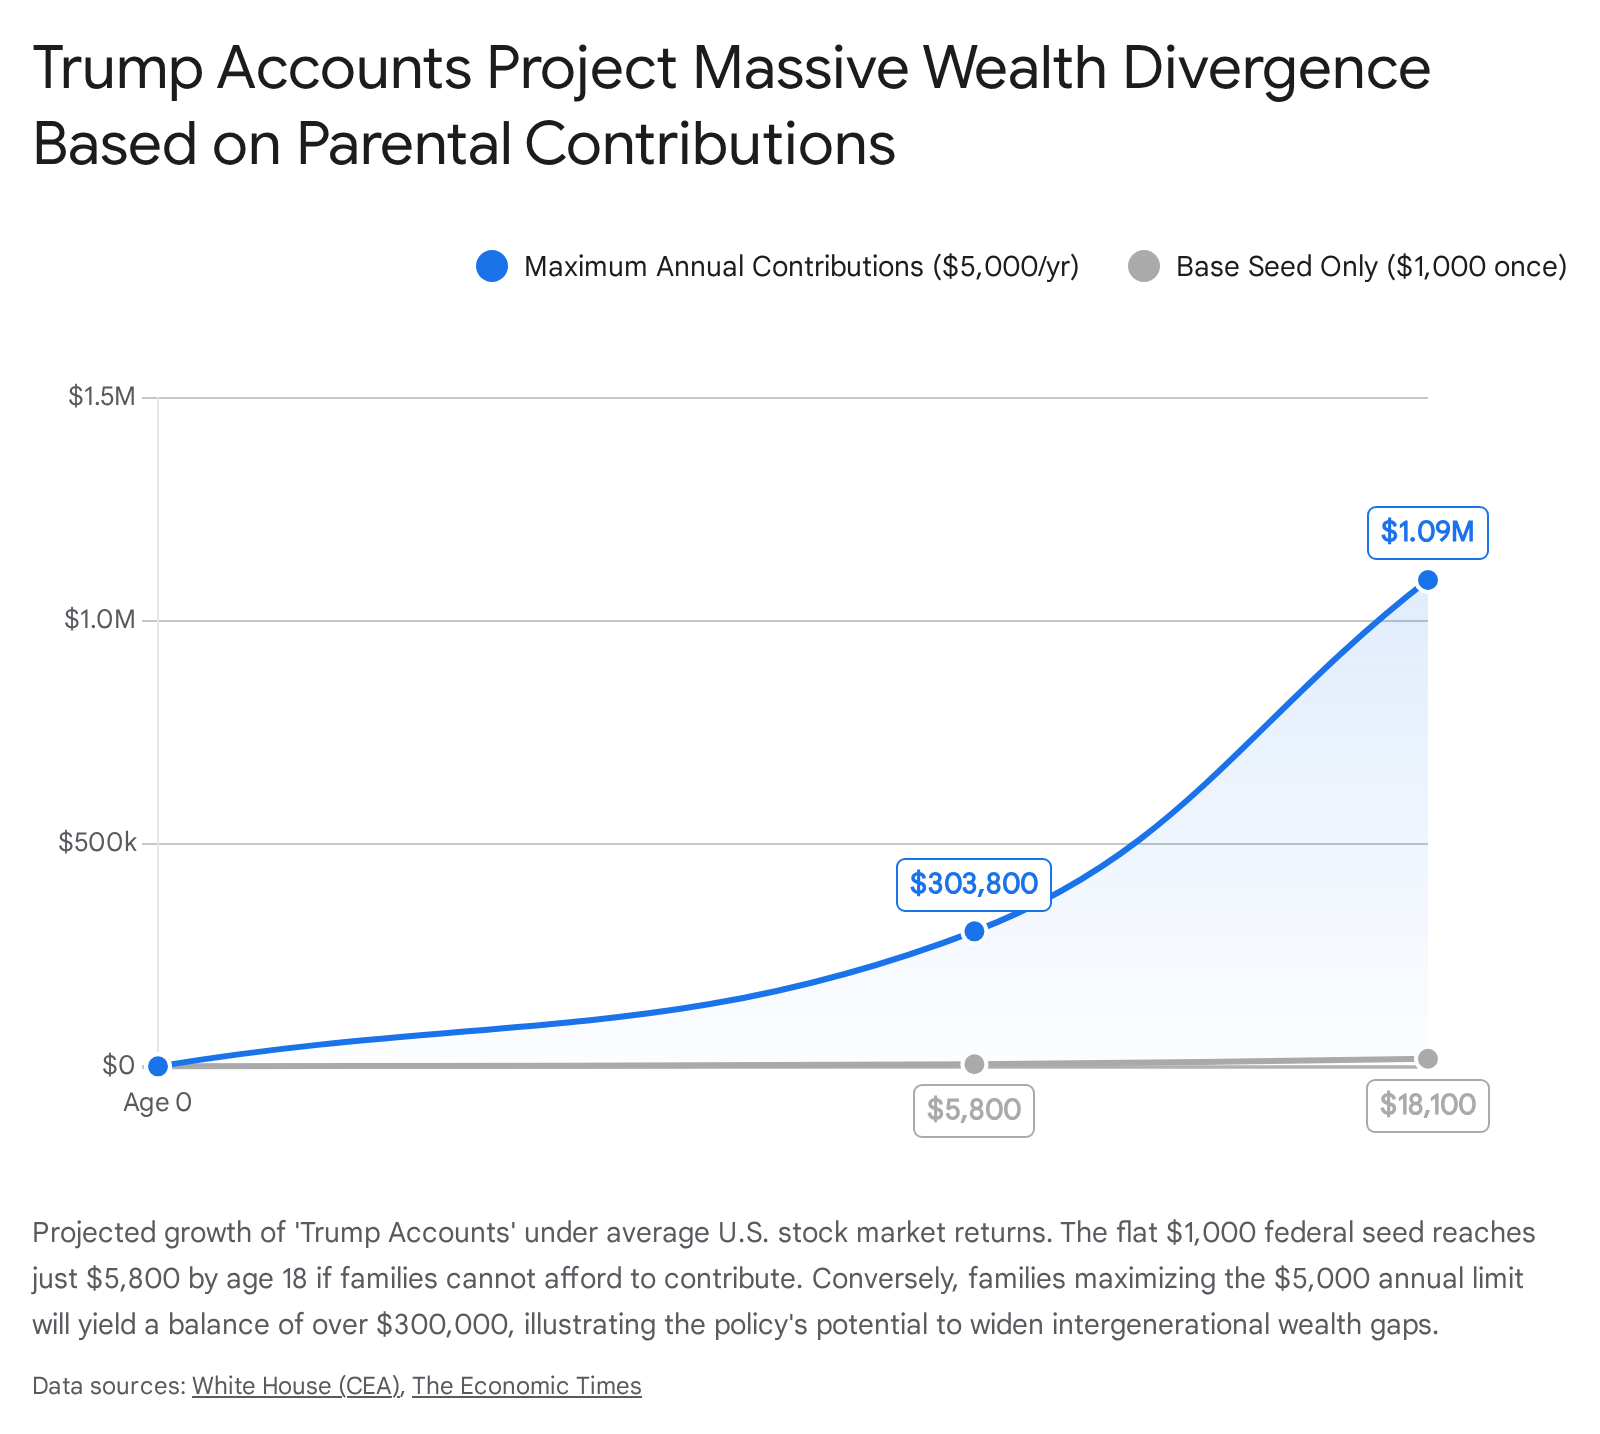
In an attempt to foster early asset accumulation, the OBBBA establishes "Trump Accounts," a federal baby bond initiative rolling out in July 2026. The program seeds a tax-advantaged investment account with $1,000 for every eligible U.S. child born between 2025 and 2028 4340. The funds are locked in broad-market index funds until the beneficiary turns 18, after which they can be withdrawn penalty-free for qualified expenses such as education, homeownership, or entrepreneurship 4341.
While the initiative represents a massive federal endorsement of compound market growth, its structural design has drawn severe criticism for being highly regressive. Unlike progressive baby bond proposals that allocate larger seed amounts to children in poverty, the Trump Accounts offer a flat $1,000 to all eligible children regardless of household income 42. The law then allows parents to contribute up to $5,000 annually to the account, and employers can match up to $2,500 tax-free 4041.
Because wealthy families possess the disposable income to maximize these annual contributions, the accounts are poised to turbocharge existing disparities. Economic modeling by the Council of Economic Advisers projects that a fully funded account (maximizing the $5,000 annual contribution) could reach $303,800 by age 18, and over $1 million by age 28 assuming average market returns 40. Conversely, a low-income child whose family cannot afford supplemental contributions will see their initial $1,000 seed grow to merely $5,800 by age 18 4041.
Private philanthropy is attempting to bridge this gap; in early 2026, the Dell Foundation pledged $6.25 billion to deposit an additional $250 incentive into the accounts of 25 million children in economically disadvantaged zip codes 4143. Nonetheless, without structural progressivity - such as income-tiered federal matching or sliding scale seeds - the Trump Accounts threaten to become a state-sponsored mechanism for upper-middle-class wealth hoarding, effectively functioning as a tax-sheltered trust fund that leaves the poorest demographic cohorts mathematically stranded 4243.
The data governing 2026 economic mobility does not suggest that the American Dream is entirely dead, but rather that it has been structurally redefined and strictly partitioned. Upward mobility is no longer a ubiquitous demographic guarantee; it is a highly conditional outcome dependent on a precise alignment of geographic location, localized social capital, racial equity, and access to intergenerational wealth.