How to Use Moving Averages to Time Swing Trades
Swing traders utilize moving averages to identify prevailing market trends, locate dynamic support and resistance zones for trade entries, and establish objective parameters for stop-loss orders. By pairing a highly responsive indicator like an exponential moving average for precise entry timing with a slower simple moving average for trend confirmation, market participants attempt to capture short-term momentum while filtering out daily price noise. However, because moving averages rely entirely on historical data, they mathematically lag behind real-time price action and frequently produce costly false signals during periods of market consolidation.
The Foundation of Moving Averages in Swing Trading
Swing trading occupies a specific strategic middle ground between intraday day trading and long-term position investing. Rather than closing positions at the end of a single session to avoid overnight risk, or holding assets for years based on fundamental macroeconomic valuations, swing traders attempt to capture short- to medium-term price movements over a period ranging from a few days to several weeks 123. Because the time constraints of these directional bets are tight, identifying established momentum and timing entries precisely is critical to maintaining a profitable risk-to-reward ratio.
Moving averages serve as the foundational technical tool for evaluating this momentum. At their core, moving averages calculate an asset's continually updated average closing price over a specific number of historical periods, plotting that aggregated data as a single, smoothed line on a price chart 4567. Financial markets are inherently chaotic environments, with asset prices constantly spiking and dropping based on unexpected news events, algorithmic trading flows, and the emotional extremes of retail participants. Moving averages function much like a mechanical "shock absorber" for this volatility, smoothing out the daily noise and extreme price deviations to reveal the true underlying direction of the market 4896.
When the current price of a security is consistently trading above an upward-sloping moving average, the market is generally considered to be in an established uptrend, signaling that buyers are firmly in control 6111213. Conversely, when the price remains persistently below a downward-sloping average, a bearish downtrend is in play, indicating that sellers dominate the tape 111213. Swing traders rely heavily on this visual clarity to ensure they are trading in alignment with the prevailing market current rather than attempting to fight against it.
The psychological impact of these indicators cannot be overstated. Because millions of retail traders, institutional portfolio managers, and algorithmic trading systems track the exact same moving average lines, these indicators often function as self-fulfilling prophecies 111415. When a major asset approaches a widely watched moving average, the collective expectation that the line will act as a barrier often triggers a flood of buying or selling pressure that physically forces the market to respect the technical level.
Comparing Moving Average Variations
Before executing a swing trade, practitioners must decide exactly how their moving averages weight historical data. While the basic premise remains the same, the mathematical variations significantly alter how quickly the indicator responds to sudden changes in market conditions. The two dominant variations in the industry are the Simple Moving Average (SMA) and the Exponential Moving Average (EMA), though alternative calculations like the Linear Weighted Moving Average (LWMA) and Triangular Moving Average (TMA) also see specialized use 2671718.
The Simple Moving Average (SMA)
The Simple Moving Average is the most widely utilized and easily understood trend indicator. It calculates the arithmetic mean of closing prices over a given period. For example, a 50-day SMA simply adds the closing prices of the last 50 trading sessions and divides the sum by 50 4578. As each new trading day concludes, the oldest data point is dropped from the calculation, and the newest closing price is added, causing the average to "move" forward in time 49.
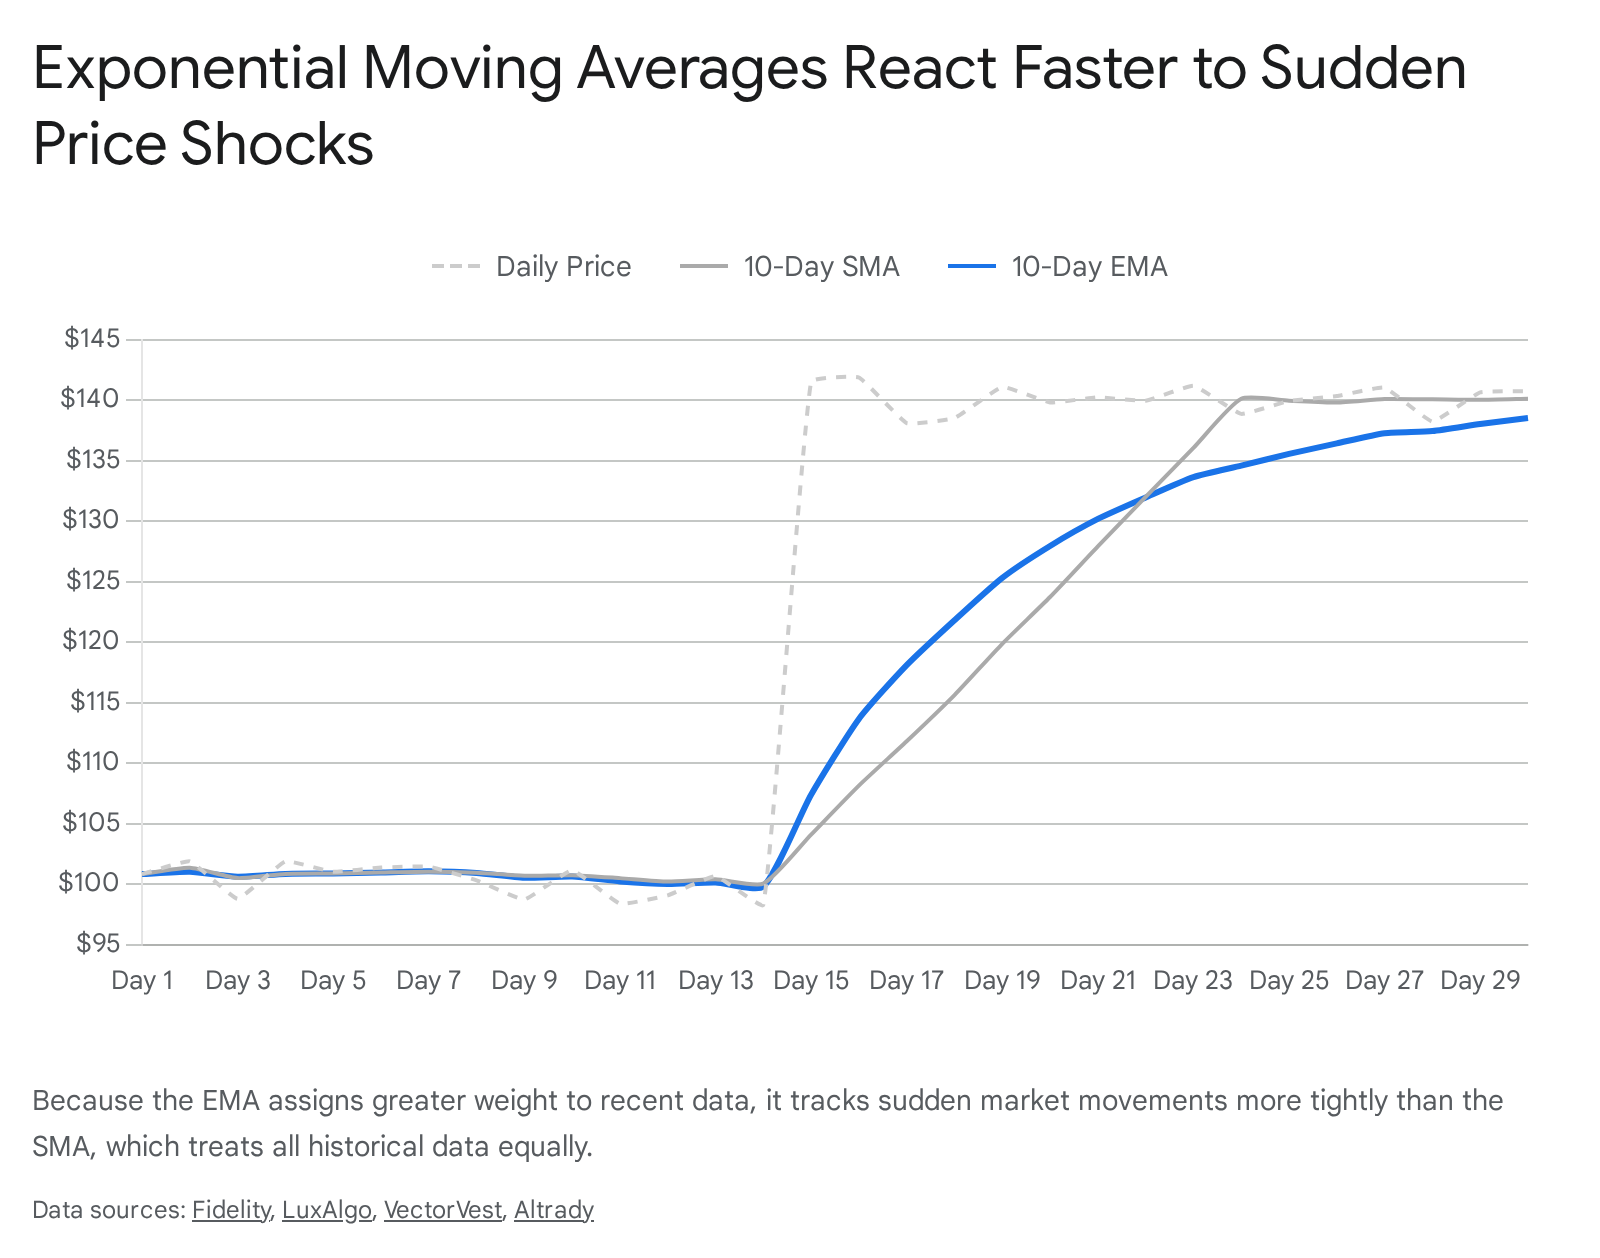
Because the SMA formula treats the oldest data point in the sequence exactly the same as the most recent closing price, it is relatively slow to react to sudden price shifts or volatility shocks. This inherent sluggishness is actually considered its primary strength by long-term traders. The stability of the SMA makes it highly effective for identifying broad, macroeconomic trends and establishing major levels of structural support or resistance without being thrown off by a single day of erratic, headline-driven trading 6710.
The Exponential Moving Average (EMA)
The Exponential Moving Average utilizes a more complex calculation that applies a smoothing multiplier to assign exponentially greater mathematical weight to the most recent data points 4677. If a company announces a surprise earnings beat and its stock surges 15% in a single session, the EMA will curve upward almost immediately to reflect the new market reality, whereas the SMA will take significantly longer to fully absorb the shift 171011.
Swing traders frequently prefer the EMA for timing short-term trade entries and exits because this heightened sensitivity allows them to adapt to changing momentum before the wider crowd reacts 61011. When tracking tight, fast-moving swings, the EMA acts as the real-time pulse of the market, helping traders identify when a brief counter-trend pullback is actually the beginning of a larger structural reversal 1711.
Advanced Moving Average Models
Beyond the standard SMA and EMA, quantitative analysts sometimes utilize more advanced smoothing algorithms to combat the inherent lag of traditional indicators. The Linear Weighted Moving Average (LWMA) operates similarly to the EMA by assigning more significance to recent prices, but its weighting drops off in a strict linear fashion rather than exponentially. This can provide extremely early signals for trade entries, though it is prone to producing a higher volume of false signals during volatile market conditions 2.
Alternatively, the Triangular Moving Average (TMA) is double-smoothed, essentially calculating the average of a simple moving average. This creates an incredibly smooth line that ignores nearly all short-term volatility, though the trade-off is an even more severe lag behind real-time price action. In historical backtesting of crossover strategies, the TMA has occasionally shown superior performance in terms of maximum drawdown reduction, specifically because its extreme smoothing prevents traders from being chopped up in sideways markets 18.
| Feature | Simple Moving Average (SMA) | Exponential Moving Average (EMA) | Linear Weighted Moving Average (LWMA) |
|---|---|---|---|
| Data Weighting | Treats all historical closing prices equally across the lookback period. | Applies an exponential multiplier to assign greatest weight to the most recent prices. | Drops weight in a linear progression from the newest to oldest price data. |
| Reaction Speed | Slower and highly stable. | Fast and responsive to price shocks. | Very fast, closely hugging immediate price action. |
| Primary Use Case | Identifying broad market trends and long-term support/resistance levels. | Timing exact entries and tracking short-to-medium-term momentum. | Capturing extremely early entry signals in low-volatility environments. |
| Primary Drawback | Lags significantly behind real-time market turns, causing late entries. | Prone to false signals when markets become temporarily erratic or choppy. | Highly susceptible to "whipsaws" and false breakouts during volatile conditions. |
Selecting the Appropriate Lookback Periods
While trading software allows participants to calculate moving averages for any arbitrary number of days, the financial industry has largely settled on several core lookback periods. Understanding how institutions view these specific moving averages is essential, as their widespread adoption dictates where major liquidity pools will form 1114.
The 20-day moving average (often an EMA) acts as the immediate short-term trend guide. It closely follows recent price action and represents approximately one month of trading data. Swing traders widely use the 20-day average to manage highly active trades and identify brief, shallow pullbacks for aggressive entries in strong trends 6231213. When an asset is trading cleanly above its 20-day average, short-term momentum is firmly in the hands of buyers, and dips to this line are often met with rapid buying pressure 23.
The 50-day moving average represents the intermediate trend, covering roughly ten weeks of trading activity. It is arguably the most critical structural benchmark for swing traders and is closely monitored by mutual fund managers and institutional investors to gauge the medium-term health of an asset 82312. The percentage of stocks trading above their respective 50-day moving averages is frequently used as a barometer for the overall health of the broader stock market 8. In a strong uptrend, stocks will frequently pull back to the 50-day moving average, where institutional buyers step in to defend the level and accumulate shares, making it an ideal zone for swing traders to hunt for low-risk entry points 823.
The 200-day moving average defines the macroeconomic, long-term trend. Covering roughly a full calendar year of trading sessions, it is widely viewed by Wall Street analysts and financial media as the ultimate dividing line between bull and bear markets 5112312. While swing traders operate on much shorter timeframes than the 200 days measured, they generally prefer to align their directional bets with this massive macroeconomic current. Many disciplined swing traders apply a strict rule: they will only enter long positions when the asset is above the 200-day average, and only look for short-selling opportunities when the asset is below it, ensuring they have the broader market momentum at their back 112314.
Core Strategy: Trading Dynamic Support and Resistance
One of the most robust methodologies for utilizing moving averages in swing trading is to treat them as dynamic, floating barriers of support and resistance 12137. Unlike static horizontal support levels drawn across historical price bottoms - which remain fixed at a specific dollar amount - moving averages adapt in real-time, rising and falling as the market trends higher or lower 1213.
A common and highly effective setup involves waiting for an established, powerful trend to momentarily exhaust itself. In an upward-trending market, prices cannot rise in a straight line forever; they will occasionally dip due to short-term profit-taking or minor negative news, causing the asset to revert toward its moving average 1114. Swing traders view this regression to the mean not as a structural failure of the trend, but as a high-probability "buy the dip" opportunity 612. The moving average acts as a trampoline; as the price touches the line, traders look to accumulate positions at a discount relative to the recent highs.
When analyzing these pullbacks, institutional brokerages suggest deeply evaluating how a specific asset has historically reacted to its average. For example, if a stock has previously pulled back to its moving average during the current trend and penetrated the line by an average of 1.5% before bouncing, a trader might strategically place a buy limit order roughly 1% below the moving average 1. This tactic attempts to capture the absolute exhaustion point of the selling pressure, securing a superior entry price compared to buying exactly on the line.
Crucially, experienced traders do not buy blindly the exact moment a falling price touches a moving average. They wait for technical confirmation that the market is actually treating the moving average as support. This confirmation typically comes in the form of a bullish reversal candlestick pattern (such as a hammer or an engulfing candle) closing near the moving average, ideally accompanied by a surge in trading volume to prove that institutional buyers have indeed stepped back into the market to defend their positions 7121415.
Core Strategy: The Moving Average Crossover System
Instead of relying on price action touching a single line, a significant portion of swing traders utilize a crossover system featuring two moving averages of different lengths. This strategy generates mechanical, objective signals when a faster moving average intersects with a slower one. The crossover indicates a potential shift in the balance of power, suggesting that recent price momentum has finally overpowered the historical trend trajectory 412293031.
For short-term momentum swing trades, a popular combination is the 9-period EMA paired with a 21-period EMA. When the fast 9-EMA crosses above the slower 21-EMA, it signals that immediate buying pressure is accelerating rapidly, triggering a mechanical long entry 672931. Conversely, a crossover to the downside provides a clear, emotionless exit signal to close the long trade or initiate a short position. By relying on the strict mathematical trigger of the crossover, traders can reduce the subjective, emotional decision-making that often leads to holding losing positions for too long 3031.
To gain additional confirmation, some traders deploy a Triple Moving Average system, plotting the 20-day, 50-day, and 200-day averages simultaneously. In this configuration, traders look for perfect alignment: the 20-day must be above the 50-day, which must be above the 200-day. This tiered structure acts as a rigorous filter, confirming that the market is in a powerful, synchronized uptrend across short, medium, and long-term timeframes before capital is deployed 7122916.
The Golden Cross and the Death Cross
On a broader macroeconomic scale, the interactions between the 50-day and 200-day simple moving averages produce the most famous crossover patterns in all of technical analysis. A "Golden Cross" occurs when the 50-day SMA breaks upward through the 200-day SMA 6782933. This indicates that intermediate momentum has successfully overpowered long-term structural resistance, often signaling the birth of a sustained upward swing or a new multi-year bull market 5122933.
A visual representation of these crosses typically shows the shorter moving average intersecting the longer one, with price action shifting from a bear market to a bull market or vice versa. A Golden Cross is visually marked by an upward intersection point, indicating strong bullish momentum as the 50-day moving average rises above the 200-day. Conversely, a "Death Cross" occurs when the 50-day falls below the 200-day, serving as a dire warning of a potential sustained downtrend marked by a downward intersection 671229.
While these signals receive massive attention from the financial media, they present a distinct challenge for swing traders. Because they rely on 50 and 200 days of data, Golden and Death Crosses suffer from extreme lag. By the time the 50-day average actually crosses the 200-day average, the market has usually been rallying or crashing for months 233435. Therefore, rather than using a Golden Cross as a precise trigger to buy on that specific day, swing traders use the event as a macroeconomic green light, indicating that they should aggressively seek smaller, short-term long setups in the weeks following the crossover 3335.
The Mathematical Flaw: Signal Lag and Whipsaws
Despite their immense popularity, all moving average strategies harbor a fundamental mathematical limitation: they are purely backward-looking, lagging indicators 151737. Unlike predictive models that attempt to forecast future price targets based on fundamental valuations or options market pricing, a moving average can only summarize what has already happened in the past 81537.
From a signal-processing standpoint, every moving average acts as a smoothing filter that introduces inherent delay. For a Simple Moving Average of length N, the effective lag is roughly N/2 periods. This means a 20-period SMA actually reflects the price reality of roughly 10 bars ago, and a 200-period SMA lags by about 100 bars 34. By the time a moving average crossover signals a new trend, the actual absolute price bottom or top occurred significantly prior. Consequently, traders entering exclusively on moving average signals are effectively paying a "lag premium" - sacrificing the first and most lucrative portion of the price move in exchange for the safety of mathematical confirmation 343718.
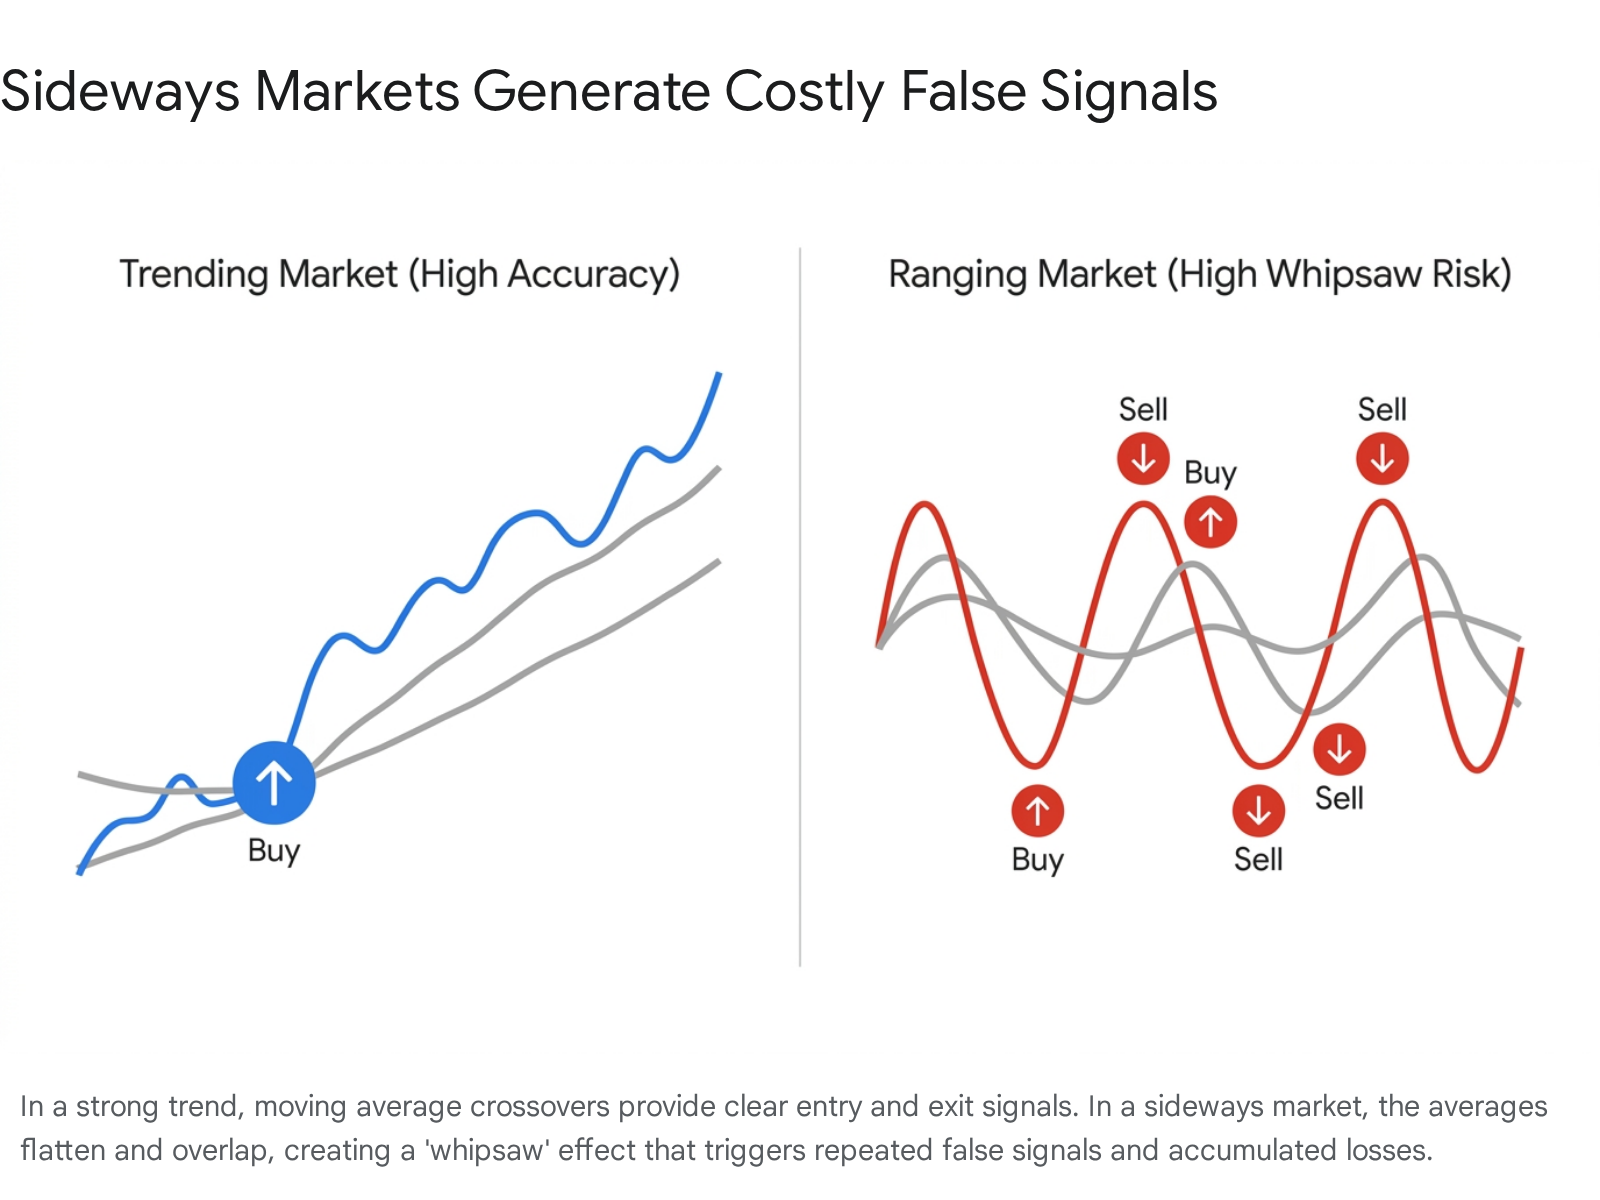
This lag becomes dangerously destructive in ranging, choppy, or sideways markets. Moving averages excel and generate massive profits during strong, sustained, unidirectional trends 23311617. However, markets only trend strongly a fraction of the time. When an asset enters a period of consolidation - trading sideways between a fixed ceiling of resistance and a floor of support - the moving averages flatten out and converge upon one another 2330.
In this sideways environment, the price will rapidly cross back and forth across the flattened moving average line. Traders relying strictly on mechanical crossover rules will be forced into a devastating "whipsaw" cycle. They will receive a buy signal near the top of the range as the fast line crosses up, only to watch the price immediately reverse downward. Days later, they will receive a sell signal at the absolute bottom of the range, forcing them to close for a loss just before the price bounces back up 23301737.
To mitigate whipsaw risks, professional swing traders never use moving averages in total isolation. They demand technical confluence by monitoring the slope of the average (avoiding trading when the 50-day or 200-day lines are flat), observing trading volume to confirm participation, and utilizing momentum oscillators like the Average Directional Index (ADX) or Relative Strength Index (RSI). For instance, if the ADX - a metric that measures trend strength - reads below 20, it indicates a sideways market, and disciplined traders will entirely ignore moving average crossover signals until a genuine trend re-establishes itself 231529301839.
Quantitative Evidence: Do Moving Averages Actually Work?
The financial industry has fiercely debated the actual profitability of moving average strategies for decades. Proponents of the Efficient Market Hypothesis (EMH) argue that because moving averages are calculated using publicly available historical data, all relevant information is already priced into the asset. According to strict EMH interpretations, a trader cannot generate excess returns simply by waiting for two lines on a chart to cross 19202122.
Quantitative backtests reveal sobering statistics regarding the frequency of false signals. Independent studies analyzing moving average strategies on the S&P 500 index from 1960 to the present have demonstrated that pure, mechanical moving average strategies suffer from remarkably low win rates. Testing across various lookback periods showed that false signal rates range from 57% on highly responsive 5-day configurations up to a staggering 76% false signal rate on longer, 120-day configurations 44. In highly efficient, developed markets like the United States and Japan, numerous academic studies have concluded that moving average crossover strategies frequently fail to outperform a simple, passive buy-and-hold approach once the drag of transaction costs and the accumulation of whipsaw losses are accounted for 202324.
Interestingly, these same quantitative studies note a massive divergence based on regional market efficiency. Research into global equities from 1989 to 2003, as well as more recent evaluations in the 2010s, demonstrates that moving average strategies show significantly greater profitability when applied to emerging stock markets compared to developed markets 20212425. When applied to indices in Taiwan, Thailand, the Philippines, and various emerging Latin American markets, variable moving average models routinely outperformed simple buy-and-hold strategies, generating higher risk-adjusted returns with lower maximum drawdowns 202426.
Researchers attribute this geographic disparity to behavioral finance and market friction. Emerging markets often feature lower liquidity, slower dissemination of fundamental information, and higher participation by retail traders prone to psychological herding. In these less efficient environments, trends take longer to fully price in, meaning they become larger and more persistent. This allows trend-following tools like moving averages to capture massive, sustained swings that offset the inevitable false signals, proving that the efficacy of technical analysis is deeply tied to the underlying efficiency of the market being traded 202122.
Adapting Strategies Across Different Asset Classes
The exact settings and strategies a swing trader uses for moving averages cannot be copy-pasted universally. The structural mechanics, trading hours, and volatility profiles of equities, foreign exchange (Forex), and cryptocurrencies require vastly different technical calibrations.
The Stock Market
In traditional equity markets, trading is highly structured. The market halts for weekends, holidays, and overnight periods. Individual stocks are heavily influenced by after-hours earnings reports, executive shakeups, and macroeconomic data releases that occur when the market is closed 1549. This structure frequently creates drastic price gaps by the morning bell, where a stock opens significantly higher or lower than its previous close. Because these gaps are incorporated into the data, moving averages in the stock market can sometimes experience distortions. Stock swing traders generally rely on the standard, widely respected 20, 50, and 200-day simple moving averages to navigate this environment, leaning heavily on the 50-day SMA as a firm institutional support level where mutual funds are likely to defend their positions 15849.
The Forex Market
Foreign exchange markets operate 24 hours a day, five days a week, driven largely by central bank policies, interest rate differentials, and global macroeconomic data 4950. Because the market never sleeps during the week, liquidity and volatility shift dynamically as the Asian, European, and US trading sessions overlap 50. During the Asian session, traders might utilize the carry trade - borrowing low-yielding currencies to buy high-yielding ones - which creates distinct trending behaviors 50. To navigate these overlapping global sessions, currency swing traders often prefer a specific combination: the 20-period EMA for precise entries paired with the 50-period SMA for trend filtering. This specific setup is considered a gold standard for highly liquid, heavily traded pairs like EUR/USD or GBP/JPY, allowing traders to filter out intraday noise while reacting quickly to overnight liquidity shifts originating in different time zones 2728.
The Cryptocurrency Market
Cryptocurrency trading presents the most extreme and technically unique environment. Operating 24 hours a day, 365 days a year without centralized oversight, circuit breakers, or holiday closures, crypto markets never experience traditional closing gaps 1549. Because a Bitcoin 50-day moving average represents a true, continuous, unbroken flow of 50 days of global price data, the mathematical lines are technically cleaner and less distorted than in stock markets 15.
However, this purity is offset by extreme, systemic volatility. Blue-chip stocks might move 1% to 3% in a day, while major cryptocurrencies regularly experience 5% to 10% daily swings, with smaller altcoins frequently seeing 20% fluctuations 49. This means that a tight 20-day average, which works perfectly as support for a stable S&P 500 stock, will be violently violated constantly in crypto markets 15. Crypto swing traders often have to utilize longer periods, such as the 50-day or 100-day averages, just to achieve the same smoothing reliability seen in traditional equities 1513. Furthermore, due to the blistering speed of sentiment shifts and momentum breakouts in digital assets, the Exponential Moving Average is vastly preferred over the Simple Moving Average to avoid being fatally late to aggressive trends 61713.
| Asset Class | Market Structure & Operating Hours | Preferred Moving Average Variations | Core Swing Trading Strategy Focus |
|---|---|---|---|
| Equities (Stocks) | Fixed hours (e.g., 9:30 AM to 4:00 PM ET), frequent overnight price gaps, moderate daily volatility. | 20-day, 50-day, and 200-day SMAs. | Gap and breakout analysis; heavily utilizing the 50-day SMA as a firm institutional support level for pullback entries. |
| Forex (Currencies) | 24/5 global cycle, massive liquidity, volatility driven by central banks and session overlaps. | 20-period EMA combined with 50-period SMA. | Filtering noise across overlapping global sessions (Asian, European, US) using multi-timeframe crossover alignment. |
| Cryptocurrency | 24/7 continuous trading, extreme systemic volatility, zero overnight or weekend gaps. | 50-period, 100-period, and 200-period EMAs. | Utilizing fast EMAs to react to rapid sentiment flips, and widening average periods to survive deep, volatile pullbacks. |
Risk Management: Stop-Loss Placement and Order Mechanics
Because false signals are mathematically unavoidable and moving averages provide no inherent risk management on their own, the long-term survival of a swing trader depends entirely on strict capital preservation protocols 153039. A widely adopted rule of thumb within the trading community is to risk no more than 1% to 2% of total account capital on any single trade setup 339. This rigorous position sizing ensures that a string of whipsaw losses in a choppy market does not result in catastrophic account ruin 3.
Moving averages play a vital structural role in enforcing this discipline by providing logical, objective locations for stop-loss orders. When a trader buys an asset bouncing off a 50-day moving average, they are operating under the fundamental thesis that the moving average will hold as structural support. If the price breaks decisively below that line, the trade thesis is invalidated, and the trader must immediately exit to prevent a small loss from ballooning into a major drawdown 145354.
Surviving the "Stop Hunt"
However, blindly placing a stop-loss order at the exact price level of the moving average is widely considered a severe tactical error 14. Because thousands of retail traders place their stops at these incredibly obvious technical levels, institutional algorithms frequently exploit this liquidity. Prices will often dip just below a major moving average, intentionally triggering a cascade of retail automated sell orders in a phenomenon known as a "stop hunt," before violently reversing back into the prevailing uptrend, leaving retail traders with a loss while the asset soars without them 14.
To survive this engineered market turbulence, swing traders must place their protective stops at a calculated distance below the moving average, or tucked safely below the most recent structural swing low 14121455. To determine this precise buffer distance objectively, many professionals incorporate the Average True Range (ATR). The ATR is a technical indicator that measures the asset's recent daily volatility 145456. If a highly volatile tech stock routinely swings $4 a day, placing a stop loss just $0.50 below the 50-day moving average practically guarantees the trader will be stopped out prematurely by standard intraday noise. By setting the stop loss at a specific multiple of the ATR (e.g., 2x or 3x the daily ATR) below the moving average, the trader ensures the position has enough breathing room to absorb normal market fluctuations while still protecting against a genuine, structural trend reversal 145556.
The Mechanics of Execution
When executing these protective exits, the specific mechanics of the brokerage platform matter immensely. The type of order a trader selects forces a distinct trade-off between guaranteed execution and guaranteed price.
A standard stop-loss order remains dormant until the asset's price hits the trigger level. Once triggered, it instantly becomes a market order, guaranteeing that the position will be sold 5729. However, it offers absolutely no control over the final execution price. This can be dangerous if catastrophic news hits overnight; the asset might close at $100, gap down on the morning open to $80, and the standard stop loss (set at $95) will trigger and sell the shares at $80, resulting in far steeper slippage than anticipated 2930.
Conversely, a stop-limit order ensures strict price protection by converting into a limit order once triggered. The catch is that if the market plunges violently straight past the limit price, the order will simply sit unfilled on the books, leaving the trader trapped holding a rapidly depreciating asset during a crash 5729. This is the primary reason many inexperienced traders falsely believe their stop-loss systems "failed" 29.
To solve the problem of locking in gains as a successful swing trade moves favorably, traders often utilize trailing stops. A trailing stop automatically adjusts upward behind the rising price at a fixed percentage or dollar amount. If the asset climbs, the stop climbs with it, securing profits. If the asset turns and falls by the predetermined amount, the stop triggers and sells the position 145629. This "Belt and Suspenders" approach - combining an initial fixed stop-loss below a moving average with a trailing stop that activates once the trade is deeply profitable - protects accumulated gains while removing the psychological burden of deciding exactly when to sell 56.
Bottom line
Moving averages are indispensable technical tools for swing traders, providing a clear, visual framework to define macroeconomic market trends, locate dynamic support zones, and manage downside risk. By strategically combining highly responsive exponential averages with stable simple moving averages, traders can build objective, rules-based systems that filter out the exhausting noise of daily volatility. However, because these indicators rely entirely on historical data, they are mathematically guaranteed to lag real-time events and will inevitably generate highly destructive false signals when market trends stall into choppy, sideways ranges. To survive over the long term, traders cannot rely on moving averages as predictive crystal balls; they must be paired with strict capital risk management, volatility-adjusted stop-loss buffers, and a deep contextual understanding of broader market environments.