Mean reversion and trend following in swing trading
Financial markets exhibit complex, time-varying behaviors that consistently challenge the Efficient Market Hypothesis. Two of the most dominant statistical anomalies exploited by market participants are mean reversion and trend following. While both phenomena are universally acknowledged across financial literature, their application within a swing-trading horizon - typically defined as positions held between two and twenty trading days - presents unique microstructure challenges, varying payoff distributions, and heavy dependence on prevailing market regimes.
At its core, a mean-reversion strategy assumes that asset prices deviating significantly from their historical averages will inevitably correct back to an equilibrium level 123. It operates on the premise of overreaction, asserting that market participants temporarily push prices too far in response to news or liquidity shocks. Conversely, trend-following strategies operate on the assumption of price persistence 14. These strategies capitalize on underreaction and the slow diffusion of information, forecasting that an established directional move will continue as institutional capital gradually reallocates and herding behavior takes hold 56.
Determining which methodology optimally fits the short-to-intermediate swing-trading horizon requires an exhaustive analysis of behavioral finance theory, cross-sectional asset anomalies, market microstructure frictions, and risk-adjusted performance measurement.
Theoretical Foundations of Market Behavior
The coexistence of mean reversion and trend following within financial markets has prompted extensive theoretical modeling. Rather than viewing these as competing truths, academic frameworks identify them as opposing market behaviors that dominate under different structural conditions and distinct time horizons 18.
Behavioral Drivers of Price Action
Behavioral finance attributes these phenomena to distinct cognitive biases and the interaction of heterogeneous market participants. In their foundational models, researchers such as Barberis, Shleifer, and Vishny (1998) illustrate how the "conservatism bias" causes investors to underreact to new information, leading to a slow, persistent price drift that trend followers can systematically exploit 582. Over time, the "representativeness heuristic" causes these same investors to extrapolate recent trends too far into the future. This creates a severe overreaction that eventually snaps back, establishing the necessary conditions for mean reversion 82.
Similarly, Hong and Stein (1999) proposed a unified theory involving two distinct types of agents: "news watchers" who trade based on fundamental information but fail to extract information from prices, and "momentum traders" who base their trades entirely on historical price changes 23. The slow diffusion of information among news watchers generates an initial fundamental trend. The momentum traders subsequently exploit this trend but inevitably over-extrapolate it, pushing the asset price past its fundamental fair value. The inevitable correction of this mispricing results in long-term reversal 211.
Coexistence of Continuation and Reversal
The classical academic consensus traditionally mapped specific time horizons to distinct price behaviors. Short-term horizons (ranging from a few days to one month) were strictly associated with mean reversion, as documented by Lehmann and Jegadeesh (1990) 124. Intermediate horizons (three to twelve months) were definitively linked to price momentum and continuation, famously codified by Jegadeesh and Titman (1993) 8514. Finally, long-term horizons (three to five years) were associated with the long-term value reversal effect identified by De Bondt and Thaler (1985) 1514.
However, the application of swing trading directly straddles the boundary between short-term reversal and the onset of intermediate momentum. A theoretical price path following a fundamental shock typically demonstrates initial short-term overreaction, a brief reversal, a steady intermediate-term momentum phase, and a eventual long-term value correction 1814. Modern empirical analyses of the swing-trading horizon reveal that these phenomena are far more regime-dependent than initially theorized, requiring deeper granular analysis of liquidity and attention metrics 415.
The Swing Trading Horizon
In the context of swing trading, the holding period typically aligns with the one-week to one-month timeframe. Because historical literature predominantly associated the one-month horizon with the short-term reversal anomaly, retail and institutional traders historically leaned toward mean-reversion strategies for this duration 14. However, recent extensive research reveals that binary time-based classifications are insufficient.
Turnover and Liquidity Divides
A pivotal 2021 study by Medhat and Schmeling documented a striking pattern in both United States and international stock returns: short-term reversal and short-term momentum coexist simultaneously at the exact same one-month horizon 4166. By double-sorting stocks based on their previous month's return and their share turnover, the researchers revealed that the short-term reversal effect is isolated almost entirely within low-turnover, thinly traded stocks 416.
Conversely, heavily traded stocks with high turnover exhibit significant short-term momentum. A strategy buying the previous month's winners and shorting the losers strictly within the highest-turnover decile generated a positive average return of +16.4% per annum, surviving transaction costs and remaining robust across the largest and most liquid equities 4. Meanwhile, the traditional short-term reversal strategy applied to low-turnover stocks generated an equally powerful negative and significant return spread of 16.9% per annum 4. This indicates that momentum strategies are viable for swing traders provided they restrict their universe to high-liquidity assets.
Deviation Salience and Peer Context
Further research into the coexistence of these anomalies introduces the concept of "deviation salience." When a stock's return diverges significantly from its industry peers in a highly visible manner, it tends to attract excessive attention and exhibits short-term reversals 15. Empirical tests show high deviation salience stocks produce a reversal return spread of -1.30% per month 15.
Conversely, stocks with low deviation salience - those moving quietly in a given direction without attracting extreme retail or media attention - display short-term return continuation. These low-salience assets produce a momentum return spread of +1.41% per month 15. This bifurcation provides a critical operational heuristic for swing traders: mean-reversion strategies are statistically favored when assets experience highly salient shocks or extreme news-driven overreactions, while trend-following strategies are statistically favored when applied to assets undergoing less dramatic, steady accumulation 157.
Asset Class Structural Dependencies
The efficacy of mean reversion versus trend following over a swing horizon is not uniform across the financial ecosystem. Different asset classes possess inherent structural properties that predispose them to specific price behaviors 1920.
Foreign Exchange Market Dynamics
Foreign exchange (FX) markets are widely considered to be predominantly mean-reverting. Research from algorithmic platforms indicates that currency pairs spend roughly 70% to 80% of their time in consolidation phases or trading ranges 8. This behavior is structurally enforced by macroeconomic forces; extreme currency devaluations or appreciations threaten national economies, prompting central banks to intervene via monetary policy to stabilize exchange rates within acceptable bands 18.
Consequently, mean-reversion strategies in FX have a theoretical edge in terms of opportunity frequency. Pairs such as EUR/CHF historically trade in tight ranges due to monetary policy interventions, while AUD/NZD represents a matched economic profile (commodity-based, similar interest rate environments) making them ideal candidates for strategies that fade deviations from the mean 208.
Equities and Commodity Structures
In contrast, equities and commodities exhibit stronger trending tendencies. Corporate earnings growth, macroeconomic cycles, sector rotation, and investor herding behavior allow stock trends to persist directionally for months or years 16. Trend-following algorithms can successfully probe for directional breakouts in indices like the S&P 500, which offer unmatched liquidity and structural upward drift over time 1. While mean reversion can be applied to equities, it is most frequently utilized as a counter-trend strategy during broader bull markets - buying the "oversold" dips within an overarching uptrend 9.
Commodities are similarly driven by physical supply and demand imbalances, geopolitical shocks, and delivery constraints, forcing them into prolonged directional trends 1920. Academic studies testing time-series momentum across numerous futures contracts confirm that applying trend-following systems to commodities yields substantial returns with low correlation to traditional equity risk factors 1910.
Statistical Regime Identification
Because no single asset class remains in a permanent state of trending or ranging, quantitative traders deploy mathematical regime filters to dynamically toggle between mean reversion and trend-following systems 2425.
One common metric is the Durbin-Watson statistic, which detects autocorrelation in asset returns. A value of exactly 2 indicates no autocorrelation. Values less than 2 indicate positive autocorrelation (trendiness), suggesting momentum strategies should be deployed. Values greater than 2 indicate negative autocorrelation, heavily favoring mean reversion 26. Similarly, the Average Directional Index (ADX) quantifies trend strength. An ADX reading above 25 dictates the use of a trend-following logic. Conversely, an ADX below 18 implies a range-bound market, signaling that mean-reversion systems will yield superior results 24.
| Asset Class Environment | Dominant Structural Regime | Core Market Driver | Recommended Swing Methodology |
|---|---|---|---|
| Foreign Exchange (FX) | 70-80% Range-bound | Central bank intervention, matched monetary policies. | Mean Reversion (RSI fading, Bollinger Band borders) 208. |
| Large-Cap Equities | Highly Directional | Earnings momentum, institutional capital flows. | Trend Following (Short-term momentum on high turnover) 164. |
| Small-Cap Equities | Mean-Reverting | Low liquidity, slow information diffusion, retail overreaction. | Mean Reversion (Highly sensitive to transaction costs) 4166. |
| Commodities | Cyclically Directional | Supply/demand imbalances, geopolitical shocks. | Trend Following (Time-series momentum models) 1920. |
Return Distributions and Performance Metrics
A fundamental error in comparing mean reversion and trend following is relying solely on raw returns or elementary win rates. The two strategies produce vastly different return distributions, necessitating advanced risk-adjusted performance metrics for accurate evaluation 2711.
Win Rates and Payoff Asymmetry
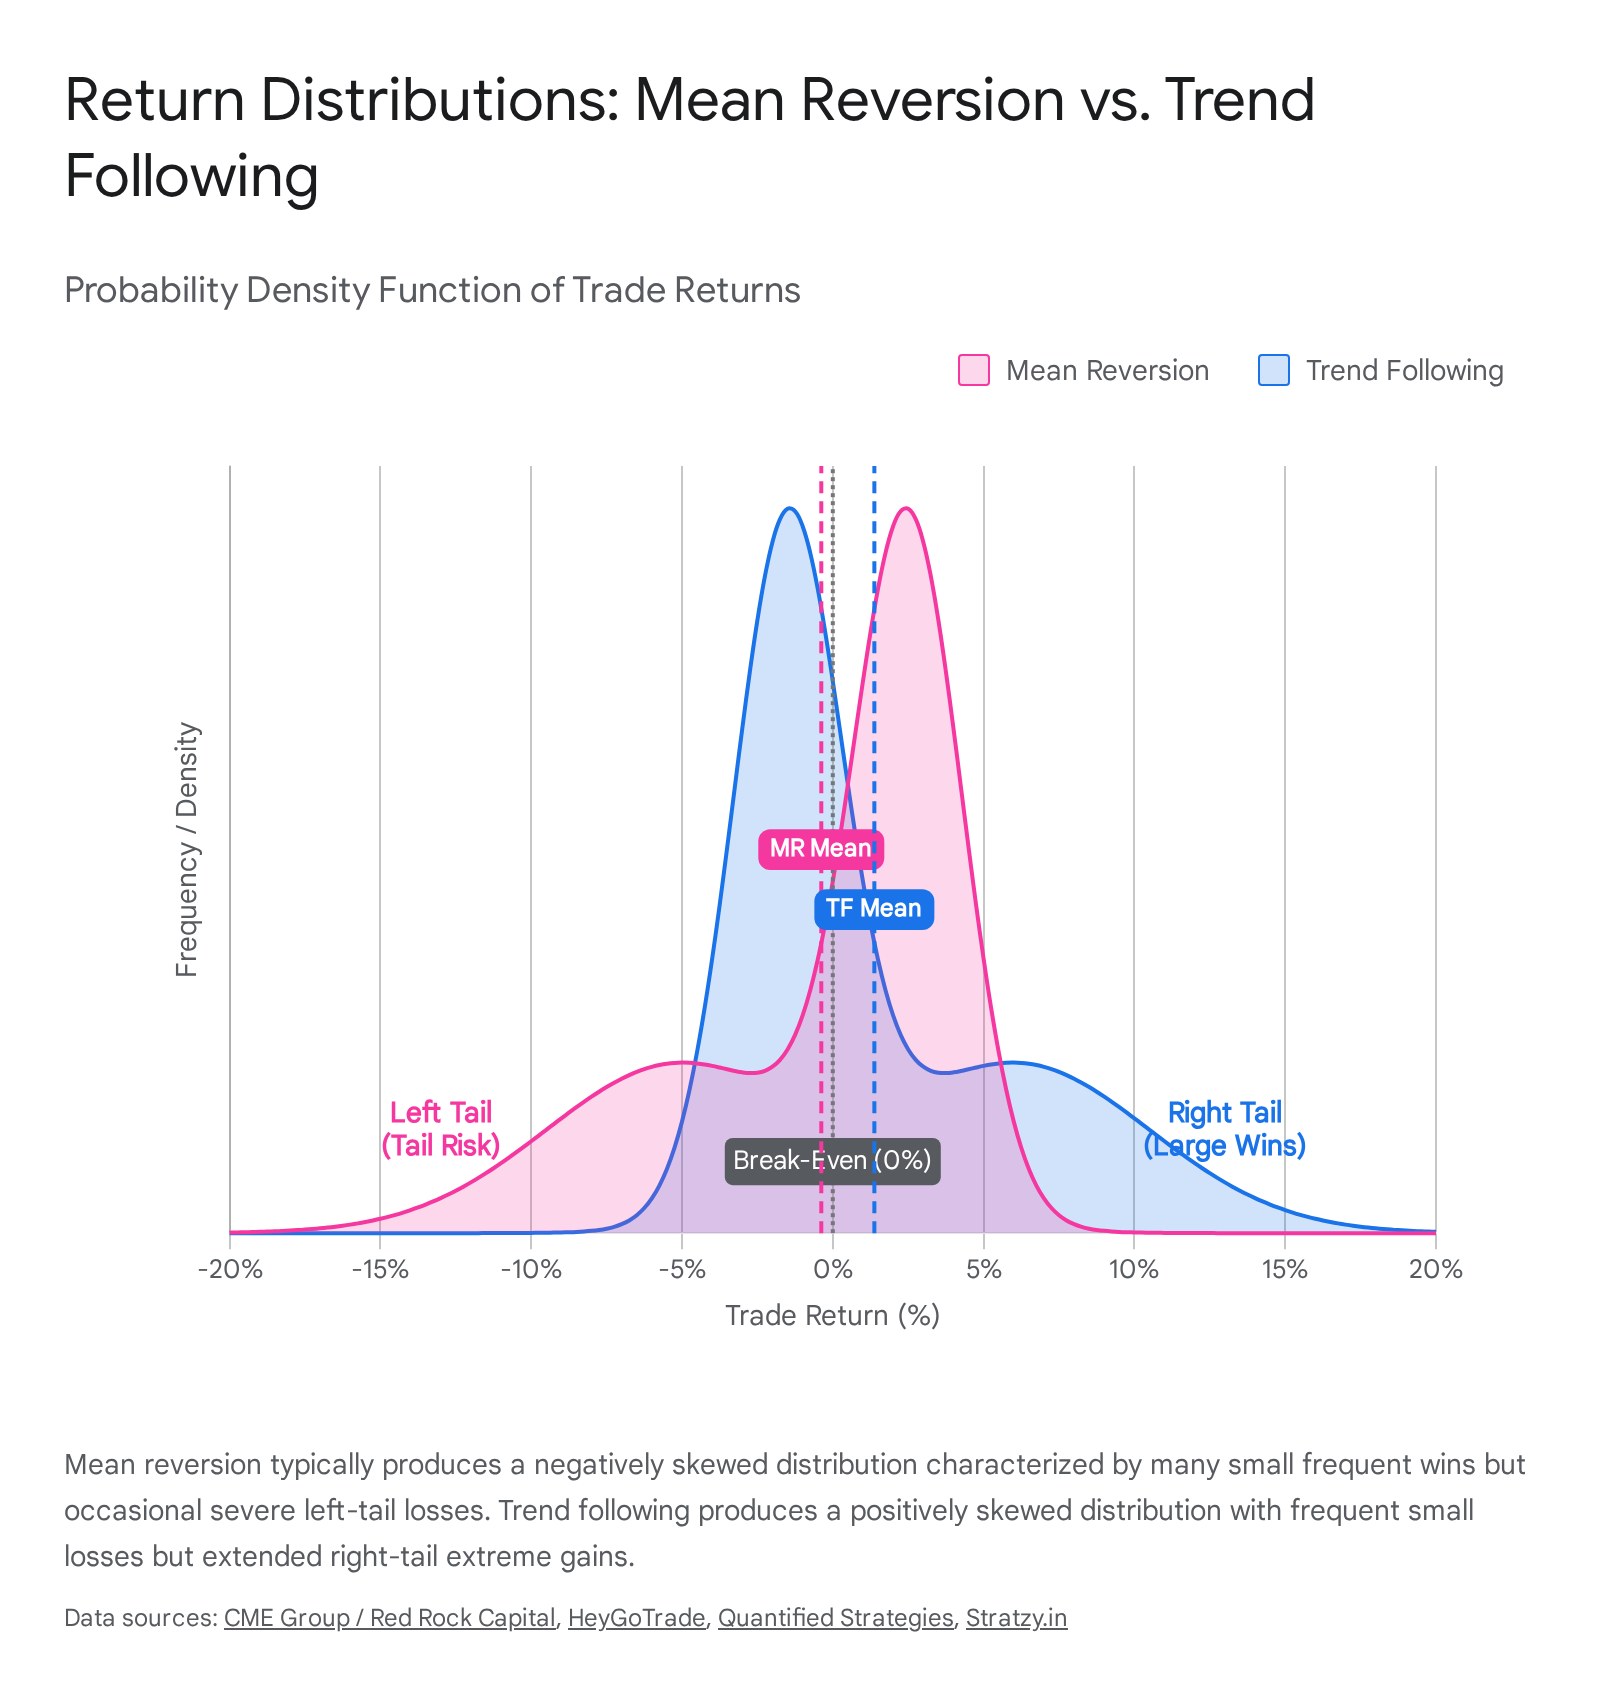
Mean-reversion systems are characterized by exceptionally high win rates, frequently ranging from 70% to 85% 2311. Because the strategy fades extremes and relies on prices returning to a statistical average, traders secure frequent, small profits 312. However, the payoff ratio (average win divided by average loss) is heavily skewed negatively. When a mean-reversion trade fails - such as when an asset breaks out into a severe, prolonged trend - the resulting loss can wipe out weeks of accumulated small gains, representing significant left-tail risk 238.
Trend following exhibits the exact opposite profile. Win rates are notoriously low, often settling between 30% and 40% 311. Trend followers willingly endure a barrage of minor losses resulting from false breakouts and whipsaw price action in ranging markets 6. The strategy's profitability hinges entirely on catching a minority of massive, persistent price moves, resulting in a highly positive payoff ratio that relies on extreme right-tail returns 2311.
Risk Evaluation Constraints
The standard metric for evaluating risk-adjusted returns across the financial industry is the Sharpe Ratio, which divides excess return by total standard deviation 301314. However, institutional research indicates that the Sharpe ratio is a flawed metric for comparing swing-trading styles that exhibit structural skewness 14.
Because the Sharpe ratio penalizes upside and downside volatility equally, it artificially deflates the performance of trend-following strategies 131433. A trend-following strategy that experiences massive outlier positive returns will have an inflated standard deviation in the denominator, resulting in a lower Sharpe ratio 14. Removing the largest positive returns actually increases the Sharpe ratio, which is mathematically nonsensical for an investor seeking absolute return 14. Conversely, mean-reversion strategies often display high Sharpe ratios during quiet regimes because their volatility is muted, masking the latent left-tail risk that occurs when the mean-reversion model fails 11.
Advanced Measurement Paradigms
To rectify the limitations of standard deviation, quantitative analysts rely on the Sortino Ratio. The Sortino calculation utilizes downside deviation rather than total standard deviation, penalizing a strategy only for returns that fall below a specified target (often zero or the risk-free rate) 131433.
For positively skewed trend-following strategies, the Sortino ratio provides a vastly more accurate picture of risk-adjusted performance, routinely scoring higher than the Sharpe equivalent 1114. For mean-reversion strategies, the Sortino ratio may reveal severe fragility, as the strategy's rare but violent drawdowns heavily penalize the downside deviation denominator 11. Additional metrics critical for swing traders include the Calmar Ratio, which divides the compound annual growth rate (CAGR) by the Maximum Drawdown to highlight capital impairment depth, and the Ulcer Index, which measures both the depth and duration of drawdowns 11333435.
Market Microstructure Frictions
While academic backtests frequently demonstrate staggering theoretical alphas for short-term swing strategies, the translation to live trading is fraught with market microstructure frictions. The profitability of mean reversion and trend following diverges sharply when exposed to the realities of transaction costs, slippage, and market impact 615.
Transaction Costs and Turnover Constraints
Short-term mean-reversion anomalies are highly susceptible to cost erosion because they intrinsically require high portfolio turnover. The strategy dictates buying recently oversold assets and selling them just days later upon normalization, repeating the process continuously.
A monumental study by Frazzini, Israel, and Moskowitz examining nearly a trillion dollars of live trading data across 19 developed equity markets proved that the short-term reversal anomaly struggles to survive real-world transaction costs 371617. Because the strongest reversal effects are typically found in small-cap, low-liquidity stocks, executing these trades incurs disproportionately high bid-ask spreads and market impact costs 1663717. When researchers limited the stock universe strictly to highly liquid large-cap stocks and applied sophisticated execution algorithms to minimize turnover, the short-term reversal premium was reduced to a marginal 30 to 50 basis points per week net of costs 37.
Furthermore, modern machine learning models tasked with optimizing portfolio allocation via an "implementable efficient frontier" consistently discard short-term reversal signals in favor of lower-turnover value or momentum characteristics once quadratic transaction costs are fully integrated into the objective function 151819. An empirical study of sector ETFs over a 27-year period reinforced this: while overnight and daytime reversal strategies dominated in gross returns, evaluating them under an institutional standard of 1 basis point (bps) per trade left only 13 out of 240 strategy combinations profitable. Under a retail standard of 2 bps, only 7 survived 16.
Order Execution and Slippage Dynamics
Slippage - the difference between the expected price of a trade and the actual execution price - impacts both strategies but in structurally different ways depending on order flow dynamics.
Because mean reversion requires entering trades precisely when the market is accelerating in the opposite direction, limit orders are often run over, and market orders suffer severe adverse selection 4243. Tests of mean-reversion systems on decentralized prediction markets like Polymarket show that while passive limit-order execution generates substantial alpha, performance degrades significantly when aggressive market orders are utilized 42. Professional execution requires sophisticated partial fills and hidden orders to accumulate positions without moving the market against the setup 43.
Trend followers entering on momentum breakouts face "liquidity fragmentation." When a major resistance level is broken, a surge of market orders consumes the available order book depth, resulting in execution slippage 643. However, because trend-following relies on capturing a massive overarching move that may run for hundreds of basis points over several weeks, the initial entry slippage represents a proportionally smaller drag on total trade profitability compared to a mean-reversion trade hunting for a tight 2% correction 43.
The Impact of Borrow Fees
A largely overlooked factor that structurally handicaps mean-reversion swing trading in equities is the asymmetrical cost of short-selling. Mean reversion theoretically requires equal participation on both sides of the market: buying the oversold (long) and selling the overbought (short). However, executing the short side introduces severe friction via the stock borrow fee 4344.
The Shadow Dividend Penalty
To short an overextended stock, a trader must locate and borrow shares, compensating the lender with an annualized interest rate assessed daily. Fees range from 0.25% for highly liquid stocks to over 100% annually for "hard-to-borrow" heavily shorted securities 4344.
Academic studies published between 2024 and 2026 reveal that the "shadow dividend" of the stock borrow fee almost entirely consumes the alpha generated by shorting overvalued assets 20. Short sellers are highly accurate in identifying stocks ripe for mean reversion - high borrow fees strongly correlate with impending stock declines 44. However, as demand to short the asset increases, the borrow intensity spikes, driving the fee so high that the net return of the trade drops to near zero 4420.
Strategic Adjustments for Capital Allocators
If the supply of lendable shares contracts - such as through the direct registration of shares (DRS) by retail investors or institutional hoarding - borrow fees skyrocket, making the short leg of a mean-reversion system mathematically unviable 2122. Aggregate borrow intensity has even been identified as a reliable sentiment indicator; tightening of short constraints routinely precedes negative subsequent market returns 22.
As a result, researchers suggest that long-only swing traders should use borrow fees as an exclusion filter - avoiding holding stocks with high borrow fees - rather than attempting to actively short them to capture a reversal 4420. In contrast, trend-following strategies focused on long-only momentum breakouts completely bypass the drag of borrow fees, making them inherently more scalable and easier to implement across diverse regulatory environments 44.
Institutional Portfolio Integration
Given the distinct vulnerabilities of both systems - mean reversion dying to transaction costs and trending markets, and trend following suffering brutal drawdowns in choppy environments - quantitative practitioners rarely restrict themselves to a single methodology. Instead, they engineer multi-strategy portfolios that run both logic sets concurrently 8825.
Multi-Strategy Portfolio Allocation
The mathematical justification for this integration is correlation. The return streams of a pure trend-following system and a pure mean-reversion system are largely uncorrelated, meaning they thrive in mutually exclusive market environments 825. At the portfolio level, combining them yields a powerful smoothing effect on the overarching equity curve.
Professional portfolio research utilizing algorithms like PSI5 demonstrates that allocating capital evenly across both strategies produces a significantly higher Sharpe and Sortino ratio than either component run in isolation 25. During extended directional moves, the trend-following component provides "crisis alpha" and massive capital expansion. During the 70% of the time markets spend grinding sideways, the mean-reversion component generates consistent yield, offsetting the minor whipsaw losses sustained by the trend-following system 25.
Temporal and Asset Class Diversification
The critical prerequisite for successful integration is maintaining strict separation of the decision planes 25. A standard retail error is observing a single chart and allowing the trend and reversal algorithms to generate conflicting signals, leading to psychological paralysis, discretionary overriding, and ultimately, strategy drift 25.
Institutional implementation resolves this by strictly separating the capital allocations and time horizons. One sub-portfolio trades exclusively medium-term momentum breakouts (utilizing 3 to 12 months lookback periods) on highly liquid indices, while another simultaneously trades short-term mean reversion (1 to 5 days) on non-correlated assets or range-bound foreign exchange pairs, bypassing signal conflict entirely 4825. Ultimately, the determination of whether mean reversion or trend following optimally fits a swing-trading horizon is not an absolute choice; it is a highly conditional framework dependent on liquidity, asset class, and execution capabilities.