What Is Swing Trading and How Does It Work
Swing trading is an active, technical-driven investment strategy designed to capture short-to-medium-term price movements - lasting anywhere from a few days to several weeks - within a broader overarching market trend 1232. At its core, the baseline risk of swing trading is its holding period. Because positions are held overnight and over weekends, practitioners are inherently exposed to unpredictable market gaps caused by after-hours earnings reports, macroeconomic data releases, or geopolitical events that can instantly invalidate meticulously planned risk management parameters 537.
The proliferation of zero-commission mobile brokerage applications has fundamentally altered the modern retail investing landscape 89. By gamifying the user experience and stripping away the visible friction of per-trade transaction fees, these platforms have fostered an illusion of ease, drawing tens of millions of novice market participants into highly active, leveraged trading strategies 894. However, the frictionless nature of swiping a smartphone screen to buy or sell a security masks the profound mathematical and psychological complexity required to consistently extract alpha from the financial markets.
To conceptualize the mechanics of swing trading, it is useful to employ a surfing analogy. Financial markets rarely move in straight, uninterrupted linear trajectories; instead, asset prices undulate in a constant series of peaks and troughs, driven by the continuous, oscillating push and pull of global supply and demand 123. A traditional buy-and-hold investor is akin to someone waiting patiently on the beach for the tide to slowly rise over the course of years or decades. A high-frequency day trader, conversely, is fighting the chaotic, rapid micro-currents near the shoreline, entering and exiting the water within seconds or minutes. A swing trader acts as a surfer. The objective is not to manufacture the wave, nor to ride the entire ocean current across the sea, but to paddle into the market just as a specific structural wave begins to form at a trough, ride the momentum of the upswing, and exit the position near the crest before the wave inevitably breaks and crashes back down 132.
How Do the Mechanics of a Market Swing Actually Work?
While fundamental analysis evaluates a company's intrinsic value based on earnings reports, revenue growth, macroeconomic conditions, and executive leadership, swing trading is overwhelmingly, and sometimes exclusively, dependent on technical analysis 12311. Technical analysis is the rigorous study of historical price action and volume data to forecast future price movements. It operates on the foundational premise that all known fundamental variables are instantly priced into the asset by efficient markets, and that human psychology - driven by recurring cycles of fear and greed - creates identifiable and repeatable geometric market patterns 11112.
The core mechanic of swing trading requires identifying an intermediate trend and executing trades at the inflection points of that specific trend 3211. Financial markets continuously transition between accumulation phases where institutional money quietly consolidates assets, mark-up phases which represent visible uptrends, distribution phases where institutions begin unloading their holdings, and mark-down phases representing clear downtrends. Swing traders seek to capitalize aggressively on the mark-up and mark-down phases by finding precise entry and exit timing.
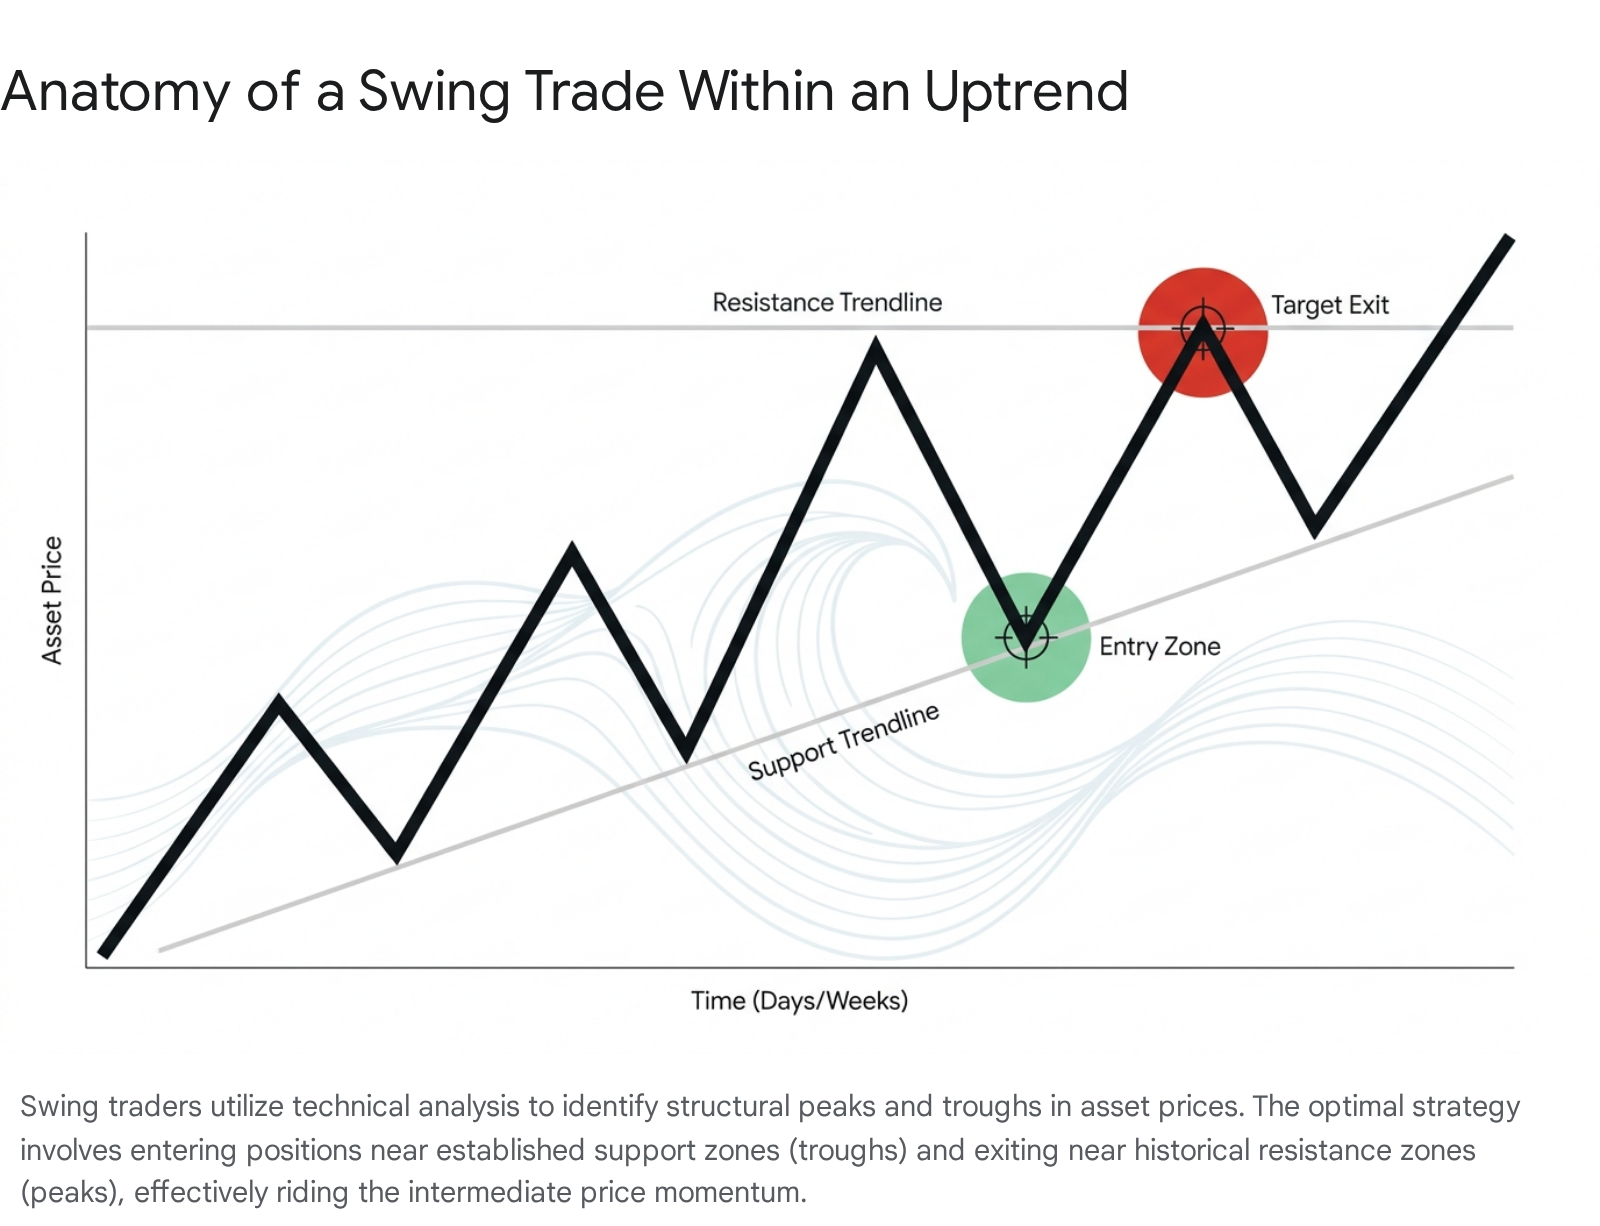
When a security is in a healthy mark-up phase, it does not rise linearly. Instead, it creates a stair-step sequence of higher highs, known as peaks, and higher lows, known as troughs 21113. The troughs are created by demand zones. These are specific price levels where a critical mass of buyers historically perceives deep value and enters the market, overwhelming any residual selling pressure. In technical parlance, this established floor is known as a level of "support" 21314. Conversely, peaks are created by supply zones. These are price levels where buyers become exhausted, momentum wanes, and existing holders begin to sell off their shares to realize profits. This naturally formed ceiling is known as a level of "resistance" 21314.
A standard long swing trade setup involves waiting patiently for an asset in an established uptrend to experience a short-term pullback, drifting downward toward a historically verified support level. The trader observes the price action at this boundary to confirm that the support level is holding firm - often termed "buying the bounce" - and enters the long position as the asset reverses upward 21314. A target exit price is immediately established near the previous peak or resistance zone, while a strict stop-loss order is placed slightly below the support level to automatically liquidate the position and cap the downside if the market structure unexpectedly breaks 223.
To mathematically remove subjectivity from chart reading, professional swing traders employ a myriad of technical indicators, overlaying calculations onto price charts 12. Moving averages, for instance, smooth out chaotic daily price volatility to reveal the underlying trend direction. Swing traders frequently utilize the 20-day, 50-day, 90-day, and 200-day Exponential Moving Averages (EMA), as these lines act as highly reliable dynamic support and resistance levels 1215. An asset that consistently finds heavy buying volume whenever its price dips to the 50-day moving average presents a highly probable swing trading setup 15.
Furthermore, traders rely on momentum oscillators such as the Relative Strength Index (RSI). The RSI measures the velocity and magnitude of directional price movements on a scale from 0 to 100 1215. Traditionally, an RSI reading above 70 indicates that an asset may be overbought and due for an immediate pullback, whereas a reading below 30 suggests the asset is oversold and primed for an upward bounce. Swing traders actively hunt for RSI divergences - instances where the price makes a new low, but the RSI makes a higher low - as an early warning signal that the prevailing trend is losing internal momentum and a reversal swing is imminent 1. Similarly, the Moving Average Convergence Divergence (MACD) indicator maps the relationship between two moving averages, typically the 12-period and 26-period EMAs 215. When the primary MACD line crosses above the signal line, it triggers a bullish entry signal; when it crosses below, it triggers a bearish exit or short-sale signal 15.
Swing traders also heavily rely on charting geometric patterns to anticipate future price action 2316. Bull flags and pennants are common continuation patterns that occur after a steep, rapid price increase representing the flagpole, after which the asset consolidates in a narrow, downward-sloping channel representing the flag itself 311. Swing traders purchase the asset the precise moment the price breaks out above the upper resistance line of the flag, anticipating a volatile continuation of the prior uptrend 11. Additionally, ascending and descending triangles offer predictive insight; an ascending triangle features a flat upper resistance line and a rising lower support line, indicating that buyers are becoming increasingly aggressive and willing to purchase at incrementally higher prices 16. A massive reversal pattern is the head and shoulders, which consists of three peaks, with the middle peak being the highest 216. A break below the "neckline" connecting the troughs of this pattern definitively signals a structural shift from an uptrend to a downtrend, prompting swing traders to exit long positions and initiate aggressive short sales 16.
Traders also utilize Fibonacci retracements, drawing horizontal lines based on the mathematical ratios of 23.6%, 38.2%, 50%, and 61.8% between a significant peak and trough 211. These mathematically derived levels frequently act as hidden support and resistance lines, guiding traders on where to expect pullbacks to terminate before the primary trend resumes 11.
Is Swing Trading a Viable Source of Passive Income?
A pervasive and damaging misconception, heavily propagated by social media influencers and aggressive financial marketing campaigns, is that active trading serves as a reliable stream of "passive income." This is an outright fallacy. Swing trading is an intensely active, labor-intensive pursuit that demands a rigorous professional workflow to achieve any semblance of consistency 71718. Attempting to generate passive income through active market speculation fundamentally misunderstands the mechanics of both concepts.
While swing trading is decidedly less frenetic than high-frequency day trading - where participants are glued to Level II order books and one-minute charts from the opening bell to the market close - it is far from a simple endeavor 157171920. The actual execution of buying and selling takes mere seconds, but the requisite preparation takes hours. A disciplined swing trader typically commits a minimum of four to five hours per week exclusively to foundational market analysis, often condensing this intensive work into weekend charting routines and evening review sessions 1718.
This workflow involves meticulously scanning hundreds of stock charts to identify favorable technical setups, reading broader macroeconomic reports to gauge overall market sentiment, and reviewing corporate earnings calendars to ensure they do not accidentally hold positions through highly volatile and unpredictable announcements 717185. Furthermore, before placing a single order, the trader must calculate precise risk-to-reward ratios, establishing exactly where their stop-loss will be triggered and where their profit targets lie 217.
During the active trading week, swing traders must dedicate daily time to monitor their open positions 5. This includes adjusting trailing stop-loss orders to lock in profits as a trade moves in their favor, evaluating overnight news that may impact global futures markets, and continuously determining whether a shifting technical landscape invalidates their original thesis 71822. If trading is not treated as a rigorous business operation with strict risk management parameters, it devolves into little more than expensive, emotionally driven entertainment 7.
Beyond the temporal commitment, the hidden and often severe cost of swing trading is psychological and physical. Human neurobiology is fundamentally ill-equipped for the probabilistic and chaotic environment of financial markets 12. Active trading requires constant decision-making under conditions of extreme uncertainty, where every position demands a judgment call on direction, timing, position sizing, and exit criteria 7.
Over time, the chronic stress of carrying overnight exposure - watching international futures markets fluctuate while trying to sleep, or waking up to discover a position has gapped down 15% due to an unpredictable macroeconomic event - causes severe decision fatigue and sleep disruption 3723. This emotional exhaustion leads to systemic physical burnout, manifesting in screen fatigue, eye strain, and musculoskeletal tension from hours spent analyzing terminal data 23. Traders suffering from such burnout frequently abandon their pre-defined strategies, falling victim to revenge trading by taking outsized, irrational risks to immediately win back a loss, or suffering from paralyzing fear that prevents them from executing valid, high-probability setups 712. Therefore, categorizing swing trading as a passive endeavor vastly underestimates the profound emotional and physical capital required to survive inevitable market drawdowns.
How Does Swing Trading Compare to Day Trading and Buy-and-Hold Investing?
To properly contextualize swing trading, it must be evaluated directly alongside the two other primary market engagement strategies: day trading and long-term buy-and-hold investing. Each approach operates on fundamentally different timescales, requires different capital efficiencies, and targets distinct psychological profiles.
| Comparison Criteria | Day Trading | Swing Trading | Buy-and-Hold (Investing) |
|---|---|---|---|
| Time Horizon | Minutes to Hours 5195 | Days to Weeks 5195 | Years to Decades 24 |
| Trade Frequency | High (Often 60-200+ trades/month) 5 | Moderate (Typically 5-15 trades/month) 5 | Low (Periodic rebalancing) 24 |
| Primary Analysis | Strictly Technical & Intraday Order Flow 195 | Technical analysis combined with macro/fundamentals 1195 | Deep Fundamental Analysis & Macroeconomics 1 |
| Overnight Risk | None (All positions closed daily) 5195 | High (Exposed to off-hours news and market gaps) 1537 | Absolute (But mitigated by long-term time horizons) |
| Time Commitment | Full-time; constant screen monitoring 5175 | Part-time; 4-5 hours/week for scanning and management 517185 | Minimal; occasional portfolio review 17 |
| Tax Treatment (US) | Short-Term Capital Gains (High ordinary income rates) 256277 | Short-Term Capital Gains (High ordinary income rates) 725627 | Long-Term Capital Gains (Preferential lower rates) 25627729 |
| Capital Efficiency | Highly leveraged; requires high margin maintenance 3524 | Moderate margin use; less capital intensive per trade 524 | Fully funded; margin generally avoided 89 |
Day trading is highly aggressive, relying on massive leverage to capture minute fractional price movements. Because day traders meticulously close all positions before the market rings the closing bell, they entirely eliminate overnight gap risk 519524. However, this safety comes at the cost of intense, uninterrupted screen time, demanding split-second execution and an ironclad psychological constitution to manage intraday volatility without emotional capitulation 53.
Swing trading offers a broader compromise. It allows participants with standard full-time employment to engage in active market speculation without needing to monitor tick-by-tick data 17185. By widening the time horizon, swing traders seek to capture much larger percentage moves than day traders, reducing the sheer frequency of transactions required to generate meaningful returns 51932.
Conversely, buy-and-hold investing ignores daily and weekly price fluctuations entirely. Investors rely on the long-term, structural appreciation of global equities and compounding interest, focusing exclusively on corporate fundamentals and broad economic expansion over decades 1724.
What Are the Hidden Execution Costs and Tax Burdens?
When an aspiring swing trader reviews a pristine historical stock chart, they are looking at a theoretical, frictionless environment. In reality, the execution of trades is subjected to intense mechanical drag and heavy government taxation. These hidden costs severely degrade net profitability, requiring active traders to outperform the broader market by a significantly wide margin simply to break even 7.
Mechanical frictions manifest primarily through the bid-ask spread and slippage. Commission-free brokerage accounts do not equate to cost-free trading 7. Brokerages and market makers generate immense revenue through payment for order flow (PFOF) and by capturing the spread 33. The spread is the mathematical difference between the highest price a buyer is willing to pay (the bid) and the lowest price a seller is willing to accept (the ask). When a retail trader enters a market order to buy, they are forced to pay the higher ask price; when they sell, they receive the lower bid price 33. This means that the instant a trade is executed, the trader's account is technically operating at a slight loss. While the spread on highly liquid, mega-cap stocks may be pennies, the spread on small-cap equities or volatile options contracts can be remarkably wide, functioning as a silent, immediate tax on every round-trip transaction 33.
Furthermore, slippage occurs when there is a discrepancy between the expected price of a trade and the actual price at which the broker eventually executes it 33. In fast-moving, highly volatile markets, or when trading illiquid assets, the price can change drastically in the milliseconds between the time an order is placed and when it finally reaches the exchange floor 33. Because market orders prioritize immediate speed over precise pricing, they practically guarantee slippage against the trader 33.
Another monumental mechanical risk is overnight exposure. Because swing traders hold assets for days or weeks, they accept the reality that markets can move violently while they are asleep 537. If a company reports disastrous earnings after the closing bell, or if a severe macroeconomic shock occurs over the weekend, the stock may open the next morning significantly below the previous day's closing price 7. If a swing trader bought a stock at $100 and placed a protective stop-loss order at $95, an overnight gap down to $85 means the stop-loss is entirely bypassed. The order will convert to a market order and execute at the open near $85, turning a calculated 5% risk into a catastrophic 15% capital loss 7.
Perhaps the most insurmountable hurdle for the retail swing trader is the Internal Revenue Service (IRS). In the United States, the taxation of investment profits is heavily dependent on the exact holding period of the asset 25627710. If an investor purchases an asset and holds it for more than one year before selling it at a profit, the gain is classified as long-term. The government actively incentivizes patient capital accumulation by taxing long-term gains at highly preferential rates of 0%, 15%, or a maximum of 20%, depending on the taxpayer's total taxable income and filing status 2562771035.
Because swing trades last mere days or weeks, all profits derived from this strategy are universally classified as short-term capital gains 2562771035. Short-term capital gains receive absolutely no preferential treatment; they are taxed at the trader's ordinary income tax rate, exactly as if the profits were earned as standard W-2 salary 25627710.
Under the 2026 federal tax brackets, ordinary income tax rates are progressive and graduate across tiers of 10%, 12%, 22%, 24%, 32%, 35%, and 37% 2527729103511. For a successful professional or high-earning individual, their marginal tax rate can easily reach the 24%, 32%, or even 37% federal bracket, not including state-level income taxes which can add an additional 5% to 13% depending on their local jurisdiction 2567.
Consider the mathematics of this burden: If a long-term investor generates a $10,000 profit by holding an S&P 500 index fund for two years, and falls into the 15% long-term bracket, their tax liability is $1,500. If a swing trader generates the exact same $10,000 profit through dozens of highly stressful, successful short-term trades, but sits in the 32% ordinary income bracket, their tax liability is $3,200 257. Additionally, active swing traders frequently trigger complex "wash sale" rules. If a trader sells a stock at a loss and repurchases that same stock within 30 days, the IRS disallows the immediate tax deduction of the loss, complicating accounting and deferring necessary tax benefits 7. Consequently, an active swing trader must generate significantly higher gross returns than a passive investor simply to achieve the identical net, after-tax result 7.
How Does the Pattern Day Trader Rule Shape US Retail Strategy?
The operational mechanics of American retail trading are not merely dictated by chart patterns or algorithmic momentum; they have historically been heavily contoured by federal regulations. For the past twenty-five years, one specific regulation has served as the invisible architect of retail trading behavior, effectively forcing millions of traders into adopting swing trading strategies: the Pattern Day Trader (PDT) rule.
In the chaotic aftermath of the dot-com bubble collapse in 2000, federal regulators observed that retail investors using borrowed money (margin) to frequently day-trade volatile technology stocks suffered catastrophic, unrecoverable financial losses 37123913. In an aggressive effort to protect undercapitalized market participants from their own leverage, the Financial Industry Regulatory Authority (FINRA), operating under the overarching oversight of the Securities and Exchange Commission (SEC), enacted the Pattern Day Trader rule on February 27, 2001 3712.
Under the strict provisions of FINRA Rule 4210, a "pattern day trader" was defined as any brokerage customer who executed four or more day trades within five rolling business days inside a margin account, provided those specific trades represented more than 6% of their total trading activity for that five-day period 81415. Once a retail investor met this threshold and was officially flagged with the PDT designation by their broker, they were legally required to maintain a minimum equity balance of $25,000 at the close of every single trading day 812141516. If their account equity fell below this hard $25,000 threshold, the brokerage firm was mandated to issue a margin call and restrict the account from opening any new day-trading positions for 90 days, or until the required funds were fully replenished 371215.
This $25,000 artificial barrier had a profound psychological and operational effect on the retail sector 37131718. Because the vast majority of retail investors possess accounts significantly smaller than $25,000, they were structurally prohibited from legally day trading 244619. Consequently, the US regulatory environment effectively forced millions of undercapitalized retail investors to adopt swing trading as their default, mandatory strategy 24. If an investor purchased a highly volatile stock and it rapidly hit their profit target later that same afternoon, they were frequently forced to hold the asset overnight - needlessly exposing themselves to aftermarket gap risk and potential ruin - simply to avoid registering a day trade and violating the PDT count limit 517.
However, as the retail landscape evolved through the 2020s - defined by the rise of zero-commission trading, fractional share investing, and rapid technological settlement times (T+1) - the archaic and rigid nature of the PDT rule became glaringly apparent 1320. Critics and industry advocates argued it functioned less as a legitimate risk-management safeguard and more as an elitist wealth test, punishing a trader with $24,000 while allowing someone with $25,001 unrestricted access to leverage 1318.
In a watershed moment for market microstructure, the SEC granted accelerated approval to massive amendments to FINRA Rule 4210, which officially took effect on June 4, 2026, though brokers have a phase-in period extending to October 2027 to comply 9121516492122.
The sweeping 2026 regulatory changes effectively dismantled the previous quarter-century framework: 1. Total Elimination of the Designation: The "Pattern Day Trader" designation itself, and the cumbersome practice of tracking four trades in five days, has been entirely abolished 164921. 2. Removal of the $25,000 Barrier: The minimum equity requirement for active intraday trading was slashed from the towering $25,000 limit down to the standard, highly accessible margin minimum of $2,000 16492152. 3. Implementation of Intraday Margin Deficits (IMD): Instead of utilizing blunt account-size tests, brokerages are now required to measure risk dynamically. Firms continuously monitor a client's "intraday margin excess" in real-time. Traders are only constrained by their actual financial exposure and leverage deployed at any given moment, rather than the arbitrary frequency of their trades 9164921.
This 2026 reform fundamentally alters the dynamic between swing trading and day trading for the American populace 171853. Retail investors are no longer artificially mandated to hold positions overnight to circumvent federal limits 1753. While swing trading remains a highly viable and popular strategy due to its accommodating time commitments, the elimination of the PDT rule means traders can now pivot seamlessly between intraday scalping and multi-day holds based purely on technical merit, risk management, and personal schedule, rather than regulatory anxiety 1752.
The global regulatory environment offers an interesting contrast. In the European Union, under the purview of the European Securities and Markets Authority (ESMA), there is no equivalent to the PDT rule limiting trade frequency 54. Instead, ESMA protects retail traders by strictly capping leverage on high-risk instruments like Contracts for Difference (CFDs) 545523. To mitigate disaster, EU regulators restrict retail traders to a maximum leverage of 30:1 for major forex pairs, 20:1 for indices, 5:1 for individual equities, and 2:1 for cryptocurrencies 545523. Furthermore, ESMA enforces mandatory negative balance protection, ensuring that an EU retail trader cannot lose more money than their initial account deposit during a catastrophic market gap, a safeguard not afforded to their American counterparts 545557.
What Do Behavioral Finance Studies Reveal About Retail Trading Success?
The proliferation of online trading communities has created a dangerous echo chamber that loudly broadcasts isolated trading successes, lavish lifestyles, and outsized returns, while quietly burying the overwhelming volume of failures. To objectively evaluate the efficacy of retail swing trading, one must look past anecdotal social media claims and analyze rigorous behavioral finance data and massive empirical academic studies compiled between 2020 and 2025.
The data reveals a stark, sobering reality: the vast, overwhelming majority of retail traders systematically underperform the broader market, and a significant percentage actively destroy their own capital 846245960.
The COVID-19 pandemic served as a massive catalyst, triggering an unprecedented influx of retail capital into the financial markets. Between 2020 and 2021, an estimated 30 million new retail brokerage accounts were opened in the U.S., driving retail volume to an astonishing 25% of all equities trading, effectively doubling their historical market share 9461961. This era was defined by the chaotic meme-stock phenomenon, heavily influenced by platforms like Reddit's WallStreetBets and democratized by zero-commission brokers like Robinhood 9462. Retail traders engaged in rampant speculation, frequently ignoring financial fundamentals to chase momentum.
A seminal 2022 academic study by Barber, Huang, Odean, and Schwarz utilized vast troves of data from the Robinhood platform to examine this new retail behavior 25. Their research found that retail traders utilizing mobile applications suffer from severe, detrimental "attention-induced trading" 4252665. Because there are thousands of publicly traded equities, retail investors lack the institutional capacity to analyze them comprehensively. Instead, their purchasing decisions are disproportionately dictated by whatever happens to grab their immediate attention - specifically, stocks experiencing extreme, unusual volume, heavy media coverage, or those prominently featured on the app's own curated "Top Movers" lists 2665.
Crucially, the Barber and Odean study demonstrated that intense retail herding into these attention-grabbing stocks reliably predicted negative future returns 252665. For example, the researchers found that the top 0.5% of stocks most aggressively bought by Robinhood users on a given day systematically lost approximately 4.7% of their value over the subsequent month 26. The empirical data strongly indicates that mobile-first retail traders, driven by the Fear of Missing Out (FOMO), were frequently buying at the exact peak of a market swing, effectively serving as the exit liquidity for sophisticated institutional investors right before the asset's price collapsed 462665.
The systemic underperformance of the retail sector was further codified in November 2025, when the Journal of Financial Economics published one of the most exhaustive, comprehensive analyses of market participation ever conducted. The study, titled "Taking Sides on Return Predictability," authored by McLean, Pontiff, and Reilly, analyzed the trading patterns of nine distinct market participant groups - including retail investors, hedge funds, mutual funds, short-sellers, and corporations 24592728. They measured these groups against 193 distinct stock return anomalies that academic research has proven historically forecast performance 245927.
The findings of the McLean study were unequivocal. The true "smart money" in the modern financial market consists of corporate insiders and aggressive short-sellers 2459. When companies executed share buybacks, indicating they believed their own stock was undervalued, or when short-sellers heavily shorted an asset they believed was overvalued, those assets reliably moved in the anticipated direction, aligning with the 193 predictive variables 245928.
Conversely, retail investors were identified as having the absolute worst trading record across all nine categories 2427. The study revealed a deeply paradoxical and damaging finding: retail investors systematically traded in the wrong direction relative to predictable market returns 5927. The anomaly variables showed that individual investors actively bought assets with statistically low expected returns and actively sold assets with highly positive expected returns 2459. The authors concluded that the persistent mispricing in the stock market - the very inefficiencies that active swing traders claim they possess the edge to exploit - is often amplified, and actively sustained, by the irrational enthusiasm and systematic errors of retail trading volume 59. Simply put, retail trading systematically loses.
The root cause of this massive underperformance is deeply embedded in human cognition and evolutionary psychology 81262. Behavioral finance points to several powerful cognitive biases that reliably sabotage active trading strategies 812.
Chief among these destructive biases is the Disposition Effect, which is heavily tied to Tversky and Kahneman's Prospect Theory 786268. Prospect theory states that humans feel the psychological pain of a financial loss much more acutely - often twice as intensely - as the joy experienced from an equivalent financial gain (loss aversion) 862. In the fast-paced world of trading, this biological wiring manifests disastrously. When a swing trader holds a position that drops into negative territory, their innate aversion to realizing a permanent loss paralyzes them; they refuse to execute their predetermined stop-loss order, blindly hoping the asset will rebound. Conversely, when a position moves slightly into profit, the intense fear of watching that small gain evaporate back to zero compels them to sell prematurely 71262.
The disposition effect forces untrained traders into the mathematically doomed strategy of cutting winners short and letting losers run to zero - the exact inverse of the discipline required for swing trading profitability 7. Additionally, behavioral phenomena like the "illusion of control" and overconfidence biases frequently lead retail participants to attribute random luck during massive bull markets to their own technical genius. This false confidence prompts them to dramatically increase their position sizing and deploy dangerous amounts of margin leverage right before an inevitable market correction wipes out their accounts 891262. Regulators, including the SEC and FINRA, frequently issue investor alerts warning retail participants of the catastrophic risks of excessive trading, manipulative pump-and-dump schemes on social media, and the dangers of high-volume churning, highlighting how easily retail investors fall prey to market predators 69293031.
While aggregate statistics paint a grim picture - with industry estimates indicating that 80% to 90% of active retail traders fail to outperform passive index benchmarks over time, and up to 40% quitting the practice entirely within their first month - it is scientifically inaccurate to state that success is utterly impossible 74660.
Applying calibrated uncertainty to the data acknowledges that a small, elite minority of retail traders (often cited as the top 1% to 3%) do achieve consistent, long-term profitability 74660. However, what distinguishes this successful cohort is their complete, near-sociopathic detachment from the emotional thrill of trading 712. They do not rely on intuition, social media sentiment, or raw predictive ability 746. Instead, they treat trading as a rigid actuarial science. They build algorithmic, rules-based systems with draconian risk management protocols, never risking more than 1% to 2% of their total account equity on any single trade. They utilize back-tested positive expectancy models, and execute entries and exits mechanically, entirely stripping human emotion, hope, and cognitive bias from the equation 7560. For these individuals, swing trading ceases to be a speculative hobby or a path to passive income, and becomes an elite, highly demanding, and heavily taxed professional discipline.
Bottom Line
Swing trading is an intensive, active methodology that seeks to capture intermediate price trends, bridging the gap between the hyper-active noise of day trading and the passive patience of long-term investing. While the advent of zero-commission brokers has democratized market access, the mechanical ease of executing a trade on a smartphone severely belies the extreme psychological, temporal, and financial friction required to succeed. Retail investors must navigate not only the complexities of technical chart patterns, volatile bid-ask spreads, and heavy short-term capital gains taxation, but also their own hardwired cognitive biases, which naturally push them toward fatal errors like the disposition effect. Furthermore, the sweeping June 2026 elimination of the federal Pattern Day Trader rule has fundamentally altered the U.S. landscape, untethering retail traders from arbitrary account-size barriers while introducing new real-time margin paradigms. Ultimately, rigorous behavioral finance data proves that the vast majority of retail participants systematically underperform the market; however, for the rare, highly disciplined minority who approach it with the rigor of institutional risk management, swing trading remains a viable, albeit incredibly challenging, vehicle for alpha generation.