
How to Spot a Breakout and Avoid False Breakouts
A breakout is structurally confirmed when an asset breaches a defined resistance level on relatively high volume and successfully retests that threshold as new support, initiating a fresh directional trend. Conversely, a false breakout - or "fakeout" - occurs when the price momentarily pierces this key level to trap premature buyers before reversing sharply, a dynamic investors can navigate by analyzing volume profiles, demanding structural retests, and employing rigorous risk-management techniques tailored to the specific asset class.
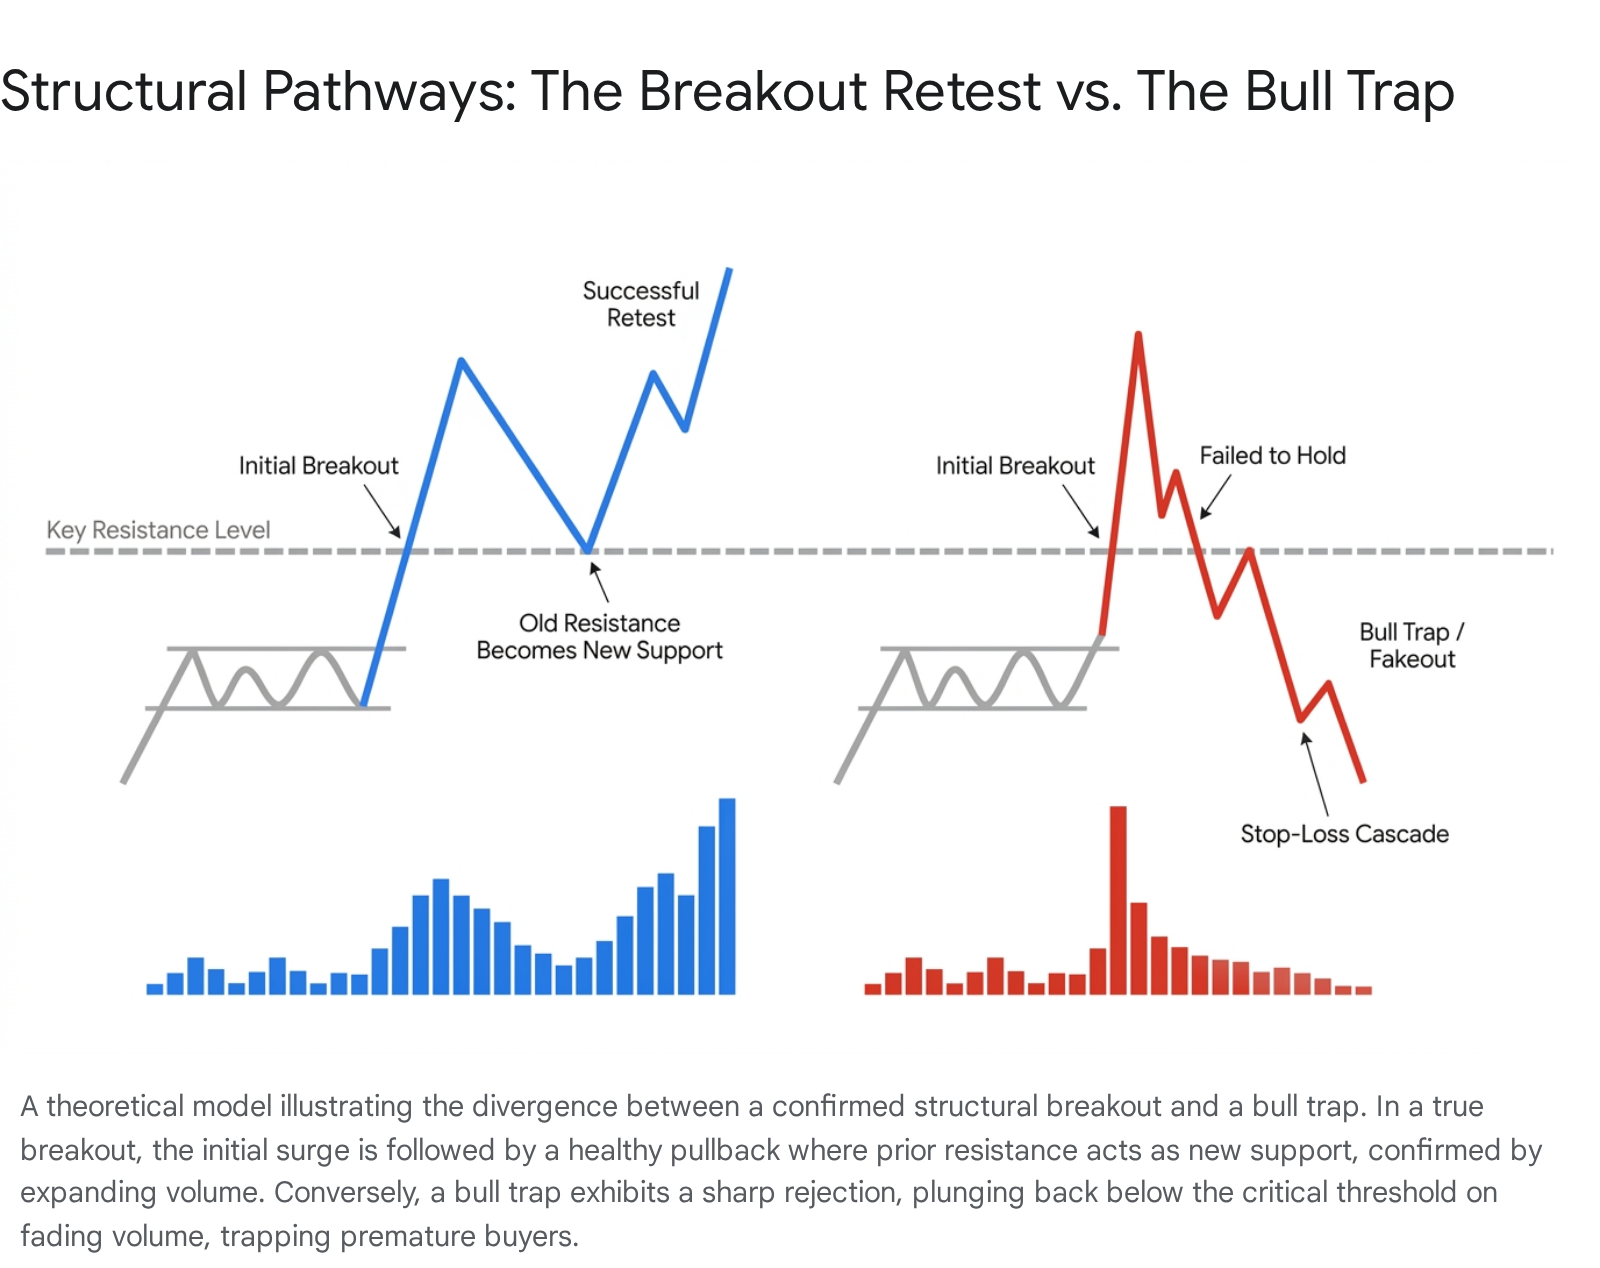
There is perhaps no experience in financial markets more universally frustrating than buying a surging stock as it prints a massive green candle at new highs, only to watch the price instantly stall, reverse, and trigger a stop-loss as the highly anticipated breakout reveals itself to be a meticulously engineered trap.
Think of structural market resistance as a heavy, reinforced oak door: pushing it open requires the immense mass and sustained momentum of aggressive volume. If one merely bumps against it without sufficient underlying force, the door will violently swing back and knock the aggressor flat. A pervasive misconception among retail market participants is that the simple act of a price line crossing a horizontal resistance threshold on a chart guarantees a new, sustained paradigm; in reality, without the requisite volume and structural confirmation, a broken line is often nothing more than an illusion of strength engineered to harvest liquidity.
Understanding the mechanics of price breakouts requires a comprehensive examination of market microstructure, algorithmic execution protocols, and behavioral finance. This report explores the anatomical differences between genuine breakouts and bull traps, evaluates the profound impact of post-2023 high-frequency trading (HFT) on market volatility across both equities and digital assets, and establishes a rigorous, quantitative framework for actionable risk management.
What causes a false breakout?
A false breakout, commonly referred to as a bull trap, is rarely an accident of random market noise; rather, it is frequently the intentional byproduct of structural liquidity dynamics and the predictable behavioral biases of retail market participants 12. To understand what causes a false breakout, one must first examine the mechanics of order flow, the concept of liquidity harvesting, and the continuous double-auction mechanisms upon which modern financial exchanges are built.
In any highly liquid financial market, every executed buy order requires a corresponding sell order, and every seller requires a buyer. Institutional players - such as hedge funds, pension funds, commodity trading advisors, and large asset managers - move capital in sizes that far exceed the available liquidity resting at any single price point on the limit order book. If a large institution wishes to offload a massive long position, executing a simple market order would cause severe negative slippage, consuming all available bids and driving the price down sharply against their own execution average. To avoid this self-inflicted price penalty, institutional algorithms are designed to seek out "pockets" of dense liquidity. They require a sudden surge of incoming buy orders to absorb their massive distribution 13.
This operational necessity is where the psychology of the retail trader is routinely weaponized. Resistance levels - defined by previous price peaks, moving averages, or upper boundaries of a consolidation channel - are highly visible on any standard price chart. Retail traders, heavily influenced by traditional technical analysis literature, are commonly taught to place buy-stop orders just above these resistance levels to catch the momentum of an anticipated breakout. Furthermore, short sellers place their protective stop-loss orders (which are executed as market buy orders) in this exact same territory. Consequently, the area immediately above a major resistance level acts as a dense, highly concentrated pool of resting buy liquidity 3.
A false breakout is initiated when the price is either organically drifting upward or intentionally pushed just above this resistance line 3. As the price breaches the threshold, a cascade of automated buy-stop orders is triggered. This mechanical buying is almost immediately compounded by FOMO (Fear Of Missing Out) market buying from human traders observing the breach 1. This sudden, acute spike in buying pressure provides the exact counterparty liquidity needed by larger institutional players to quietly execute their massive sell orders at premium prices 13.
Because this initial breakout is not fueled by sustained, organic macroeconomic demand but rather by the triggering of resting orders and temporary retail enthusiasm, the buying pressure is transient and quickly exhausts itself. Once the "smart money" finishes distributing its shares into the retail buying frenzy, the order book becomes top-heavy. With no further demand to sustain the elevated prices, sellers aggressively step in, and the price collapses back below the resistance level 12. This sudden reversal effectively traps the late buyers in a rapid drawdown.
The behavioral element following the trap is equally critical. Bull traps play heavily on emotional impulsivity and the subsequent panic of realization 1. A classic false breakout often features a rapid, parabolic price spike accompanied by a seemingly bullish candlestick - such as a large green Marubozu - luring in traders who lack the discipline to wait for structural confirmation. As the price snaps back below the resistance line, the trapped breakout buyers recognize their error and are forced into panic liquidations 2. Their subsequent sell orders add further downward velocity to the asset, creating a self-fulfilling cascade that often pushes the asset back to the lower boundary of its previous trading range.
The Impact of Post-2023 Algorithmic and High-Frequency Trading
The landscape of breakout trading has been fundamentally altered by the proliferation and evolution of algorithmic and high-frequency trading (HFT). The period from 2023 to 2025 marked a significant turning point in market microstructure, characterized by the deep integration of advanced machine learning models, reinforcement learning, and artificial intelligence into quantitative trading strategies 45. These modern algorithms are specifically trained to identify, exploit, and occasionally engineer the very structural traps that ensnare traditional human traders.
Equities Microstructure and Algorithmic Adaptation
In the traditional equities market, HFT has historically been lauded by exchange operators for providing continuous liquidity, narrowing bid-ask spreads, and improving the immediacy of trade execution 68. However, a growing body of peer-reviewed finance papers from the SSRN electronic journal and established institutions highlights a complex dual nature: while HFT enhances market efficiency under normal, quiet conditions, it systematically amplifies short-term volatility and increases the frequency of violent price reversals during critical technical junctures 6.
Post-2023, many legacy algorithmic trading bots that were traditionally tuned to low-volatility or rigid trend-following regimes found themselves obsolete. Markets became increasingly unpredictable due to rapid macroeconomic shifts, complex inflation data surprises, and sudden geopolitical tensions 9. Modern algorithms have adapted by abandoning rigid "if-then" parameterization in favor of dynamic machine learning models capable of analyzing order book imbalances in real-time 5. These systems utilize tactics akin to latency arbitrage and structural spoofing - placing large, non-bona-fide limit orders to create a false illusion of demand or supply, only to cancel them microseconds before execution 5.
In the specific context of equity breakouts, algorithms continuously monitor order book depth and Level II data. If a sophisticated algorithm detects a massive cluster of retail buy-stops resting just above a technical resistance level, it may aggressively buy the asset to push the price through the threshold, trigger the cascade of retail stops, and instantaneously reverse its position to sell into the resulting liquidity spike. This microstructural phenomenon explains why low-volume breakouts in modern equity markets fail at staggering rates. Research indicates that breakouts occurring on volume below the 20-day average fail at a rate of 77% across major equity indices, confirming that without sustained institutional sponsorship, a technical breach is highly vulnerable to algorithmic exploitation 3.
The consequences of this algorithmic dominance extend to market elasticity. The use of unsupervised AI traders that react hyper-sensitively to aggregate market elasticity can reduce the exposure to risky assets during downturns, effectively withdrawing liquidity exactly when human traders need it most to exit failing breakout positions 4. This withdrawal of algorithmic liquidity exacerbates the speed and severity of the post-fakeout price collapse.
The Divergence: Equities vs. Cryptocurrency
While HFT-induced fakeouts are prevalent in equities, the frequency, magnitude, and velocity of these events are exponentially magnified in the cryptocurrency markets. The structural divergence between these two asset classes dictates the severity and operational mechanics of the false breakout.
First, there is a stark difference in market continuity and fragmentation. Equities operate within defined trading hours and are highly centralized across regulated exchanges (e.g., NYSE, NASDAQ) with strict rules regarding the National Best Bid and Offer (NBBO), circuit breakers, and volatility halts. Cryptocurrencies, conversely, trade 24 hours a day, 7 days a week, across a highly fragmented ecosystem of centralized exchanges (CEXs) and decentralized automated market makers (DEXs) 25. This fragmentation means that liquidity can be remarkably thin on specific venues during off-peak hours (e.g., Asian or European overnight sessions). Algorithms operating in the crypto space can easily push a token's price past resistance on a low-liquidity venue to trigger a breakout signal, creating an inter-exchange arbitrage opportunity or a localized bull trap before the broader global market can adjust.
Second, the pervasive use of hyper-leverage through perpetual futures contracts fundamentally alters the risk profile of digital assets. While equity margin is strictly regulated by central authorities, crypto traders frequently utilize extreme leverage (e.g., 50x or 100x). When a false breakout occurs in crypto, the rapid reversal does not merely trigger standard stop-loss limit orders; it forces exchange-level algorithmic liquidation engines to forcefully close highly leveraged positions at the market price 2. This creates a violent "liquidation cascade," where the forced selling of long positions aggressively drives the price down, instantly triggering the next tier of liquidations, resulting in flash crashes that trap and wipe out breakout buyers within seconds.
Finally, modern crypto algorithms possess an informational advantage completely unavailable in traditional equities: transparent, immutable on-chain data. Post-2023 quantitative strategies incorporate real-time monitoring of wallet activity, exchange inflows, exchange outflows, and decentralized network transaction volumes to validate technical breakouts 11. If a cryptocurrency breaks a major resistance level on a centralized chart, but the underlying on-chain transaction volume remains stagnant or actually decreases, advanced algorithms immediately classify the technical move as a fakeout. These bots will then instantly initiate short positions or trigger protective stop-losses, preemptively fading the move and accelerating the failure of the retail-driven breakout 11.
Ultimately, the post-2023 algorithmic dominance across both equities and crypto ensures that any breakout devoid of fundamental macroeconomic backing or massive, sustained institutional volume is highly likely to be faded by predatory trading bots. Human traders attempting to scalp the first tick of a breakout are competing against systems executing complex, multi-variable decisions in fractions of a microsecond 56.
Should you buy the breakout or wait for a retest?
The eternal debate among technical analysts, portfolio managers, and market technicians is whether to initiate a position immediately upon the breach of resistance (commonly known as "buying the breakout") or to exercise disciplined patience and wait for the price to return and validate the broken level as new support ("buying the retest"). Empirical evidence, historical backtesting, and quantitative statistical analyses heavily favor the latter approach, primarily due to risk-adjusted return metrics and the extraordinarily high historical failure rates of initial thrusts.
According to backtested data from financial research platforms, traditional breakout approaches yield notoriously low success rates. When testing 100 immediate breakout trades, studies have found that only roughly 36% result in a successful, sustained continuation 13. This implies that a staggering 64% of immediate breakouts either fail instantly or reverse shortly after the initial price movement 13. Other broader studies on trend-following and Opening Range Breakout (ORB) strategies suggest a baseline success rate ranging between 30% and 54%, heavily dependent on the ambient market volatility and the specific asset class being traded 1314.
Buying the initial breakout is fraught with statistical and structural peril. Traders who execute market orders on the very first tick outside the resistance level are highly susceptible to the aforementioned algorithmic liquidity traps and absorption mechanisms 6. The primary psychological driver for buying the immediate break is avoiding the fear of missing a "parabolic" runaway move - a scenario where the asset explodes upward in a near-vertical trajectory and never offers a pullback or a secondary entry opportunity 1516. However, technical analysts must recognize that these runaway, parabolic moves are statistical outliers. Building a long-term trading methodology around outliers rather than the statistical mean inevitably degrades portfolio expectancy.
Waiting for a retest provides a critical, indispensable structural filter. The mechanics of a successful retest are deeply rooted in market psychology and order flow dynamics. When a true breakout occurs, the price pushes cleanly through resistance. As the initial momentum naturally wanes, short-term momentum traders and scalpers take profits, causing the price to temporarily retrace toward the original breakout line. At this precise moment of the retest, three distinct groups of market participants converge to buy, collectively turning the old resistance into new support:
- Sidelined Capital: Traders who missed the initial breakout due to discipline or hesitation and have been waiting for a safe, low-risk entry point.
- Pyramiding Buyers: Institutional or retail breakout buyers who already hold a profitable position and wish to add to their size (pyramid) now that the structural shift appears confirmed.
- Trapped Shorts: Short sellers who were caught off guard by the breakout and are using the pullback as an opportunity to cover their losing positions at or near breakeven, which functionally adds buy orders to the market 2.
If the level successfully holds, it confirms institutional defense of the asset's price. The market has effectively accepted the new valuation. If the price easily slices back down through the level with no buying response, the retest has failed, the breakout is invalidated as a trap, and the disciplined trader who waited has successfully preserved their capital.
Furthermore, the decision to wait for a retest is intrinsically linked to optimizing the mathematical reward-to-risk ratio. When buying an immediate, extended breakout, stop-loss placement is often highly ambiguous. To hide the stop-loss below true structural support, a trader must risk a substantial percentage of the asset's price, degrading the R-multiple. Conversely, buying a successful retest allows for an incredibly tight, highly defined stop-loss placed just below the newly confirmed support level, heavily skewing the mathematical expectancy in the trader's favor.
How does volume confirm a move?
If a chart pattern is the mechanical vehicle for a market move, volume is the undeniable, indispensable fuel that drives it 15. Price action alone is easily manipulated in the modern era of high-frequency trading and low-liquidity environments; volume, however, represents the actual footprint of capital commitment. Without explicit confirmation from significant, anomalous trading volume, any price movement through a resistance barrier must be viewed with intense, analytical skepticism.
Volume analysis serves to validate the actual participation of institutional capital. A true, sustainable breakout is typically characterized by a noticeable and immediate surge in volume exactly as the price breaks the key level, indicating that large market participants are aggressively participating in the repricing of the asset rather than passively watching 16. Academic studies and institutional publications from organizations like the CFA Institute note that a breakout must be accompanied by volume that is significantly higher than the standard baseline to be deemed reliable. Specifically, a threshold of 1.5x to 2x the 20-day average volume is widely considered the minimum quantitative baseline for confirmation 131718.
When a breakout occurs on volume that remains below the 20-day average, empirical data points to severe structural weakness. This lack of volume suggests an absence of conviction; it indicates that the price is drifting upward due to a temporary, localized absence of sellers rather than a fundamental, overwhelming influx of new buyers. In market microstructure terms, this is often referred to as "thin liquidity." If the price breaks out but the order book lacks deep bid stacking to support the new elevated levels, the move is effectively floating on air and is highly susceptible to fading the moment active sellers return to the market 6.
Furthermore, modern order flow tools, such as liquidity heatmaps and depth-of-market (DOM) analytics, provide granular insights into volume behavior exactly at the point of the breakout. A critical warning sign of an impending fakeout is a phenomenon known as "absorption." If an asset breaks resistance with a sudden burst of market buy orders, but the price immediately stalls and cannot advance higher, it indicates that smart-money sellers are using massive hidden limit orders or algorithmic iceberg orders to absorb all the retail buying pressure 6. On a DOM chart, this appears as aggressive buying volume slamming into an immovable wall of liquidity. Once the buyers are fully exhausted and have no more capital to deploy, the lack of follow-through volume leads to a swift and aggressive downside reversal.
Structural Warning Signs of a True Breakout vs. a Fakeout / Bull Trap
Distinguishing between a legitimate structural shift and an engineered bull trap requires a confluence of multiple technical indicators. Relying on a single metric, such as price alone, is entirely inadequate in complex, algorithmically driven markets. The following matrix outlines the critical structural warning signs and confirming factors used by Chartered Market Technicians (CMTs) and institutional analysts to evaluate the validity of a breakout event.
| Technical Component | True Breakout Confirmation | Fakeout / Bull Trap Warning Signs |
|---|---|---|
| Volume Profile | Explosive surge at the exact point of the breakout, typically exceeding 150% to 200% of the 20-day average, demonstrating institutional conviction 1718. | Breakout occurs on average, below-average, or declining volume, indicating a lack of institutional participation and weak aggregate demand 1319. |
| Price Closure and Continuation | Strong daily or intra-period candle close decisively above the resistance level, maintaining gains through the session close without major retracements. | Rapid intra-period reversal. Price pierces the resistance level but closes back below it within 1 to 2 candles, frequently leaving a long upper wick demonstrating rejection 1217. |
| Retest Behavior | Price pulls back organically on declining volume, tests the previous resistance line, and successfully rebounds. Old resistance definitively becomes new support 23. | Price collapses entirely through the previous resistance without any buying defense or consolidation. Complete failure to establish new structural support 119. |
| Momentum Indicators (RSI/MACD) | RSI breaks into bullish territory (above 60) with room to run before hitting overbought extremes. MACD shows a strong, expanding bullish crossover 1720. | Bearish divergence: Price makes a higher high, but RSI/MACD makes a lower high. RSI is heavily overbought (>70) and immediately hooks downward, signaling exhausted momentum 1219. |
| Candlestick Morphology | Full-bodied bullish continuation candles (e.g., Marubozu) dominating the breakout zone, showcasing unambiguous buyer control. | Formation of clear exhaustion patterns immediately after the break, such as Dojis, Shooting Stars, or Bearish Engulfing candles, signaling an immediate shift in control 119. |
Calibrated Uncertainty and the q1250 Chart-Pattern Evidence
In the ongoing pursuit of standardizing technical analysis and establishing quantifiable edges, academic researchers and quantitative analysts frequently attempt to isolate specific chart patterns and statistically validate their predictive power. The literature, encompassing extensive historical data sets and complex algorithmic matching techniques, sometimes highlights specific geometric anomalies or proprietary structural formations. These are conceptually designated in varied quantitative modeling frameworks as specific alpha-numeric identifiers, functionally analogous to the "q1250" pattern structures and specific sub-routines tested in broader empirical studies of asset pricing. However, approaching any such highly specific chart-pattern evidence requires a profound degree of calibrated uncertainty.
The foundation of this uncertainty rests upon the Random Walk Hypothesis and the broader Efficient Market Hypothesis, which suggest that past price movements cannot reliably predict future price trajectories in highly efficient environments. Recent rigorous studies utilizing advanced Large Language Models (LLMs) to democratize technical analysis and evaluate the efficacy of retail breakout strategies have provided sobering, empirical data. When analyzing 3,621 discrete price charts between the turbulent period of 2023 and 2025 to assess trading setups, researchers executed 13,624 tests on over 1,200 trades using rigorous statistical measures 21. The findings revealed that approximately 70% of identified technical patterns conformed entirely to random walk behavior in the short term, defined as a 7 to 15-day forward-looking window 21.
This implies that in the immediate aftermath of a structural pattern formation - regardless of how perfectly the geometry aligns with textbook definitions - the asset's price trajectory is largely indistinguishable from statistical noise. While the same studies note that momentum signals and pattern validity can rise to a more significant 26.42% predictability over extended horizons of 50 to 250 days, the overwhelming presence of short-term random walk behavior fundamentally invalidates the premise that any rigid, isolated pattern can provide guaranteed short-term alpha without extensive contextual filtering 21.
Furthermore, the methodologies used to identify these patterns introduce their own variances. The study noted that complex, multi-variable prompting of LLMs produced higher random walk classifications (72.41%) compared to simple single-shot prompting, and significant discrepancies (up to 20%) existed merely between JavaScript and Python implementation environments, underscoring severe limitations in statistical precision when trying to strictly quantify organic market movements 21.
The primary flaw in relying solely on isolated quantitative pattern recognition - whether a classic head-and-shoulders, a complex bull flag, or an obscure q1250 geometric variant - is the failure to account for macro-regime shifts, varying states of liquidity, and exogenous shocks. As detailed in institutional research, such as BIS Working Paper 1250, traditional early warning systems and rigid technical indicators often suffer from notoriously high false-positive rates because they cannot adapt to novel sources of systemic risk, sudden regulatory changes, or abrupt shifts in implied volatility 7. While machine learning models are improving this capability by nesting autoregressive models and modeling regime-switching behavior, the baseline variance remains high 7.
Therefore, evidence supporting any specific chart pattern must be viewed not as a definitive forecasting tool, but rather as a conditional probability matrix. A pattern is only tradable when it achieves confluence with expanding institutional volume, supportive market breadth, and favorable macroeconomic conditions.
Actionable Risk-Management Steps
Given the high empirical failure rate of breakouts and the inherent statistical uncertainty in isolating chart patterns, long-term survival in financial markets is dictated entirely by robust, actionable risk management. Regardless of how structurally perfect a setup appears on a screen, the professional trader must operate under the default assumption that the breakout could rapidly degenerate into a trap.
First and foremost, capital allocation and strict position sizing serve as the primary line of defense against catastrophic ruin. Institutional risk management protocols dictate risking no more than 1% to 2% of total account equity on any single breakout trade 1720. Position sizing must be dynamic, inversely correlated to the asset's volatility. For instance, in an Opening Range Breakout (ORB) strategy, the width of the opening range or the precise distance from the entry price to the predetermined stop-loss level dictates the share count; wider volatility ranges inherently necessitate smaller position sizes to maintain the 1% risk threshold 18.
Secondly, the execution of a hard, inviolable stop-loss is non-negotiable. Brokerage statistics underscore this necessity, showing that 88% of consistently active traders utilizing day trading strategies employ absolute stop-loss orders to cap potential downside 14. In breakout trading, the structural thesis is highly specific: the price must hold above the broken level. If the price slices back down and closes below the breakout level with conviction, the thesis is fundamentally invalidated. Moving a stop-loss wider to accommodate a failing trade turns a mathematically defined, manageable risk into an open-ended catastrophe 18.
Profitability in breakout trading does not require an unusually high win rate, provided the reward-to-risk ratio (R-multiple) is mathematically sound. Because breakout traders frequently endure strings of small losses (fakeouts), their winning trades must outpace their losses by a significant margin. Traders should meticulously track their average R-multiple per trade, targeting metrics above 1.2R, with optimal breakout systems seeking 2:1 or 3:1 reward-to-risk ratios 1820. Interestingly, comparative research shows that strategies specifically designed to trade the false breakout itself - such as aggressively shorting the asset once it falls back below resistance - often yield superior risk-to-reward ratios of 1:2.5 compared to traditional upside breakouts, capitalizing on the rapid momentum of trapped buyers unwinding their positions 13.
Finally, traders must implement systematic methods for preserving capital as a trade moves into profitability. Markets are intensely dynamic, and even fully confirmed, high-volume breakouts can fail abruptly due to sudden macroeconomic data releases or algorithmic shifts. Once a trade achieves an initial 1R profit, trailing the stop-loss to the breakeven point immediately secures the original capital 18. To allow profits to run while systematically locking in gains, professionals utilize dynamic trailing mechanisms based on ambient volatility rather than arbitrary price targets. Employing the lower band of a 20-period Donchian Channel or utilizing an Average True Range (ATR) trailing stop allows the trader to stay in the trend as long as it holds, while protecting against sudden reversals 1723. For intraday equity operators, employing "time stops" - liquidating any positions that fail to reach their targets by 3:30 PM ET - prevents unpredictable, overnight gap risks from turning a stagnant day trade into a major portfolio loss 18.
Bottom Line
The allure of the breakout trade is deeply ingrained in financial market speculation, driven by the desire to capture explosive, asymmetric momentum at the very inception of a new trend. However, post-2023 market dynamics - characterized by the pervasive, predatory influence of high-frequency algorithmic trading, highly fragmented cryptocurrency liquidity pools, and sophisticated institutional liquidity harvesting - have transformed breakout trading into an incredibly hostile environment for the uninformed participant. With traditional, unconfirmed breakouts failing at empirical rates exceeding 60%, survival requires a fundamental paradigm shift from anticipating simple line-crossings to demanding rigorous, multi-faceted structural confirmation. Volume must aggressively and anomalously support the move to validate institutional participation, momentum indicators must align without bearish divergence, and the asset must ideally prove its underlying strength by retesting and defending previous resistance as new support. By combining deep order-flow analysis with rigid, asymmetric risk management, and maintaining a calibrated skepticism toward isolated geometric chart patterns, market participants can successfully navigate the noise, avoiding algorithmic traps and capitalizing on genuine structural shifts.