Predictive Power of Technical Chart Patterns
The efficacy of technical chart patterns - such as the head and shoulders, flags, and triangles - has been a subject of protracted debate between academic financial economists and market practitioners. Standard economic frameworks, notably the Efficient Market Hypothesis (EMH), posit that technical trading strategies should not yield consistent excess returns because asset prices reflect all available information, rendering historical price movements useless for forecasting future trajectories 12. However, empirical evidence drawn from decades of market data, algorithmic backtesting, and behavioral finance suggests that specific geometric price formations do possess measurable predictive power, albeit conditionally 345.
The reliability of these patterns is not absolute; it is heavily mediated by market microstructure, trading volume, the presence of data-snooping bias in research, and the specific asset class or market regime in which the pattern forms 668. The historical progression of technical analysis research shows an evolution from visual chart inspection in the mid-20th century to highly sophisticated deep learning models in the contemporary era 9107. This evolution has revealed that while certain patterns exhibit statistical edges, the rise of algorithmic trading has fundamentally altered the landscape, accelerating market efficiency and reducing the predictive reliability of textbook-perfect geometric formations 89.
Theoretical Foundations of Pattern Recognition
The foundational premise of chart pattern analysis is that collective human psychology and market mechanics produce repetitive price structures. Market participants oscillate between periods of fear and greed, creating cyclical supply and demand imbalances that manifest visually on price charts 410.
Proponents of technical analysis argue that the market discounts everything, meaning all fundamental, political, and psychological factors are ultimately distilled into price and volume data 115. Under this assumption, historical price movements are not random walks but rather a reflection of herd mentality and price persistence 16. When a trend initiates, investors often imitate first movers, creating a feedback loop that exacerbates the price change and structures the geometry of the subsequent chart pattern 1611.
Recent research utilizing Complex Systems Theory and Statistical Physics has provided a mathematical framework for these phenomena. High-frequency price dynamics exhibit distinct memory effects, particularly around heavily watched support and resistance levels 1. Studies analyzing tick-by-tick data on exchanges such as the London Stock Exchange have demonstrated that prices are statistically more likely to rebound off established support or resistance values than to cross them 1. Interestingly, the predictive power of these memory effects is highly dependent on the time scale; significance is often observed at intervals of 45, 60, and 90 seconds, but dissipates entirely at 180 seconds, underscoring the rapid decay of microstructural inefficiencies 1.
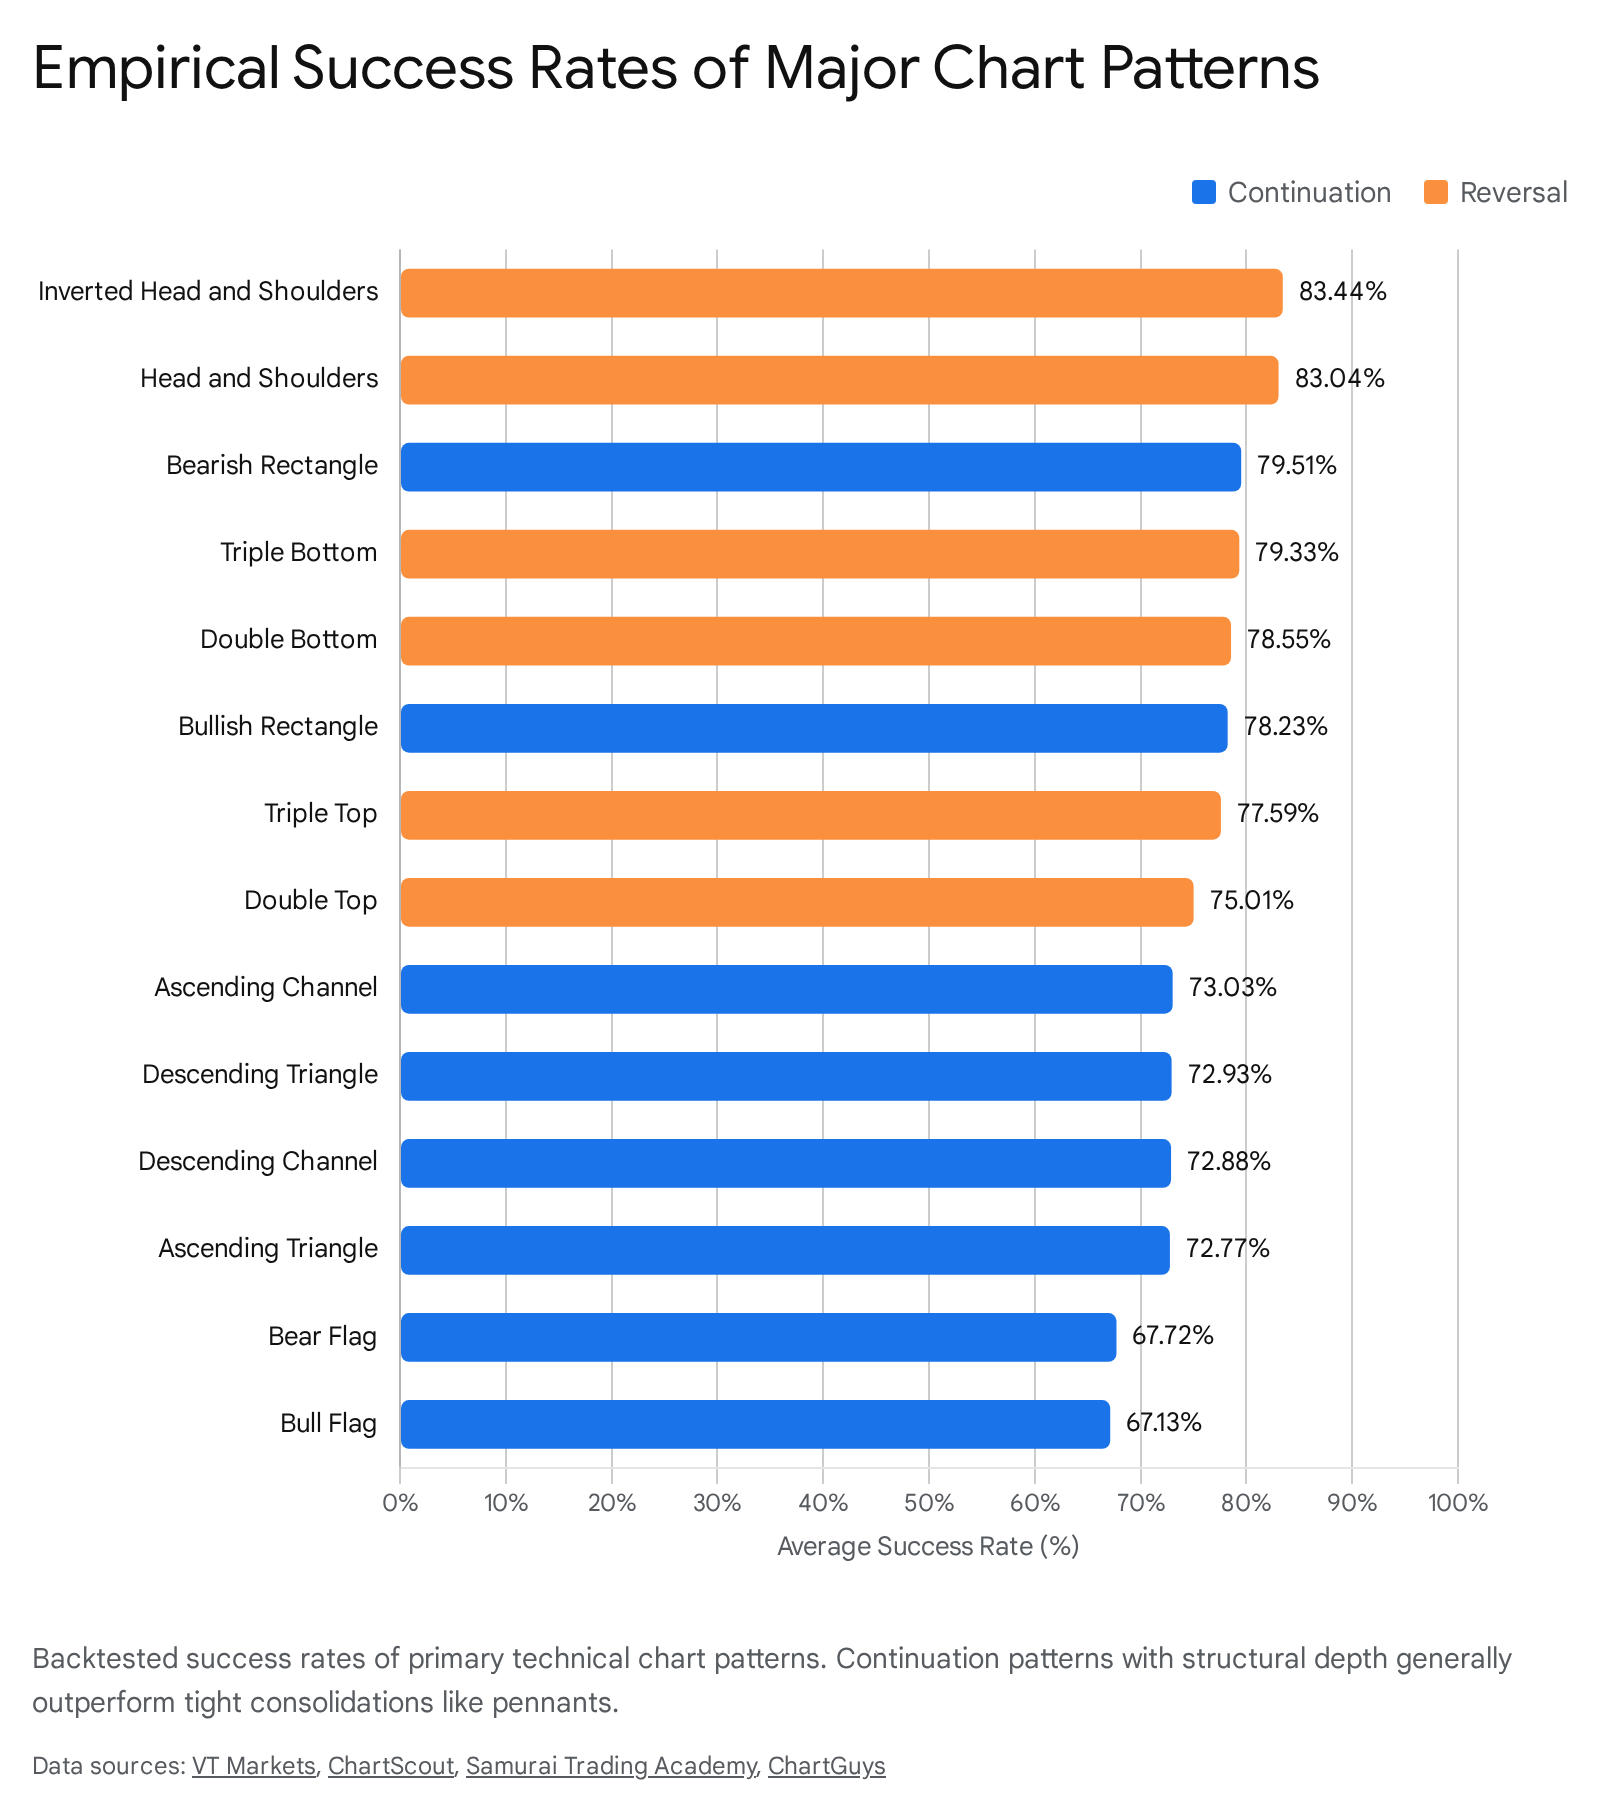
Statistical Efficacy of Continuation Patterns
Continuation patterns represent temporary periods of consolidation or "pauses" within an established trend, suggesting that the broader market momentum will resume once the consolidation resolves 318. Empirical backtesting generally indicates that continuation patterns boast higher statistical success rates than reversal patterns because they do not require a fundamental shift in the overarching market directional bias 19.
Flag Formations
The flag pattern is widely documented as one of the most reliable continuation structures across diverse asset classes. A valid flag requires a sharp, high-volume price movement known as the "flagpole," followed by a tight, counter-trend consolidation channel bounded by parallel support and resistance lines 52021.
The higher and tighter the consolidation phase relative to the flagpole, the higher the probability of a favorable breakout 22. Historical backtesting across global equity indices from 2025 reveals that bull flags maintain success rates ranging from 67% to 91.5%, highly contingent upon strict volume confirmation at the breakout point 4522. The bearish equivalent, the bear flag, mirrors this structure during downward trends. During sustained sell-offs, selling pressure temporarily abates, allowing prices to drift upward on low volume before the broader decline resumes 51213. Bear flags demonstrate a success rate of approximately 67% to 68% in predicting downward continuations, though they are prone to failure if the initial downward momentum lacks structural conviction 221314.
Pennant Formations
Despite structural similarities to flags, pennants exhibit surprisingly poor predictive power in empirical samples. A pennant forms when the post-flagpole consolidation phase narrows into a small, symmetrical triangle rather than a parallel channel 2012.
Comprehensive data tracking over 1,600 meticulously identified pennant formations reveals a 54% failure rate, meaning more than half of standard pennants fail to extend at least 5% past their breakout point 2015. Furthermore, the breakout direction is highly unreliable. Even when forming after a steep bearish decline, bear pennants have been shown to break upward 57% of the time, directly contradicting their definition as bearish continuation signals 2015. Consequently, quantitative researchers classify pennants as low-conviction setups that strictly require supplementary momentum indicators or exceptional volume surges to warrant capital deployment 2015.
Cup and Handle Formations
The cup and handle is a longer-term bullish continuation pattern characterized by a U-shaped recovery representing accumulation (the cup) and a subsequent minor downward consolidation (the handle) 31216. The handle serves as a final market "shake-out" of weak hands before buying pressure resumes 12.
When strict geometric criteria are applied - specifically, a cup depth between 12% and 33% and a handle retracement not exceeding 50% of the cup's rise - this pattern ranks among the highest probability setups in technical analysis 20. In specific algorithmic backtests measuring over 900 trades, the pattern exhibited a failure rate of merely 5%, making it a statistically robust signal when combined with appropriate volume expansion at the handle's resistance breakout 20.
Statistical Efficacy of Reversal Patterns
Reversal patterns indicate the exhaustion of a prevailing trend and the initiation of a new directional paradigm 318. Because these formations must overcome established market momentum, they naturally experience higher failure rates and demand stringent structural confirmation compared to continuation patterns 19.
Head and Shoulders Dynamics
The head and shoulders formation remains the most heavily analyzed and historically validated reversal pattern in classical charting 410. Occurring at the apex of an uptrend, the structure comprises three distinct peaks: a left shoulder, a higher central peak (the head), and a lower right shoulder. The pattern's critical diagnostic feature is the "neckline," a support threshold connecting the troughs between the peaks 101214.
The pattern is only confirmed when price decisively breaches the neckline on increasing trading volume 10. Extensive testing, including studies conducted on intra-day tick data of S&P 100 stocks, confirms statistically significant price declines corresponding to the pattern's measured target, which is calculated by projecting the vertical distance from the head to the neckline downward from the breakout origin 17. Standard head and shoulders tops achieve historical success rates between 70% and 89%, while the inverse head and shoulders - a bullish reversal pattern occurring at the nadir of a downtrend - demonstrates virtually identical reliability 3422.
Double and Triple Top and Bottom Formations
Double and triple tops represent failed attempts by buyers to breach a specific resistance level, forming "M" or multi-peak shapes that signify trend exhaustion 1012. Conversely, double and triple bottoms form "W" shapes at support levels, indicating that selling pressure has evaporated 101218.
The reliability of these patterns fluctuates based on the broader market environment. In strong, confirmed bull markets, double bottoms achieve an 88% reliability rate, while triple bottoms achieve approximately 87% accuracy when confirmed by volume 422. However, in thinly traded or news-driven markets, these structures frequently manifest as false signals or "fakeouts," requiring operators to wait for a definitive break of the intervening peaks (the intermediate resistance line) before confirming the reversal 1819.
Mechanics of Triangular Formations
Triangular patterns represent a visual compression of price action, where converging trendlines indicate a steady decrease in volatility and a narrowing trading range 316. As the market coils, it builds potential energy that eventually resolves in a sharp breakout. The structural slope of the triangle provides insight into the underlying balance of supply and demand 2220.
Ascending Triangles
The ascending triangle features a flat upper resistance line and a rising lower support trendline 202112. This geometry illustrates a market dynamic where sellers continually defend a fixed price ceiling, but buyers are increasingly aggressive, entering the market at progressively higher price floors 20.
Empirically, the ascending triangle is a robust bullish continuation pattern. Thomas Bulkowski's extensive historical database indicates that the pattern breaks upward approximately 63% of the time, resulting in an average price appreciation of 35% when successful 20. Overall, ascending triangles boast a success rate of 72% to 75% 422. However, the pattern frequently subjects market participants to "throwbacks" - instances where the price breaks out upward, only to retrace and retest the former resistance line as new support. Data suggests this throwback phenomenon occurs in roughly 64% of ascending triangle breakouts, highlighting the necessity for wider stop-loss parameters 2020.
Descending Triangles
The descending triangle is the structural inverse of the ascending variant, defined by a flat horizontal support line and a downward-sloping resistance line 51812. This indicates distribution; sellers are willing to accept progressively lower prices, overwhelming buyers who are attempting to defend a static price floor 521.
The academic and practitioner data regarding the descending triangle is somewhat conflicting. Backtests in equity markets during 2025 showed a 69% to 75% success rate for bearish continuations 45. Yet, broader historical datasets analyzing thousands of these patterns across various asset classes reveal that descending triangles counter-intuitively break upward 53% of the time 20. Despite this high false-breakout rate, when the pattern does legitimately break downward through support, it carries a highly respectable 77% break-even rate, making it a viable setup strictly when traded post-breakdown 20.
Symmetrical Triangles
Symmetrical triangles feature two converging trendlines of roughly equal angles, representing a true equilibrium between buyers and sellers where neither side exerts directional dominance 421.
Statistically, the symmetrical triangle is one of the weakest standalone patterns in technical analysis. It is inherently bilateral, meaning it can break in either direction 18. Historical data ranks the symmetrical triangle near the bottom of all bullish and bearish continuation patterns 20. While it breaks upward approximately 60% of the time, the pattern is plagued by low-volume false breakouts and high failure rates 20. Consequently, researchers advise utilizing symmetrical triangles merely as direction-neutral context for broader trend analysis rather than as primary execution signals 20.
To consolidate the variances in historical pattern reliability, the following table summarizes the success rates, failure metrics, and distinct characteristics of the most prominent chart formations.
| Pattern Type | Category | General Success Rate | Breakout Bias and Empirical Characteristics |
|---|---|---|---|
| Bull Flag | Continuation | 67% to 91.5% | High reliability; dependent on strong initial flagpole momentum and strict volume contraction 41922. |
| Head and Shoulders | Reversal | 70% to 89% | Most robust reversal structure; requires volume expansion on neckline breach 41022. |
| Ascending Triangle | Continuation | 72% to 75% | Breaks upward ~63% of the time; features a high 64% throwback retest rate 3420. |
| Cup and Handle | Continuation | ~80% to 95% | Exceptionally low 5% failure rate under strict geometric validation criteria 320. |
| Bear Pennant | Continuation | 46% (54% Failure) | Highly unreliable; breaks opposite the bearish trend 57% of the time 2015. |
| Symmetrical Triangle | Bilateral | ~60% to 65% | Directionally ambiguous; plagued by a high frequency of low-volume fakeouts 420. |
The Imperative of Trading Volume Confirmation
Geometric price analysis is insufficient for establishing predictive power without the mechanical confirmation of trading volume 310. Volume represents the conviction of market participants and the actual capital flow required to physically move prices 10. Without substantial volume, breakouts from established patterns are highly susceptible to becoming false signals engineered by short-term liquidity imbalances 319.
Historically, researchers have hypothesized an asymmetric relationship between trading volume and price changes. Empirical studies confirm that positive changes in price generally require higher trading volume to sustain themselves compared to negative price changes 16. Interestingly, negative price changes are shown to be more sensitive to trading volume variations, meaning bear markets and downward breakouts can accelerate rapidly even on relatively lower volume profiles 16.
The absolute necessity of volume confirmation was quantified in a massive 2026 algorithmic study of over 137,000 chart pattern detections across the NASDAQ and NYSE 6. The data demonstrated that patterns breaking out with volume exceeding 2.5 times the asset's average achieved a 58% market beat rate over a two-week forward horizon. Conversely, pattern breakouts that occurred alongside extreme volume dry-up - defined as volume falling below 40% of the asset's average - managed only a 44% market beat rate. This 14-percentage-point differential was statistically significant, indicating that volume magnitude is a primary determinant of breakout survival 6.
Volume behavior is also critical during the formation of the pattern itself. In valid continuation patterns like flags and triangles, volume must progressively contract as the consolidation tightens. This volume decay signals a lack of conviction from counter-trend market participants 320. A subsequent breakout accompanied by a massive volume spike confirms that the dominant trend has aggressively reasserted itself 20.
Market Microstructure and Transactional Frictions
Theoretical models of chart pattern success often rely on frictionless market assumptions, ignoring the microstructural realities of execution. When empirical backtesting incorporates transaction costs, the apparent predictive power of many technical patterns severely diminishes 112122.
The Impact of Bid-Ask Spreads and Slippage
The primary frictions eroding the profitability of chart patterns are the bid-ask spread and slippage 2134. The bid-ask spread - the differential between the highest price a buyer is willing to pay and the lowest price a seller will accept - functions as a continuous, hidden transaction cost 34. In algorithmic trading and high-frequency technical strategies, this spread continually erodes returns 21.
Furthermore, research identifies distinct intraday patterns in the bid-ask spread. Spreads generally follow a U-shaped or reverse J-shaped curve during the trading day, remaining widest at the market open and close due to heightened risk and asymmetric information, and narrowing during the interior hours 23. Attempting to trade pattern breakouts during these high-spread periods severely restricts profitability 23.
Slippage further compounds these costs. Slippage occurs when market dynamics cause an order to execute at a less favorable price than the trader expected at the time of submission 2134. Pattern breakouts, by definition, occur at critical support or resistance nodes where liquidity is rapidly consumed by automated triggers and stop-loss orders. As traders rush to execute simultaneously, the available liquidity at the optimal breakout price evaporates, forcing market orders to fill at increasingly worse prices 21. Academic models simulating realistic slippage parameters reveal that the short-term excess returns generated by moving average crossovers and flag breakouts are frequently wiped out entirely 1121.
Behavioral Dynamics: The Self-Fulfilling Prophecy
A persistent critique of technical analysis is that its predictive power is not derived from underlying fundamental truths, but from the coordinated behavior of the participants observing the charts. This dynamic is known as the self-fulfilling prophecy 910.
If a sufficient percentage of market participants - ranging from retail speculators to institutional algorithms - believe that a break below a head and shoulders neckline signifies a bearish reversal, they will programmatically execute short sales when that price level is breached. This synchronized influx of selling pressure fundamentally alters the supply and demand equilibrium, physically forcing the price down and manifesting the very outcome the pattern predicted 91524.
This feedback loop is deeply embedded in the market's microstructure. Modern algorithmic trading has amplified the self-fulfilling prophecy. Machine learning models trained on historical datasets recognize that human traders act on specific geometric shapes and momentum indicators. The algorithms then pre-emptively buy or sell milliseconds before the technical threshold is crossed, exacerbating the price movement and reinforcing the pattern for future model training cycles 8. Consequently, markets frequently exhibit "algorithmic efficiency," where prices do not necessarily move toward their fundamental valuation, but rather oscillate within boundaries determined by heavily monitored technical signals 837.
Inter-Market Disparities: Equities, Forex, and Cryptocurrency
The reliability of a chart pattern is intrinsically linked to the macroeconomic characteristics, liquidity depth, and regulatory framework of the asset class in which it forms 2539. The mechanics of pattern completion vary drastically across global equities, foreign exchange, and cryptocurrency markets 840.
| Market Attribute | Global Equities (Stocks) | Foreign Exchange (Forex) | Cryptocurrency |
|---|---|---|---|
| Market Structure | Centralized exchanges (NYSE, NASDAQ); highly regulated 8. | Decentralized OTC network; intermediated by major global banks 8. | Highly fragmented; mix of centralized exchanges and decentralized protocols 8. |
| Trading Hours & Continuity | Fixed hours (e.g., 9:30 AM - 4:00 PM EST); prone to overnight price gaps 839. | 24/5 continuous trading; cycles through global banking sessions 840. | 24/7 continuous trading; no centralized open or close 840. |
| Volatility & Liquidity | Moderate daily volatility (1-3% swings); deep liquidity for large caps 8. | Extremely deep liquidity ($9.6T daily); low structural volatility (0.5-1% swings) 840. | High volatility (5-20%+ daily swings); lower aggregate liquidity 82539. |
| Pattern Efficacy Dynamics | Intraday patterns frequently disrupted by overnight gaps; higher timeframe patterns are robust 348. | Patterns mature slowly due to macro-driven nature; highly reliable for multi-week support/resistance identification 3940. | Patterns form and resolve with extreme velocity; low liquidity exacerbates the frequency of false breakouts 82012. |
In the equity markets, fixed trading hours introduce the risk of overnight gaps resulting from earnings reports or macroeconomic data releases. These gaps can instantly invalidate intraday chart patterns, making higher timeframes (daily or weekly charts) substantially more reliable for classical pattern recognition 348.
The Forex market, dominated by institutional liquidity and macroeconomic policies, experiences lower baseline volatility. Chart patterns in Forex tend to develop more slowly and are subject to mean-reverting behavior, requiring robust risk management due to the high leverage utilized by participants 3940.
Conversely, the cryptocurrency market operates continuously and features high volatility alongside lower overall liquidity 825. Chart patterns in digital assets reflect raw crowd psychology and complete significantly faster than in traditional markets. However, the thinner liquidity profiles mean that crypto assets are highly susceptible to "fakeouts" - brief, volatile spikes that trigger technical breakouts before immediately reversing. Therefore, trading chart patterns in cryptocurrency necessitates an absolute reliance on volume confirmation and the strict avoidance of low-liquidity pairs 82012.
The Efficiency Gap: Developed Versus Emerging Markets
The predictive power of technical chart patterns is strongly correlated with the evolutionary stage of the financial market in question. Academic literature surveying the profitability of technical trading rules (TTRs) highlights a stark divergence between developed and emerging economies 22627.
In highly developed and technologically advanced markets, such as the United States or the United Kingdom, the efficacy of simple chart patterns has degraded substantially over the past few decades. The proliferation of high-frequency trading firms, institutional quantitative models, and algorithmic execution implies that minor geometric inefficiencies are identified and arbitraged away at sub-second speeds. Consequently, studies reveal that applying standard moving average crossovers or simple pattern recognition rules in developed markets frequently yields inaccurate predictions or fails to outperform basic buy-and-hold benchmarks once transaction costs are deducted 272627.
Conversely, emerging financial markets - characterized by thinner liquidity pools, pronounced information asymmetries, and a higher proportion of retail participants acting on behavioral biases - often exhibit characteristics of weak-form inefficiency 226. Extensive academic studies, including those utilizing variable moving average strategies originally popularized by Brock, Lakonishok, and LeBaron (1992), demonstrate that technical analysis is significantly more profitable in emerging markets (such as those in Latin America or developing Asia) than in their developed counterparts 22728. In these environments, trends possess greater persistence, and simple technical rules successfully capture the protracted ebb and flow of supply and demand, allowing operators to systematically extract excess returns 22627.
Methodological Vulnerabilities in Academic Backtesting
The historical validation of technical chart patterns is frequently marred by statistical flaws in academic research methodologies. The most pervasive and destructive of these flaws is data-snooping bias, also known as overfitting or survivorship bias 62945.
Quantifying Data-Snooping Bias
Data-snooping bias occurs when researchers sequentially test thousands of technical rules, indicator combinations, and pattern variations against a single, static historical dataset. By testing an enormous quantity of variables, statistical probability dictates that certain strategies will generate highly profitable returns purely by random chance 62945. If researchers only publish the successful permutations without adjusting their statistical confidence intervals to account for the total number of rules tested, the resulting literature presents a severely inflated perception of pattern efficacy 62930.
Many early foundational studies from the 1980s and 1990s lacked the computational rigor to penalize models for data snooping 2930. However, modern econometric techniques have been developed to correct for this. Tools such as White's Reality Check (RC) test (2000) and Hansen's Superior Predictive Ability (SPA) test (2005) rigorously quantify data-snooping bias by re-centering the null distribution based on the breadth of the hypothesis testing 629.
When these stringent statistical corrections are applied to exhaustive universes of technical trading rules over long-term data (such as the Dow Jones Industrial Average or the S&P 500), the apparent profitability of the vast majority of classical chart patterns and moving average strategies vanishes entirely 629. These reality checks confirm that in mature, highly capitalized markets, much of the historical success attributed to simple technical analysis is a spurious artifact of data mining 6.
Algorithmic Detection and Deep Learning Paradigms
The contemporary analysis of chart patterns has largely transitioned from subjective visual identification by human analysts to automated extraction via sophisticated artificial intelligence. Deep learning architectures, particularly Convolutional Neural Networks (CNNs) and Vision Transformers (ViTs), have demonstrated unprecedented capability in parsing high-dimensional financial time-series data, identifying subtle, non-linear dependencies that evade classical human analysis 103132.
These deep architectures excel at maintaining the spatial properties of data arrays and capturing long-range dependencies, facilitating the highly accurate detection of dynamic support and resistance regimes without the cognitive biases that plague human chartists 103132. However, deep learning models trained on financial data are exceptionally prone to overfitting - learning the noise of a specific historical period rather than the underlying market mechanics - which severely impedes their ability to generalize in out-of-sample, live trading environments 103133.
The Deterioration of the "Textbook" Pattern
The deployment of algorithmic detection at scale has generated counterintuitive insights regarding the very nature of successful chart patterns. In a comprehensive 2026 study analyzing over 370,000 algorithmic pattern detections across the NASDAQ and NYSE, researchers discovered an inverse relationship between a pattern's geometric perfection and its forward predictive success 69.
Algorithms were designed to assign a "Structure Score" based on how closely a price formation mirrored the textbook definitions of patterns like ascending triangles or bull flags - rewarding clean geometry, equidistant touches, and perfectly horizontal resistance lines 6. The empirical results revealed that aesthetically perfect patterns yielding an overall quality score of 30 or higher (out of 32) achieved a dismal market beat rate of only 29%. Conversely, messier, lower-scoring patterns achieved their measured move targets over 60% of the time 69.
This phenomenon underscores a profound evolution in market microstructure. When a chart pattern is mathematically perfect and structurally obvious, it becomes universally recognized by both retail participants and institutional quantitative algorithms 9. In response, algorithmic systems preemptively execute trades, pricing in the opportunity long before the textbook breakout occurs. Consequently, crowded trades neutralize the statistical edge, proving that in hyper-efficient modern markets, the most obvious geometric structures consistently underperform 9. Furthermore, the predictive power of these pattern signals decays rapidly; data confirms that breakouts rarely sustain their momentum beyond a two-week forward window 9.
Conclusion
Technical chart patterns do possess real predictive power, but they are neither infallible laws of market physics nor mere astrological illusions. Their efficacy is a demonstrable, measurable byproduct of market microstructure, behavioral feedback loops, and self-fulfilling prophecies enacted by thousands of market participants and automated algorithms.
While certain continuation patterns (such as flags and ascending triangles) and major reversal structures (such as the head and shoulders) exhibit statistically significant success rates in empirical backtesting, their real-world profitability is highly conditional. Predictive power evaporates without the corroborating mechanical force of trading volume, and theoretical returns are routinely degraded by the realities of bid-ask spreads and liquidity slippage. The reliability of chart patterns is also geographically and temporally bounded; they are significantly more potent in emerging, less efficient markets than in the heavily arbitraged arenas of developed global equities.
Ultimately, as markets become increasingly dominated by deep learning models and high-frequency algorithms, the most obvious, "textbook" patterns are rapidly identified and neutralized. The predictive power of a chart pattern today does not lie merely in recognizing its geometry, but in analyzing its volume profile, contextualizing its location within the broader market regime, and understanding the complex microstructural forces driving the breakout.