
Why Trading Volume Matters When Confirming Price Moves
Trading volume acts as the financial market's polygraph test, revealing the true conviction and institutional participation behind any change in an asset's price. While price movements show the path an asset is taking, volume exposes the amount of actual capital driving that direction, helping investors separate genuine market shifts from temporary fluctuations. Without strong volume to confirm a trend or breakout, traders risk falling for deceptive price drifts and costly false signals.
What Exactly Is Trading Volume?
At its core, trading volume is a straightforward metric: it represents the total number of shares, contracts, or units of a security exchanged between buyers and sellers during a specific period 1234. For a single stock, daily volume is simply the number of shares that changed hands that day. For futures and options, it is measured in contracts, and in decentralized markets like forex, it is often measured by "tick volume" as a proxy for price change activity 25.
For retail traders and institutional investors alike, price action displays the market's trajectory, but volume reveals the foot traffic 6. A price move on weak volume is often just a temporary tick or the result of a momentary order imbalance in a thin market. Conversely, a move accompanied by volume that is two or three times the recent average indicates a significant behavioral shift, often pointing to the deployment of real institutional capital 47.
Volume tells a story of market liquidity and interest 1. In general, volume tends to be highest right after the market opens and right before it closes, typically surging on Mondays and Fridays while dipping mid-week or ahead of holidays 28. When a major event occurs, such as an earnings report, a macroeconomic data release, or geopolitical news, the sudden influx of participation triggers a volume spike that validates the subsequent price reaction 23.
Debunking the "More Buyers Than Sellers" Myth
A pervasive misconception among novice investors is that high volume on an upward price day means "there were more buyers than sellers" 910. In reality, the mechanics of financial markets dictate that every single transaction requires exactly one buyer and one seller. If one million shares of a stock are traded, exactly one million shares were bought and one million shares were sold 104.
What volume actually measures in these scenarios is the aggressor side of the trade 12. When analysts speak of "buy volume," they mean trades where the buyer was the aggressor - meaning they were willing to cross the bid-ask spread and pay the asking price to acquire the asset immediately because they feared missing out on the opportunity 12. "Sell volume" occurs when a seller is desperate enough to exit that they hit the existing bid, taking whatever liquidity is immediately available 12. Therefore, a price rising on high volume does not mean buyers numerically outnumbered sellers; it means buyers were highly motivated, aggressive, and willing to absorb all available supply at increasingly higher prices.
To visualize this, imagine watching a football game where you only see the score updates but never know who controlled the ball or the pace of the game 12. Price alone is just the final score. Buy and sell volume together reveal who drove the market to that score and how dominant they were in the process.
The Core Rule: Breakouts vs. Fakeouts
One of the most critical applications of volume analysis is determining the validity of a "breakout." A breakout occurs when an asset's price moves decisively past a well-established level of support (a price floor) or resistance (a price ceiling) 51415. Because these technical boundaries represent psychological and historical barriers, breaking through them usually signals a potential shift or continuation in a broader trend 515.
However, financial markets are notoriously deceptive. According to industry estimates, roughly 60% to 70% of breakouts in heavily traded markets like forex and large-cap equities turn out to be false signals, commonly known as "fakeouts" 5. A fakeout happens when the price briefly pushes beyond a key level, triggering automated stop-loss orders and retail fear-of-missing-out (FOMO), only to collapse back into its previous trading range 7514.
Measuring the Institutional Surge
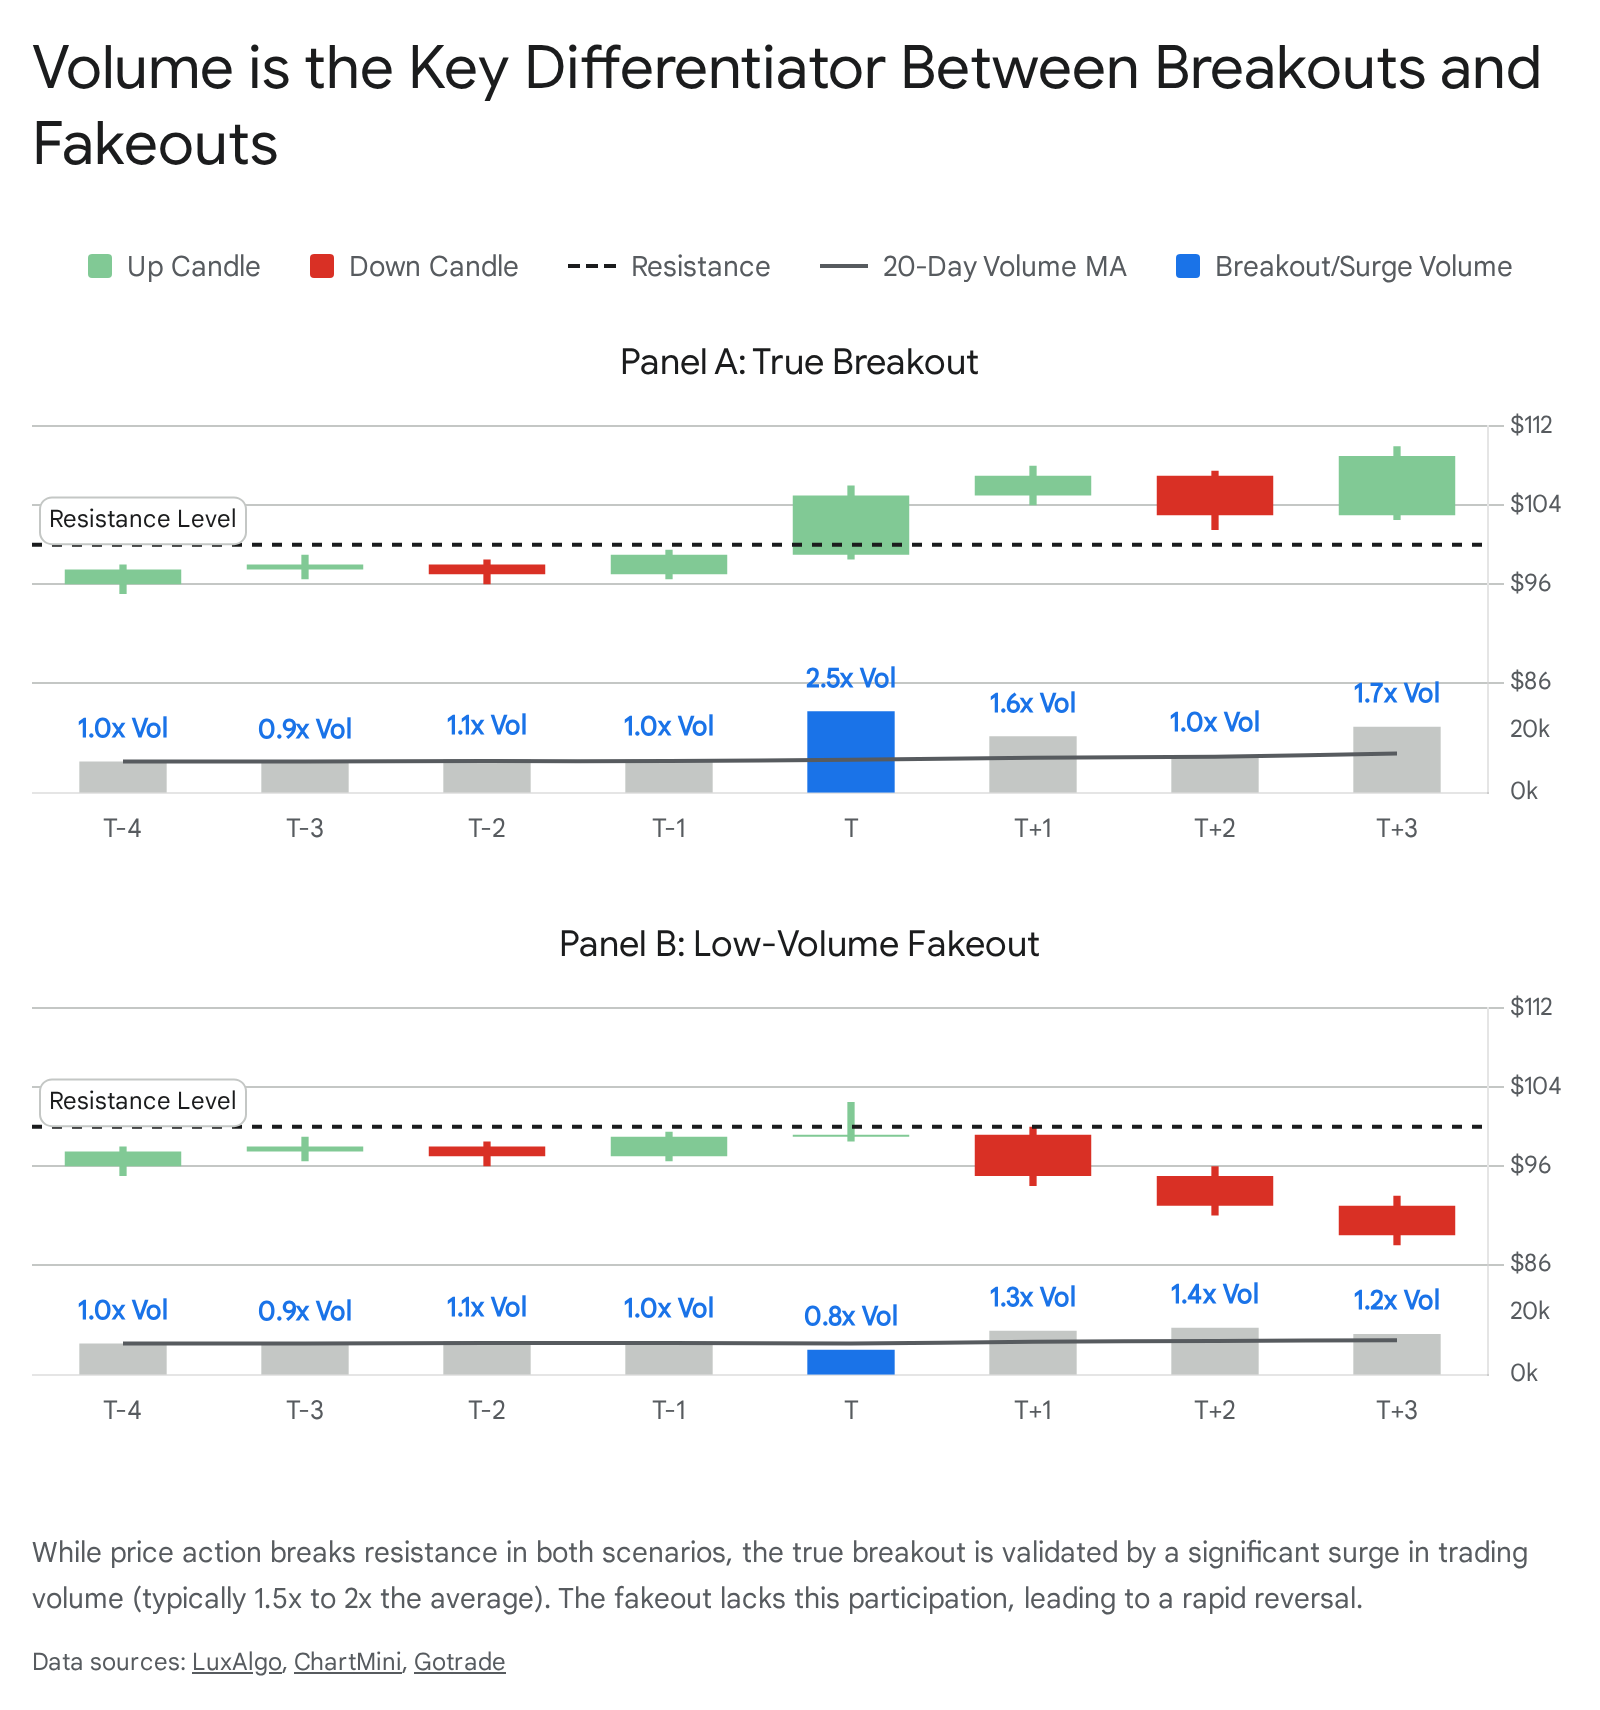
Volume is the primary differentiator between a genuine breakout and a trap. Institutional buyers - such as mutual funds, pension funds, and large asset managers - leave clear fingerprints when they enter the market, and those fingerprints manifest as massive volume bars on a charting platform 7.
A standard benchmark used by technical analysts is the "1.5x rule." For a breakout to be considered reliable, the trading volume on the breakout candle should be at least 1.5 to 2 times higher than the recent 20-day average volume 67. Academic research and practitioner backtesting support this rule of thumb; historical studies indicate that breakouts accompanied by volume at least 50% above average succeed roughly 65% of the time, whereas breakouts on below-average volume succeed only 39% of the time 55.
Categorizing Breakout Validity
When assessing market conditions, traders rely on specific structural differences to categorize a price move. If a trader enters a position on the initial break without waiting for volume confirmation, a strong close, or a retest, they are often trading based on emotion rather than a structured setup 14.
The table below summarizes the key behavioral traits of high-volume breakouts compared to low-volume fakeouts 565.
| Characteristic | True Breakout (High Volume) | Fakeout (Low Volume) |
|---|---|---|
| Volume Activity | Surges 50% to 200%+ above the recent average, signaling institutional entry 65. | Remains low, flat, or actively declines during the push, showing lack of interest 55. |
| Price Action | Strong, decisive candles closing near their highs with minimal wicks (e.g., engulfing candles) 516. | Indecisive candles like dojis, pin bars, or shooting stars, indicating immediate price rejection 5. |
| Retest Behavior | Price pulls back to the broken level, which holds firmly as new support or resistance 51415. | Price falls back through the broken level almost immediately, failing to find new support 514. |
| Market Context | Moves align with broader macroeconomic trends, momentum indicators, and fundamentals 514. | Occurs in isolation, often in choppy or low-liquidity environments without broader support 514. |
Strategy Alignment: Pullbacks vs. Breakouts
A comprehensive trading strategy often relies on understanding the relationship between the initial breakout and the subsequent market reaction. Traders generally employ two different philosophies: chasing the breakout or waiting for the pullback.
Entering directly on the breakout is an aggressive strategy that targets explosive moves escaping from ranges 1718. It requires rapid execution and carries a higher risk of being caught in a false break, which necessitates wider stop-loss orders to avoid being whipsawed out of the trade 18. Because slippage can be severe during fast, volatile breakouts, traders demand a higher reward potential (such as a 1:3 risk-to-reward ratio) 1718.
Conversely, trading the pullback - or waiting for a "retest" - suits more patient and conservative investors 1517. Instead of entering immediately, the trader waits for the price to break out and then retrace back to the previous support or resistance level 15. If the price resumes its breakout direction on renewed volume, it confirms that the broken level has successfully shifted roles (resistance becoming support) 15. This method offers safer entries, better pricing, tighter stop-losses, and generally higher win rates, though it carries the risk of missing the start of massive directional moves if the asset never pulls back 151718.
Diagnosing Market Health with the Price-Volume Matrix
Beyond breakouts, trading volume is used to assess the ongoing health of an established trend. Technical analysts rely on a fundamental matrix of price and volume relationships to gauge whether to hold a position, add to it, or prepare for a reversal 646.
By analyzing these combinations, market participants attempt to filter out the noise of daily fluctuations and focus on the underlying supply and demand dynamics 6.
| Price Direction | Volume Level | Interpretation & Actionable Insight |
|---|---|---|
| Up | High | Strong Bullish Signal: Indicates aggressive buying conviction. The trend has momentum. Action: Seek long entry pullbacks 646. |
| Down | High | Strong Bearish Signal: Points to aggressive distribution and panic selling. Action: Avoid long positions; wait for support stabilization 69. |
| Up | Low | Weak Rally (Warning): The price is drifting upward without institutional buying pressure. Action: Avoid long entries; expect a fakeout or reversal 5620. |
| Down | Low | Weak Decline (Pullback): The market is drifting lower without concerted selling pressure. Action: Look for bullish reversal setups near key support 6186. |
Spotting Divergence and Exhaustion
One of the most valuable warning signs volume provides is divergence. Divergence occurs when the price trends in one direction - perhaps making a new high or new low - but the trading volume steadily trends in the opposite direction 3916.
For example, if a stock rallies from $100 to $110 on a volume of 5 million shares, and then subsequently rallies from $110 to $120 on a volume of only 2 million shares, a bearish divergence has occurred 16. The declining volume warns that fewer participants are willing to support the trend at these higher valuations. Even if the price looks strong on a chart, the internal mechanics of the move are hollow, often preceding a sudden trend reversal 3916.
Conversely, extreme volume spikes can sometimes signal an "exhaustion climax" or a "capitulation event." If a stock has been in a sustained, agonizing downtrend for weeks and suddenly drops another 10% on the highest volume seen in years, it frequently means the last remaining frightened retail investors have finally thrown in the towel 916. Once that final, massive wave of panic selling is absorbed by institutional buyers, the complete lack of remaining sellers can cause the price to snap back upward sharply 16.
Advanced Volume Indicators for the Modern Trader
Relying solely on the raw vertical volume bars at the bottom of a standard price chart can sometimes be difficult to interpret, especially in choppy markets or around major news events where volume is naturally distorted. Over the years, technical analysts have developed derivative indicators that mathematically combine price and volume data into more actionable formats 77.
On-Balance Volume (OBV)
On-Balance Volume (OBV) is a cumulative indicator that tracks the flow of volume over time. The calculation is remarkably simple: it adds the day's total volume to a running tally on days when the price closes higher, and subtracts the volume on days the price closes lower 7823.
The exact nominal value of OBV on any given day is irrelevant; what matters is the direction of the OBV line relative to the price 23. If a stock is slowly grinding to new all-time highs but the OBV line is flat or trending downward, it reveals that heavy selling is secretly taking place on the down days 7. This divergence suggests that large institutions are quietly distributing their shares to retail buyers under the cover of a rising price 712. OBV is generally considered a highly effective tool for multi-day swing trading setups and for confirming the staying power of a trend 723.
Volume-Weighted Average Price (VWAP)
Volume-Weighted Average Price (VWAP) calculates the true average price a security has traded at throughout the day, weighted by the amount of volume transacted at each price level 79.
VWAP is not just a theoretical indicator; it is the absolute benchmark used by institutional trading desks, pension funds, and algorithmic execution systems to grade the quality of their own order fills 7. If an institutional trader buys a massive block of shares below the day's VWAP, they executed a "good" trade; if they bought above VWAP, they overpaid relative to the broader market 79.
For retail intraday traders, the VWAP line acts as a dynamic level of support and resistance. A clean break above VWAP on rising volume is often the exact moment an asset transitions from aimless, choppy drifting into a strong directional trend 7. The indicator is specifically constrained to a single trading day, providing a precise, real-time snapshot of market mood from the opening bell to the close 9.
Volume Profile: Mapping Activity to Price, Not Time
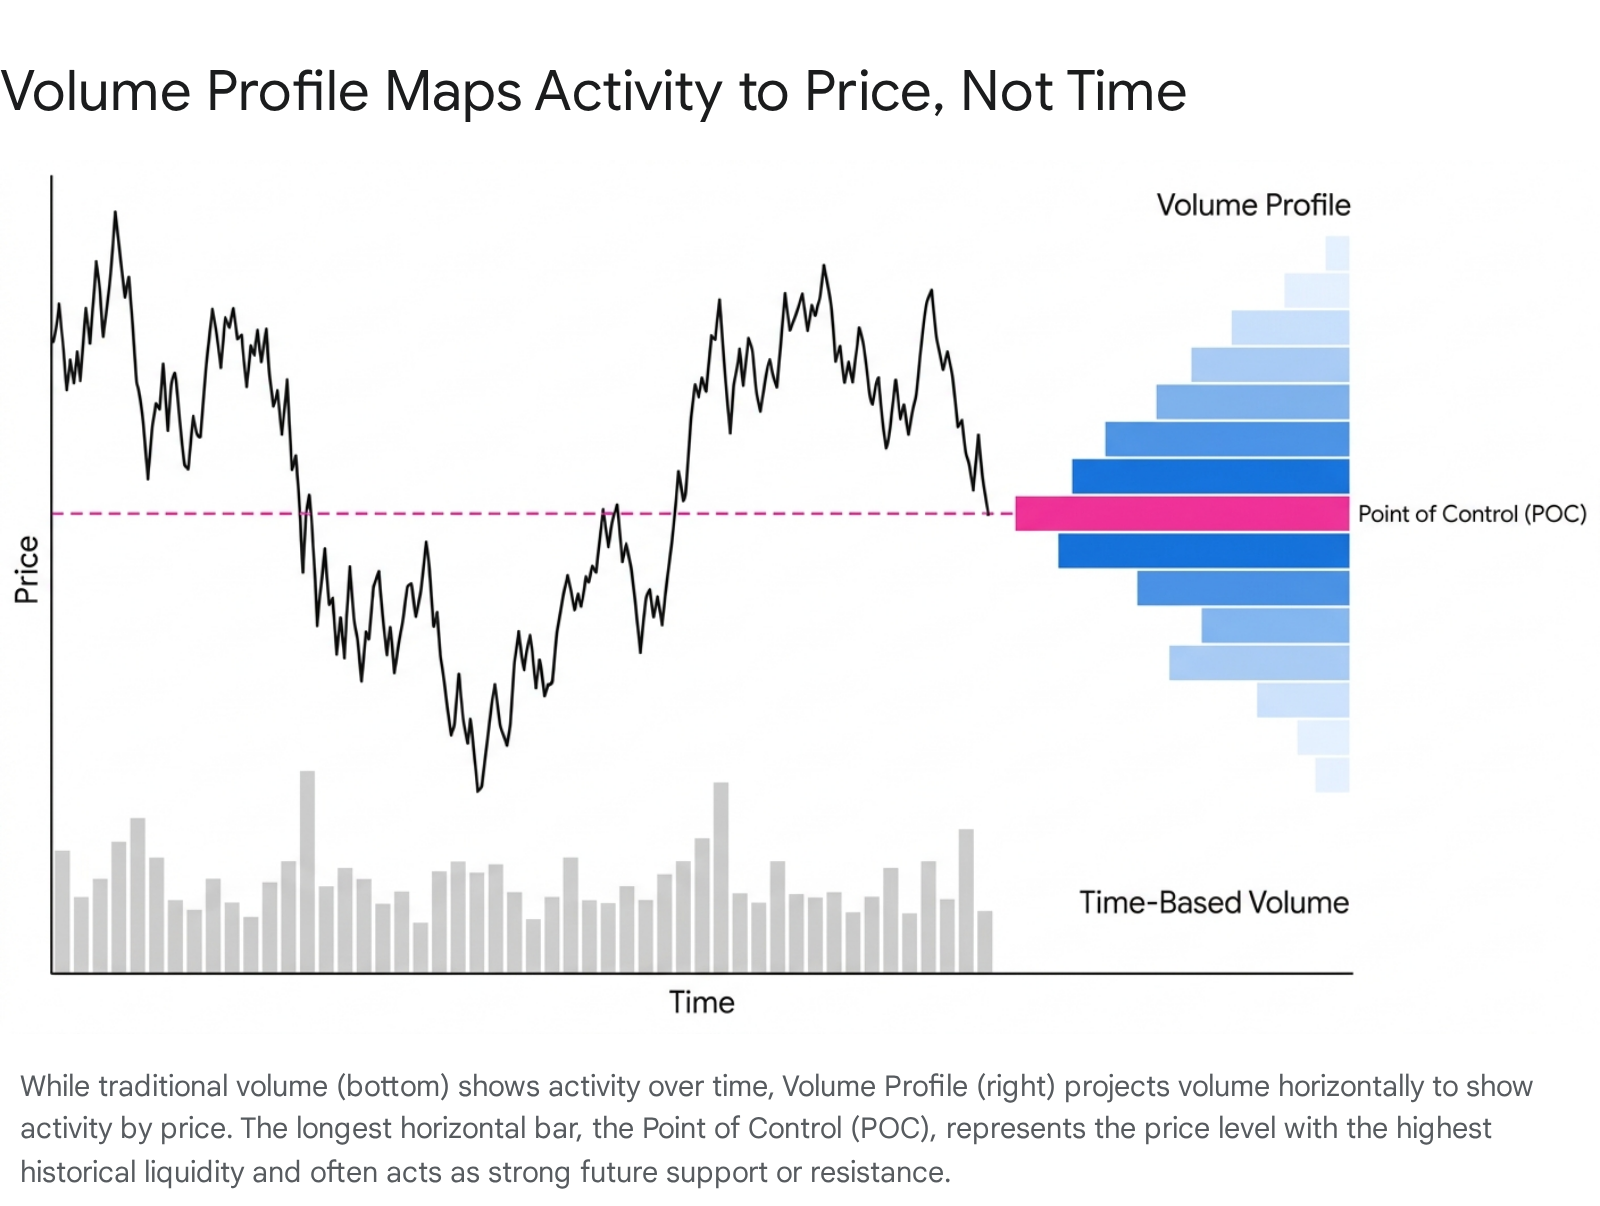
Traditional volume analysis looks at volume distributed over time (e.g., how many shares traded at 10:00 AM versus 11:00 AM). However, a more advanced charting methodology called Volume Profile completely changes this perspective by analyzing volume distributed by price 101112.
Instead of drawing vertical bars along the X-axis, Volume Profile draws a horizontal histogram along the Y-axis 1013. This visualizes exactly how much trading activity occurred at every specific price increment over a given period, regardless of when those trades happened 1129.
Finding Fair Value and the Point of Control
The price level with the longest horizontal bar is known as the Point of Control (POC) - the exact price where buyers and sellers agreed to transact the most volume 1329. By identifying the POC and the surrounding "Value Area" (usually representing the range where 70% of the volume occurred), traders can identify true market consensus regarding the fair value of an asset 1011.
High-volume nodes in a Volume Profile act as massive gravitational magnets. Because they represent areas where thousands of market participants have a vested interest, prices often naturally gravitate back toward the POC 1013. Conversely, low-volume nodes (gaps in the histogram) represent prices that the market previously rejected as either too expensive or too cheap 1113. When price enters a low-volume node, it typically slices through it very quickly because there is no historical liquidity to act as friction or support 1011.
Unlike proactive indicators like trend lines or moving averages that attempt to forecast future moves, Volume Profile is a reactive tool that shows exactly what already happened in the market 29. This backward-looking approach provides unbiased, direct data that helps traders understand why certain specific price levels matter far more than others 1129.
The High-Frequency Trading (HFT) Distortion
While the classic rules of volume confirmation remain vital, modern financial markets have evolved dramatically from the days of human floor traders shouting orders. By the mid-2020s, algorithmic and High-Frequency Trading (HFT) systems account for roughly 60% to 70% of total trading volume in U.S. equities, and up to 77% in continuous trading markets in places like the UK 141516. This massive technological shift has fundamentally altered how volume signals must be interpreted.
HFT firms use supercomputers, artificial intelligence models, and co-located servers (placed physically close to exchange matching engines) to execute thousands of orders in microseconds 17343518. These systems do not buy and hold assets based on company fundamentals; instead, they profit from tiny, fleeting price discrepancies, statistical arbitrage, and automated market-making strategies 171819.
Because these algorithms constantly place, modify, and cancel orders at dizzying speeds, they heavily inflate the daily trading volume numbers seen on retail charts 1534. The race for speed has moved from microseconds to nanoseconds, requiring specialized infrastructure that must manage immense thermal and power demands just to process the sheer quantity of automated quotes 3518.
Gross Volume vs. Net Volume
Academic research has increasingly pointed out a severe discrepancy in modern markets between "gross volume" (the total number of shares traded) and "net volume" (the actual directional accumulation or distribution by long-term investors like pension funds) 20.
According to financial economics literature, gross market volume has increased sharply over the last few decades, while net market volume has remained relatively flat. By some academic estimates, gross market volume now exceeds net volume by a staggering factor of 25 20. This implies that the vast majority of volume seen on a typical price chart is "noise" - rapid, round-trip trades executed by algorithms that do not reflect an economically meaningful reallocation of capital 20.
Consequently, a breakout accompanied by a minor volume spike on a short-term 5-minute chart might just be automated HFT behavior reacting to a news headline or crossing an order book threshold, rather than genuine institutional conviction 2021.
The Debate Over Ghost Liquidity
The proliferation of HFT presents a double-edged sword for financial markets, impacting how retail traders must approach volume analysis.
Proponents of HFT argue that this massive, continuous volume provides necessary market liquidity 14171819. By constantly quoting bids and asks, HFT compresses the spread between buy and sell prices, making it cheaper and more efficient for everyday investors to execute trades 3418.
However, critics and regulators warn that this volume often represents "ghost liquidity" 22. During periods of normal market conditions, HFT provides a steady stream of volume 3441. But during periods of high economic stress or sudden news shocks, these algorithms are programmed to protect their capital by abruptly canceling their orders and stepping away from the market 341941.
This sudden withdrawal of algorithmic volume removes the market's safety net, exacerbating price swings and occasionally triggering catastrophic "flash crashes" where prices plummet uncontrollably into a liquidity vacuum - most famously observed in the 2010 Flash Crash that wiped out nearly $1 trillion in minutes 152141. For a modern trader, this means that high volume is only a reliable confirmation signal if it is sustained over a longer timeframe and supported by fundamental catalysts, rather than just momentary algorithmic clustering.
When Fake Volume Tricks the Market
Because volume is such a heavily relied-upon indicator, bad actors occasionally attempt to manipulate it to artificially move prices. The U.S. Securities and Exchange Commission (SEC) has increasingly focused its enforcement resources on market manipulation schemes that rely on volume distortion 2324.
One of the most notable regulatory actions involving automated volume manipulation was the SEC's case against Athena Capital Research 25. The firm utilized an algorithm code-named "Gravy" to execute a high-frequency trading strategy known as "marking the close" 25. For six months, the firm deployed a massive number of aggressive, rapid-fire trades in the final two seconds of the trading day 25. By overwhelming the market's available liquidity with sheer volume right at the closing bell, the algorithm artificially pushed the closing prices of thousands of NASDAQ-listed stocks in the firm's favor 25. The SEC levied a $1 million penalty, marking the first enforcement action specifically targeting manipulative high-frequency volume 25.
Retail Scams and Manipulated Signals
Volume manipulation is not restricted to complex algorithms; it also targets retail investors through social engineering. The SEC has issued multiple investor alerts regarding "pump and dump" schemes organized on social media platforms and in private group chats 2627.
Fraudsters lure inexperienced investors into these chats - sometimes under the guise of using "AI-generated signals" or proprietary trading algorithms - and encourage coordinated buying of thinly traded, low-liquidity stocks 2627. The sudden influx of retail volume artificially spikes the price, triggering technical breakouts on charts that draw in unsuspecting outside traders. The orchestrators then sell their shares at the peak, causing the volume to dry up and the price to crash 2627. The SEC repeatedly warns investors never to rely solely on information from group chats, noting that true volume must be validated by fundamental research 26.
The Academic Debate: Does Volume Actually Predict the Future?
The question of whether volume contains independent predictive information over and above the information contained in prices alone has been a long-standing debate in financial economics 28.
Traditional efficient market hypotheses claim that prices instantly reflect all available information, rendering technical indicators like volume historically useless 2829. However, behavioral finance, empirical studies, and modern machine learning data paint a much more nuanced picture, suggesting volume is deeply tied to market psychology 2830.
The "Differences of Opinion" Theory
Several prominent academic models, including foundational work by researchers Hong and Stein, suggest that volume is a direct proxy for "differences of opinion" among investors 3132. When trading volume is unusually high without a proportionate change in fundamentals, it indicates intense disagreement about the true value of an asset 31.
Interestingly, studies from the National Bureau of Economic Research (NBER) note that negative price asymmetries - the tendency for markets to crash faster than they rise - are most pronounced in assets that have recently experienced heavy trading volume alongside steadily rising prices 3132. High volume in an extended uptrend can sometimes mask hidden bearish information. Because optimistic buyers are eagerly absorbing shares, pessimistic sellers are quietly offloading their positions without immediately crashing the price. Once that hidden supply is exhausted or the buying fervor wanes, the stage is set for a violent negative correction 3132.
The Quiet Period in Housing and Speculative Booms
This volume-first dynamic is not isolated to stock markets; it appears in macroeconomic cycles as well. In a sweeping NBER analysis of the U.S. housing cycle between 2000 and 2011, researchers found a profound lead-lag relationship between transaction volume and property prices 33.
During speculative booms, transaction volume rises dramatically as short-term buyers and non-occupant speculators enter the market 33. Crucially, as the market begins to turn, transaction volume typically falls rapidly before prices begin to decline - a phenomenon researchers refer to as "the quiet" period 33. During this quiet phase, prices remain artificially high while unsold inventory accumulates rapidly 33. In this context, declining volume while prices remain high is the ultimate leading indicator of an impending bust, proving that volume shifts happen before price capitulation 33.
Machine Learning and "Trading Volume Alpha"
While predicting the exact directional movement of future stock prices remains incredibly difficult, recent academic research reveals that volume itself is highly predictable using machine learning and advanced neural networks 3435.
Why does predicting volume matter to major institutions? Because volume dictates trading costs 34. When institutional funds rebalance their portfolios, their biggest hurdle is "price impact" - the cost of moving the market against themselves by buying too much of an illiquid stock 34. Price impact costs are highly non-linear; trading aggressively when volume is low results in exponentially steeper costs than trading conservatively when volume is high 34.
By using AI models that ingest hundreds of technical signals (like moving averages and earnings schedules), funds can accurately forecast future trading volume and optimize their trade execution 3435. They scale up their orders when predicted volume is high (lowering their price impact) and hold back when volume will be low 3435. Researchers refer to this execution optimization as "Trading Volume Alpha." The economic benefits of simply predicting volume and reducing trading friction are mathematically as large as the benefits gained from successfully predicting actual stock returns 3435.
Retail Sentiment: Volume as a Macroeconomic Barometer
Major brokerages also analyze aggregate retail trading volume to gauge broader economic sentiment. According to the Charles Schwab Trading Activity Index (STAX), which analyzes the behavior of millions of client accounts, retail trading volume often acts as a real-time pulse on consumer confidence 3637.
By tracking net buying and selling volume across specific sectors, analysts can detect subtle shifts in market philosophy. For example, if the broader stock market index is rising but retail volume is heavily rotating into defensive sectors like Consumer Staples and Utilities, it indicates that investors are quietly "de-risking" their portfolios despite outward market strength 36. Conversely, if indices are falling but retail trading volume remains robust in high-growth equities, it signals a strong "buy the dip" mentality and enduring market confidence 3637.
Fidelity Investments notes similar behavioral trends in their volume data. During periods of high market volatility, their data reveals distinct demographic differences: newer investors often maintain high volume in growth stocks and complex strategies, while tenured investors shift their volume toward more stable, income-generating assets 38. Ultimately, whether analyzed at the level of a single 5-minute stock chart or the macroeconomic behavior of millions of accounts, volume remains the truest measure of where money is actually moving.
Bottom line
Trading volume remains an indispensable tool for confirming the validity of price movements, acting as a crucial filter to separate genuine, institutionally backed breakouts from low-conviction fakeouts. By combining price action with indicators like OBV, VWAP, and Volume Profile, market participants can look beyond the simple timeline of a chart to locate true supply, demand, and hidden liquidity zones. However, the modern prevalence of High-Frequency Trading requires traders to be cautious; the sheer scale of algorithmic noise means volume must be analyzed in its broader structural and historical context, as sudden, short-term volume spikes do not always represent real economic shifts.