Why Do Backtested AI Strategies Fail in Live Trading
Backtested artificial intelligence trading strategies routinely fail in live markets because they are inadvertently optimized for a frictionless, non-existent past, falling victim to data-mining biases like overfitting and look-ahead bias. Furthermore, mathematical models constructed on historical data fail to account for the physical realities of live execution - such as slippage, liquidity constraints, and latency - and cannot dynamically adapt to macroeconomic regime shifts in fundamentally non-stationary markets.
In the contemporary financial landscape, everyday investors are besieged by algorithmic marketing promising guaranteed, passive returns generated by infallible AI trading bots. Social media platforms are flooded with "vibe-coding" tutorials where retail traders use generative models to build algorithms that boast 90% historical win rates, pitching the illusion that institutional-grade wealth is merely a prompt away 1. The retail reality, however, is far more perilous. Behind the curtain of pristine equity curves and sky-high Sharpe ratios lies a graveyard of trading bots that simply memorized the past but cannot navigate the dynamic, friction-heavy environment of live capital markets. The financial technology industry often presents backtesting as a crystal ball, convincing the general public that historical accuracy mathematically guarantees future profits. However, the transition from a sterile, historical dataset to the chaotic, live order book exposes the fragile, often deeply flawed assumptions upon which these algorithms are built. Real capital, real emotions, and real market physics immediately dismantle idealized simulations.
This comprehensive research report provides an exhaustive, expert-level examination of why quantitative and AI-driven trading strategies fail out-of-sample. By analyzing systemic methodological flaws, mathematical proofs of non-stationarity, market microstructure frictions, regional liquidity variances, and the specific hurdles facing the newest generation of Large Language Model (LLM) sentiment bots, this analysis illuminates the vast chasm between theoretical alpha and realized profit.
Why Do Trading Bots Look Like Geniuses in the Past but Lose Money Tomorrow?
To understand why backtests fail, one must examine the methodology used to create them. A backtest is a historical simulation of how a strategy would have performed in the past, but it is not a controlled scientific experiment 2. In physical sciences, experiments can be conducted in a laboratory and repeated endlessly to isolate variables. In quantitative finance, the past never repeats itself exactly 2. The primary culprits behind algorithmic failure are subtle, unintentional biases injected during the research and data-engineering phases, which institutional researchers refer to as the "sins of quantitative investing" 2.
The Overfitting Trap: Memorizing an Old Test
Overfitting is arguably the most pervasive and catastrophic error in quantitative backtesting 23. It occurs when an algorithm is excessively tailored to fit historical data, capturing random noise and idiosyncratic anomalies rather than persistent, repeatable structural market inefficiencies 34.
To demystify this quantitative jargon, consider a real-world analogy: Overfitting is akin to a student memorizing the exact sequence of answers to an old practice exam rather than actually learning the underlying subject matter. The student will naturally score a perfect 100% on that specific practice test (the backtest), but when they sit for the live exam and the questions are even slightly altered, they fail completely 4. In financial machine learning, financial data is inherently noisy. Any sufficiently flexible AI model with enough parameters can find patterns in this historical noise that produce an impressive-looking simulated equity curve 3.
Developers - especially retail traders participating in proprietary firm challenges - frequently succumb to the temptation of continuously tweaking moving average lengths, adding arbitrary session filters, or tightening stop-losses until the historical chart looks flawlessly profitable 25. Because these exact sequences of random historical fluctuations will never occur again, the over-optimized strategy collapses upon contact with live trading 23. A classic warning sign of an overfitted model is an extreme sensitivity to minor parameter adjustments; if shifting a moving average look-back period from 14 days to 15 days destroys the strategy's entire profitability, the algorithm has merely memorized a sequence of historical accidents rather than discovered a true market edge 36.
Look-Ahead Bias: Playing Chess with Future Knowledge
Look-ahead bias occurs when a backtest inadvertently utilizes information that would not have been available at the exact moment the trading decision was historically made 357. Returning to real-world analogies, this is the equivalent of playing a high-stakes game of chess while already possessing perfect knowledge of the opponent's next three moves. The resulting strategy appears brilliant and highly disciplined, but only because it possesses a logically impossible advantage 45.
This bias frequently manifests through the naive use of revised or restated macroeconomic and corporate data. For example, a publicly traded company might officially report its second-quarter earnings in July, but quietly restate those exact figures in a September regulatory filing due to an accounting revision 3. If a backtesting algorithm evaluating a trade signal on August 15th utilizes the revised September data, it is illegally peering into the future, rendering the simulation entirely invalid 34.
Subtler forms of look-ahead bias are embedded deep within coding architecture. A common error involves using the daily closing price to calculate an indicator, and then executing a trade at that exact same closing price, which is physically impossible in live markets due to latency 5. Similarly, utilizing index membership data that is accurate today (e.g., testing on the current S&P 500 constituents) but was not accurate ten years ago injects a systemic upward bias into the results 3.
Survivorship Bias and Data Engineering Flaws
Survivorship bias artificially inflates performance metrics by testing strategies exclusively on assets that exist today, completely ignoring entities that failed, went bankrupt, were acquired, or were delisted during the historical testing period 348. If an AI algorithm is backtested on the current Dow Jones Industrial Average constituents over the last two decades, it completely bypasses the catastrophic losses it would have incurred by holding companies like Lehman Brothers, Enron, or Sears 34. This fundamental error flatters a backtest by artificially selecting only the "winners," overstating average annualized returns by significant margins 3. In the highly volatile cryptocurrency market, where thousands of tokens are routinely delisted due to liquidity failures or fraud, ignoring dead assets results in dangerously skewed performance expectations 8.
Beyond survivorship, severe data engineering flaws destroy backtest integrity. A pervasive issue in retail and even institutional ML modeling is cross-validation leakage 9. Financial time series exhibit high serial correlation, meaning that data points at consecutive times are approximately equal. If a researcher randomly splits these points into training and testing sets, information from the future leaks into the training phase 9. Furthermore, the industry standard of chronological sampling - creating data bars based on fixed time intervals (e.g., daily or hourly closes) - generates skewed, non-normally distributed samples with non-constant variance 9. Because markets do not process information at a constant chronological rate, time bars create redundant observations that provide no new statistical information, leading models to over-weight quiet periods and under-weight highly volatile, critical market events 9.
Why Doesn't High Historical Accuracy Mathematically Guarantee Future Profits?
The U.S. Securities and Exchange Commission (SEC) explicitly mandates the disclaimer that "past performance is not indicative of future results" across all investment marketing materials 1011. While retail investors often dismiss this as boilerplate legal compliance, it is a fundamental mathematical reality rooted in the non-stationary nature of financial markets and the statistical illusions of multiple testing 1011.
The Non-Stationary Nature of Finance
For nearly a century, financial modeling relied heavily on standard econometrics and multivariate linear regression - tools explicitly designed for stationary environments where the underlying statistical properties (such as mean and variance) do not change over time 12. Financial markets, however, are violently non-stationary. The rules governing asset prices are constantly being rewritten by human behavioral shifts, central bank policy interventions, technological advancements, and geopolitical events 111213.
Quantitative researchers attempting to apply machine learning to finance face a critical mathematical hurdle known as the "Stationarity vs. Memory Dilemma." To make an ML algorithm converge and function correctly, quants often force financial data to become stationary by applying integer differentiation (e.g., measuring daily percentage returns instead of absolute dollar prices) 912. However, this mathematical transformation completely eradicates the "memory" of the original price series 9. By stripping the algorithm of its long-term context, the model loses its predictive forecasting power. Advanced techniques, such as fractional differentiation, can achieve stationarity while preserving memory, but standard out-of-the-box AI models deployed by everyday investors typically fail to implement this, resulting in models that cannot adapt to new probability distributions 9.
Selection Bias under Multiple Testing (SBuMT)
The myth that high historical accuracy guarantees future alpha is further dismantled by the statistical reality of multiple testing, a phenomenon academic researchers refer to as "pseudo-discoveries" 12. In modern quantitative firms, researchers and AI algorithms may run millions of iterative backtests on historical data to find a profitable strategy.
Statistically, if an algorithm conducts 1,000 unique trials on a completely random, mathematically unpredictable time series (a random walk), it will eventually stumble upon a strategy configuration that yields a maximum Sharpe ratio of roughly 3.0 purely by random chance 96. When practitioners only report the final "winning" strategy and fail to declare the thousands of failed, correlated attempts that led to it, they commit data snooping or Selection Bias under Multiple Testing (SBuMT) 26157.
To combat this illusion, leading institutional quants demand the use of advanced discount measures, such as the Deflated Sharpe Ratio (DSR) or the Probabilistic Sharpe Ratio (PSR) 96. These equations mathematically penalize the strategy's stated performance score based on the sheer number of trials conducted, the brevity of the data series, and the non-normality of the returns 296. Without applying these rigorous statistical adjustments, a backtest boasting an 85% win rate is statistically meaningless and highly likely to fail out-of-sample.
What Are the Hidden Costs the Simulator Ignores?
A simulated trading strategy operates in a frictionless vacuum. Backtesting engines inherently assume immediate order execution at desired prices, infinite market liquidity, and zero market impact from the algorithm's own trading activities 818. When transitioning to a live brokerage account, these hidden execution frictions act as a severe, compounded tax that swiftly transforms a winning backtest into a bleeding live strategy 18199.
The Mechanics of Slippage and Bid-Ask Spreads
Slippage is the precise financial discrepancy between the expected price of a trade generated by the model and the actual execution price realized at the exchange 81011. Classic backtests assume flawless execution at the historical close or open, but live markets, constrained by order book depth and latency, rarely comply 89.
Bid-ask spreads constitute the most basic and unavoidable form of slippage. A buyer must pay the higher ask price, while a seller receives the lower bid price. If a backtest naively utilizes the mid-price (the exact average of the bid and ask) without explicitly accounting for crossing the spread, it overestimates the return on every single transaction 3199. For high-frequency trading (HFT) algorithms that target microscopic price movements, the cost of crossing the spread can instantly negate the entire theoretical profit margin 1911. Furthermore, basic flat-rate transaction cost models (e.g., standard flat brokerage commissions) fail to accurately represent the dynamic, volatility-dependent nature of slippage, which widens dramatically during periods of market stress 11.
Market Impact and Non-Linear Liquidity Constraints
As algorithmic order sizes scale up, the bot's own activity begins to move the market against its desired position. If an AI agent attempts to buy 10,000 shares of a low-volume equity, it will consume the available liquidity at the best ask price, forcing the remainder of the order to fill at progressively higher prices deeper within the limit order book 91011.
Standard backtesting platforms critically overlook these volume constraints. A simulation might assume the successful purchase of 5,000 shares at a specific minute, even if the actual historical traded volume for that entire minute was only 2,000 shares 9. Real-world institutional algorithms strictly limit trade sizes to a maximum of 5% to 10% of the average daily volume to prevent this self-sabotage 69. To accurately model this, advanced quants employ non-linear stochastic price impact models, acknowledging that linear assumptions of liquidity wildly deviate from factual accuracy 23.
Furthermore, stop-loss orders - which are universally treated as guaranteed, absolute exits in backtests - transform into aggressive market orders when triggered in live environments. During a flash crash, a stop-loss designed to cap portfolio risk at 2% might suffer severe negative slippage, resulting in a 5% to 10% realized loss as the algorithm desperately hunts for non-existent buyers in a plunging market 9.
| Ideal Backtest Assumptions | Live Market Realities | Impact on AI Strategy Performance |
|---|---|---|
| Execution Price (Slippage) | Instant fills exactly at the historical close, open, or triggered limit price. | Latency delays execution; market orders sweep the order book, resulting in significantly worse entry/exit prices. |
| Liquidity & Market Impact | Infinite liquidity; orders of any theoretical size are filled without moving the asset's price. | Large orders consume available liquidity, moving the market against the bot (non-linear price impact). |
| Transaction Frictions | Zero costs, or fixed flat-rate commissions; bid-ask spread is often ignored by using mid-prices. | Variable bid-ask spreads that widen dramatically during volatility; high borrowing costs for shorting assets. |
| Data Integrity & Labeling | Clean, continuous chronological data; fixed-time-horizon labeling with perfectly aligned indicators. | Missing data, erroneous ticks, exchange API failures, and non-IID samples with heavy cross-correlation. |
| Information Availability | Future data (e.g., restated earnings, index rebalancing, tomorrow's closing price) leaks into current logic. | Only strict point-in-time data is available; decisions must be made under absolute statistical uncertainty. |
| Market Environment | The market is a stationary system where past repeating patterns will reliably continue indefinitely. | Markets are violently non-stationary; macroeconomic regimes shift dynamically and permanently over time. |
How Do Market Realities Differ Between Liquid Equities and Illiquid Crypto?
The failure rate of backtested algorithms is not uniform; it is highly dependent on the asset class, the specific regional market structure, and the baseline liquidity of the instruments being traded. The frictional forces that destroy quantitative strategies are magnified exponentially in fragmented, low-liquidity environments.
The S&P 500: High Liquidity and Favorable Execution
In highly liquid Western equities, such as S&P 500 constituents, slippage and market impact are generally minimal for retail-sized algorithmic orders 3810. The incredibly deep order books and stringent regulatory frameworks of major U.S. exchanges ensure that bid-ask spreads remain extremely tight, often costing just a few basis points 38. Statistically, the S&P 500 is characterized by low-volatility, mean-reverting behavior in the long run. Advanced General Tempered Stable (GTS) distribution analysis demonstrates that 80.05% of daily S&P 500 returns are tightly bound between -1.06% and 1.23% 12.
Institutional-grade AI agents operating in these favorable environments, such as those trading mega-cap financial stocks, can achieve remarkable precision. For instance, sophisticated AI bots trading highly liquid names like Goldman Sachs or Morgan Stanley have demonstrated exceptional empirical win rates (exceeding 80% in specific tracked instances) in live trading because the deep market structure perfectly supports the execution parameters tested in simulation 25.
Cryptocurrency: Extreme Volatility and Systemic Execution Risk
Conversely, cryptocurrency markets present a notoriously hostile environment for naive algorithmic strategies. Bitcoin experiences annualized price swings three to four times larger than traditional equity markets, exhibiting severe heavy-tailedness in its return distribution 1226. While the S&P 500 experiences standard bear market drawdowns of 20-35%, Bitcoin routinely relies on momentum to generate 200-300% returns before suffering 60-80% cyclical corrections 1226. The average Value-at-Risk (AVaR) for Bitcoin returns is roughly four times larger than that of the S&P 500 12.
Trading illiquid token pairs exacerbates backtest divergence. In crypto, slippage can easily exceed 1% per trade when liquidity thins out during weekend sessions or Asian market hours 8. Furthermore, API latencies, sudden exchange downtime, and highly fragmented liquidity across dozens of unregulated global exchanges mean that an algorithm might receive a fill price vastly different from the simulated benchmark 627.
The consequences of deploying unconstrained AI in crypto without rigorous execution controls can be catastrophic. In early 2026, an autonomous AI trading bot built by a prominent industry developer misread a social media post and erroneously sent $441,000 worth of tokens to a stranger 28. Shortly after, an autonomous agent powered by GPT-5 - one of the most advanced generative models available - lost 62% of its capital trading highly leveraged crypto perpetual futures on the Hyperliquid exchange with zero human oversight 28. Conversely, constrained AI agents (such as the Polystrat agent) operating on prediction markets like Polymarket with strict binary risk limits executed thousands of trades profitably 28. The defining distinction between these outcomes lies not in the underlying intelligence of the AI, but in the rigid enforcement of domain-specific risk parameters and execution constraints 628.
Do the New LLM-Based Sentiment Bots Face Different Hurdles Than Traditional AI?
The landscape of algorithmic trading underwent a radical paradigm shift between 2024 and 2026 with the integration of Large Language Models (LLMs) like GPT-4, DeepSeek-R1, and specialized domain models like FinBERT into trading architectures 29303132. These generative models ingest massive volumes of unstructured text - global news headlines, FOMC transcripts, corporate earnings calls, and social media feeds - to gauge market sentiment and predict forward asset returns 3032.
While traditional statistical models rely purely on numeric price and volume derivatives, LLMs introduce semantic understanding, successfully identifying behavioral inefficiencies and delayed arbitrage opportunities in real-time 3134. Extensive empirical studies analyzing nearly one million U.S. financial news articles demonstrate that advanced transformer models like OPT achieve remarkable sentiment prediction accuracy (up to 74.4%) 35. This vastly outperforms traditional academic methodologies, such as the Loughran-McDonald lexicon dictionary, which languishes at roughly 50.1% accuracy 35. In out-of-sample portfolio simulations, long-short strategies driven by OPT generated Sharpe ratios exceeding 3.05, compared to just 1.23 for legacy dictionary models 35.
However, deploying these highly complex generative models in live financial environments introduces a distinct set of novel execution hurdles that do not exist in traditional machine learning.
Execution Latency vs. Signal Decay
Traditional quantitative bots evaluate deep technical indicators and execute trades in microseconds. In stark contrast, LLMs suffer from massive processing complexity and inherent inference latency 323637. Passing vast amounts of contextual text through a multi-billion-parameter neural network takes milliseconds to several seconds, depending on the context window and the provider's API constraints 3237. This latency makes direct LLM execution completely unviable for ultra-high-frequency trading (HFT), where physical execution must occur before the sentiment signal decays 3236.
Researchers have attempted to bypass this latency bottleneck by fundamentally decoupling strategy generation from minute-level deployment. Emerging systems like the "TiMi" (Trade in Minutes) architecture use heavy LLMs at the macro level to formulate the strategy, code the specific execution logic, and then hand it off to a low-latency, programmatic mechanical bot for the actual execution 31. This removes the LLM from the continuous, latency-sensitive inference loop 31. Furthermore, 2024 research revealed that running LLM trading agents at lower frequencies - such as monthly decision intervals rather than daily or weekly - achieved comparable risk-adjusted returns (Sharpe ratio of 1.10 vs 1.17) while drastically reducing maximum drawdowns and cutting API infrastructure costs by 95% 38.
The Signal Coverage Density Paradox
Perhaps the most counterintuitive and dangerous hurdle for modern LLM trading bots is the issue of signal coverage density. A landmark 2026 study evaluating LLM-augmented reinforcement learning (RL) on the Nasdaq-100 discovered a complex, non-monotonic relationship between LLM signal injection and actual trading performance 39.
Researchers found a clearly identifiable "harmful regime." When LLM sentiment signals were injected into the RL trading pipeline at 5% and 20% coverage densities, the bot's performance actively degraded, falling below the returns of a baseline model that used no LLM signals whatsoever 39. Furthermore, the LLM-augmented RL agent (which achieved a 158.11% cumulative return) was vastly outperformed by standard, non-RL baselines like an equal-weight buy-and-hold strategy (235.00%) 39. The LLM signals only became net-positive contributors when coverage density exceeded the 50% threshold 39.
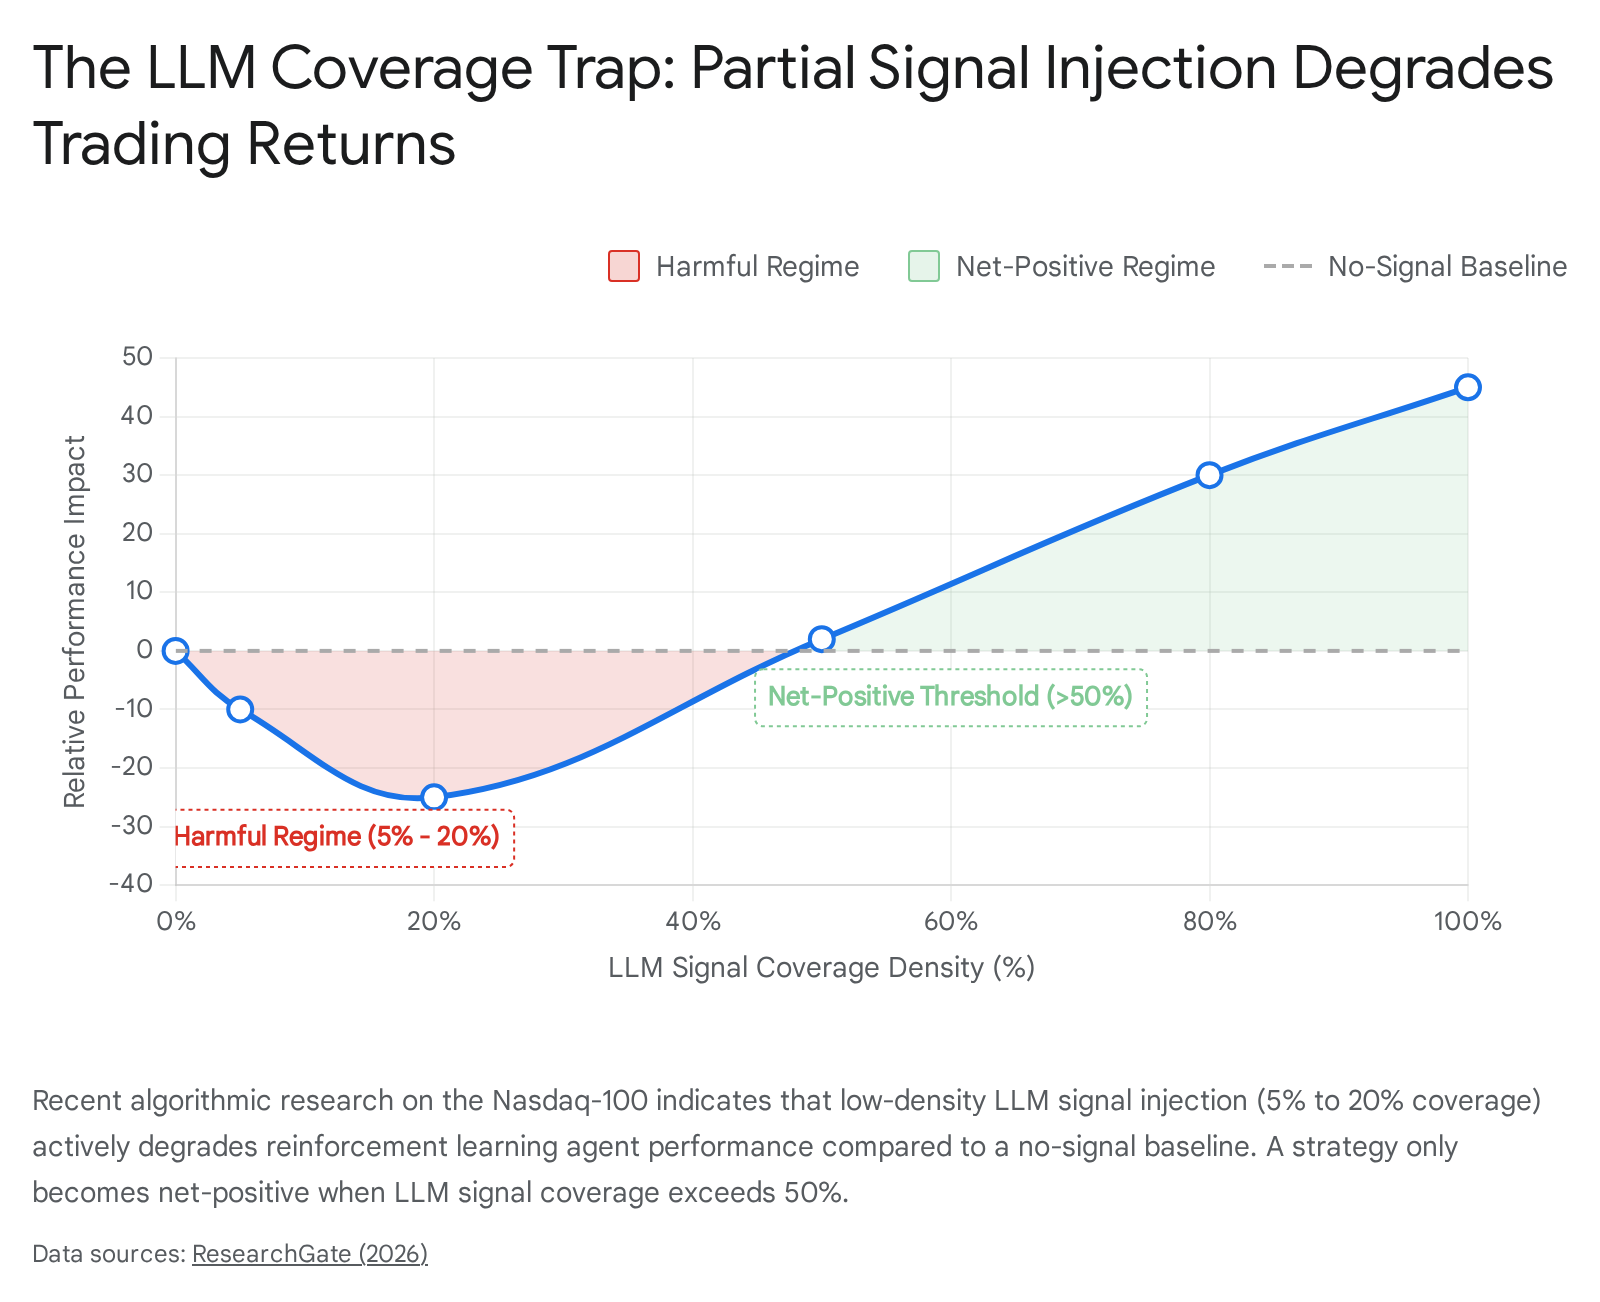
Because many standard financial news datasets (such as the FNSPID dataset) only contain roughly 9.7% non-neutral, actionable news coverage, typical retail implementations of LLM bots today are unknowingly operating deep inside this harmful regime, actively destroying capital by attempting to force AI into environments with insufficient signal density 39.
AI Hallucinations in High-Stakes Financial Contexts
Generative AI models are fundamentally probabilistic engines designed to predict the next most likely word in a sequence; they are not inherently designed to verify absolute factual accuracy 40. This architectural trait leads to "hallucinations" - instances where the LLM generates plausible, highly confident, but entirely fabricated information 4041.
In a live financial bot, hallucinations represent an unacceptable execution risk. Even with advanced Retrieval-Augmented Generation (RAG) systems designed to anchor the AI in verified external documents, models struggle with fine-grained financial diagnostics, context-tracking failures across multi-turn logic, and localized market nuances 404142. If a standard customer support chatbot hallucinates a non-existent company refund policy (as seen in recent airline industry failures), a human user is merely inconvenienced 41. However, if an autonomous LLM trading agent hallucinates a massive corporate earnings beat or misinterprets a central bank transcript, it will instantaneously deploy leveraged capital into a fabricated premise 4142. Extensive financial benchmarks, such as K-FinHallu, demonstrate that "justified abstention" - the vital ability of an AI to admit it does not know the answer rather than guessing - remains the absolute weakest metric across all frontier models 42. This lack of epistemological humility makes fully autonomous, unconstrained LLM execution highly dangerous for retail capital.
What Happens When the Macroeconomic Environment Changes?
A foundational reason both traditional and AI-driven strategies bleed capital in live markets is their catastrophic inability to adapt to macroeconomic regime shifts 31323. A market regime refers to the prevailing, overarching structural economic conditions, such as prolonged periods of high or low inflation, rising or falling central bank interest rates, or shifting levels of baseline market volatility 13.
Algorithms are inherently backward-looking. A quantitative model trained exclusively during the low-interest-rate, quantitative-easing bull market of the 2010s will have "learned" that aggressively buying every dip in technology equities guarantees a high-probability profit 3413. However, if the macroeconomic regime violently shifts to a high-rate, inflationary environment with elevated geopolitical conflict - such as the dynamics observed in the 2026 markets - the fundamental laws of market physics change 131314.
During severe regime shifts, historical asset correlations break down entirely. For instance, Bitcoin and the S&P 500 exhibited negative correlation prior to 2020, spiked to a highly positive correlation (+0.70 to +0.88) during waves of institutional ETF adoption, and then violently decoupled again during forced deleveraging events in early 2026, where crypto absorbed a $467 billion leverage reset while equities remained stable 261546. A mean-reversion algorithm perfectly optimized for range-bound conditions will suffer catastrophic, account-clearing drawdowns if deployed during a massive, trending breakout 347.
Furthermore, programmatic regime detection is subject to severe execution lag. Advanced sentiment-driven bots utilizing the VIX (Volatility Index) as a hard threshold to rotate portfolios from risk-on to risk-off often suffer heavy losses because VIX breaches do not instantaneously confirm a regime shift 34. By the time the algorithm officially detects the transition from low to high volatility, the most aggressive asset repricing has already occurred 34. The bot is left to execute defensive trades at highly unfavorable prices amidst widening bid-ask spreads, effectively selling the bottom 34. Institutional quantitative funds survive not by predicting the exact future, but by rigorously stress-testing their models across multiple extreme historical regimes (e.g., the 2008 financial crisis, the 2020 pandemic crash, the 2022 aggressive rate hikes) to ensure the strategy does not rely on a single, irreplicable economic climate 313.
What Are the Practical Takeaways for Everyday Investors?
The illusion of automated, effortless wealth heavily marketed to retail investors masks the rigorous, unforgiving reality of quantitative algorithmic trading. For everyday investors looking to evaluate, purchase, or deploy AI trading bots, several critical safeguards must be implemented to bridge the gap between idealized simulation and live capital reality:
| Actionable Takeaway | Rationale & Implementation Strategy |
|---|---|
| Demand Out-of-Sample and Walk-Forward Testing | Never trust a strategy validated solely on "in-sample" data (the historical data used to build the model). Robust systems use an "embargo period" or walk-forward analysis, continuously testing the strategy on blind, unseen data to simulate true live forecasting capability 23615. |
| Apply Highly Conservative Friction Models | Always assume the market microstructure will work against you. If actual average transaction costs are estimated at 0.10%, force the backtest to clear a 0.15% to 0.20% hurdle 348. Ensure the backtest explicitly penalizes market orders with realistic slippage algorithms based on volume and volatility 1927. |
| Beware of "Parameter Soup" and Curve Fitting | If an AI bot boasts dozens of hyper-specific parameters (e.g., a 13.4-period RSI combined with a 41-minute MACD running on a Tuesday), it is almost certainly overfitted to past noise. True market inefficiencies are broad and persistent; they do not require microscopic tuning to remain profitable 327. Keep models mathematically simple. |
| Mandatory Forward Testing in Paper Environments | Before risking a single dollar of live capital, deploy the strategy in a live paper-trading environment for several weeks or months. This exposes the bot to real-time data feeds, actual order book depths, and API latency, instantly revealing structural flaws that historical backtests hide 6949. |
| Strictly Constrain the AI's Agency | Do not give an LLM or autonomous agent unconstrained access to capital across illiquid derivatives. The most successful AI deployments operate within strictly defined risk limits, trade highly liquid assets (like large-cap equities), and often require a human-in-the-loop for final execution validation 2850. |
| Verify Regime Resilience | Demand proof that the bot has been stress-tested across explicitly different macroeconomic regimes (e.g., a bull market, a high-inflation bear market, and a sideways consolidation period). If it only works during quantitative easing, it is not a viable long-term strategy 313. |
Bottom Line
Backtested AI strategies fail in live trading because they are systematically and inadvertently optimized for a frictionless, non-existent past. They fall victim to catastrophic data-mining errors like overfitting, look-ahead bias, and the false mathematical assumption that historical patterns in non-stationary markets will repeat indefinitely. When exposed to the physical realities of live capital markets - slippage, non-linear market impact, API latency, and macroeconomic regime shifts - the simulated quantitative edge evaporates. For modern LLM-based sentiment bots, these traditional hurdles are further compounded by severe inference latency, the persistent risk of data hallucinations, and the paradoxical requirement for massive signal density to achieve baseline profitability. Ultimately, a backtest should never be viewed as a guarantee of future wealth; rather, it is merely a preliminary diagnostic tool designed to determine if a strategy is mathematically robust enough to survive the brutal, unpredictable friction of the real world.