How to Research Colleges Beyond the Brochure
The most effective way to evaluate a college is to ignore its promotional marketing and instead analyze its standardized institutional data, federal earnings outcomes, and financial aid methodologies. By cross-referencing tools like the Common Data Set, the College Scorecard, and the Social Mobility Index, prospective students can accurately determine a school's true cost, admissions priorities, and return on investment.
The Anatomy of College Marketing: Subjective Claims vs. Objective Data
Higher education marketing relies heavily on promotional language designed to evoke an emotional response. Brochures, campus tours, and university websites frequently utilize terms like "holistic admissions," "vibrant campus life," and "intimate learning environments." In the realm of advertising research and consumer behavior, these phrases are categorized as subjective marketing claims, or "puffery" 11. Subjective claims are qualitative, based on personal interpretation, and generally immune to strict scientific verification 23.
Conversely, objective data provides factual, verifiable, and consistent measurements that are not influenced by personal feelings 123. When evaluating higher education institutions, the primary challenge is translating the subjective puffery of a college brochure into measurable, objective data points. Measuring educational gain and institutional quality is notoriously difficult, even for academic researchers. Scholars frequently note the "methodological tensions" in higher education research between quantitative approaches - which prioritize consistency and comparability - and qualitative methodologies that seek to capture the nuanced complexities of student transformation 456.
Because institutions often present data in ways that flatter their specific strategic goals, families must act as mixed-methods researchers. They must navigate these methodological tensions by combining hard, standardized statistics with on-the-ground qualitative observations. The table below illustrates how common subjective marketing claims can be mapped to objective, verifiable data sources to cut through the institutional spin.
| Subjective Marketing Claim (Puffery) | Objective Data Metric | Primary Data Source |
|---|---|---|
| "Small class sizes and personalized attention" | Percentage of class sections with fewer than 20 students; pure undergraduate class size distribution. | Common Data Set (Section I) |
| "Holistic admissions process" | The specific weight placed on GPA, essays, recommendations, and demonstrated interest. | Common Data Set (Section C) |
| "Generous financial aid packages" | Percentage of demonstrated need met; average need-based award; percentage of affluent students receiving merit aid. | Common Data Set (Section H) |
| "Excellent return on investment (ROI)" | Median earnings of former students 10 years after enrollment; typical debt loads. | U.S. College Scorecard |
| "An engine of opportunity and diversity" | Pell Grant recipient enrollment; graduation rates of low-income students; post-graduate financial mobility. | Social Mobility Index |
What Is the Common Data Set?
The most potent, yet frequently overlooked, tool in the college research process is the Common Data Set (CDS). The CDS is a standardized, 30-plus-page report produced annually by higher education institutions 8710. It was developed as a collaborative initiative among data providers like the College Board, Peterson's, and U.S. News & World Report to streamline the reporting of institutional data and reduce the burden on university research offices 118.
Because nearly all accredited colleges participate and use the exact same reporting structure, the CDS allows for true apples-to-apples comparisons between universities, bypassing the marketing department entirely 81314. While institutions rarely advertise their CDS, it is generally publicly accessible. A simple search query for "[Institution Name] Common Data Set" or navigating to a university's Office of Institutional Research will usually yield the document in PDF or Excel format 8139.
The CDS is divided into ten core sections, spanning from General Information (Section A) to Degrees Conferred (Section J) 10119. While every section offers value, three sections are particularly critical for prospective applicants attempting to gauge their admissions chances, estimate costs, and verify class sizes.
Section C: Demystifying the Admissions Formula
Section C of the Common Data Set strips away the ambiguity of college admissions. It provides detailed statistics on first-time, first-year applicants, including the total number of applicants, the number admitted, and the number who ultimately enrolled, broken out by gender 11916.
Crucially, Section C7 features a matrix where the institution must explicitly rank the importance of various academic and non-academic factors in their admissions decisions. Colleges must categorize factors such as the rigor of the secondary school record, class rank, standardized test scores, application essays, extracurricular activities, and "level of applicant's interest" (demonstrated interest) into one of four categories: "Very Important," "Important," "Considered," or "Not Considered" 71017.
This matrix is invaluable for application strategy. If a university lists demonstrated interest as "Not Considered," the applicant does not need to waste time opening every promotional email or scheduling unnecessary virtual tours. Conversely, if application essays and extracurriculars are marked "Very Important," the narrative quality and profile depth of the application carry significant weight 17.
To understand how this data can shape a student's approach, consider how different types of institutions might fill out this matrix. Data from Section C7 reveals exactly which application components an institution prioritizes, highlighting the stark contrast between universities that heavily value test scores versus those that prioritize essays or demonstrated interest.
| Admissions Factor (CDS C7) | Highly Selective Private University | Regional Public University |
|---|---|---|
| Rigor of secondary school record | Very Important | Important |
| Standardized test scores | Very Important | Considered |
| Application Essay | Very Important | Not Considered |
| Extracurricular activities | Important | Considered |
| Level of applicant's interest | Considered | Not Considered |
| Volunteer work | Important | Not Considered |
Section C also provides the middle 50 percent ranges for GPAs and standardized test scores of enrolled students 813. This data allows students to categorize institutions realistically into "reach," "match," or "safety" categories based on their own academic profiles 87. Furthermore, it details how many students were accepted via Early Decision versus Regular Decision. If a significant portion of the incoming class - often 40 percent or more at highly selective institutions - is filled through early rounds, it indicates that the school heavily rewards early applicants 1617.
Section H: The Reality of Financial Aid
Section H reveals the financial realities of an institution, separating the advertised sticker price from the actual cost of attendance. This section details whether an institution is need-blind, meaning it makes admissions decisions without considering the applicant's ability to pay, or need-aware, meaning a family's financial situation may factor into the final admissions decision 7.
More importantly, Section H provides the exact number of students who applied for need-based aid, the number who were determined to have financial need, and the number whose need was fully met 119. If an institution consistently fails to meet 100 percent of demonstrated need, families must be prepared to cover the resulting financial gaps through private loans, parent loans, or out-of-pocket payments.
For affluent families who do not qualify for need-based aid, Section H2a is critical. This section discloses the number of students without financial need who were awarded institutional non-need-based scholarship or grant aid (commonly known as merit aid), as well as the average dollar amount of those awards 119. This specific data point dictates whether an applicant should reasonably expect an academic scholarship to offset costs or if they must prepare to pay the full sticker price.
Section I: Instructional Faculty and Class Size
Marketing brochures invariably highlight small class sizes and close, mentoring relationships with professors. Section I of the CDS provides the raw data necessary to test these claims. It forces universities to report their actual student-to-faculty ratio, strictly utilizing the definitions provided by the American Association of University Professors (AAUP) 10. However, savvy researchers know that student-to-faculty ratios can be highly misleading. Universities often include faculty members who only teach graduate students, or they include graduate teaching assistants who oversee massive undergraduate sections, artificially lowering the ratio 9.
To find the truth, researchers must look at Section I-3, which breaks down undergraduate class sizes into specific, hard numerical ranges (e.g., 2-9, 10-19, 20-29, and up to 100+ students) 816. Instead of relying on a blended average that might obscure the reality of massive freshman lecture halls, applicants can see exactly what percentage of courses are genuinely intimate seminars containing fewer than 20 students 89.
The Shifting Standardized Testing Landscape
The role of standardized testing in college admissions has undergone immense volatility since the onset of the COVID-19 pandemic. In the spring of 2020, widespread testing center closures prompted a massive, sudden shift toward test-optional policies. While this was initially a temporary emergency measure, many institutions maintained these policies for several years. This triggered an 83 percent surge in total application volumes across the Common Application, fundamentally shifting how test data is reported and interpreted 1120.
The Artificial Inflation of Score Ranges
When evaluating the middle 50 percent SAT or ACT ranges of a university in the current test-optional environment, applicants must account for statistical inflation. Under test-optional policies, students engage in a practice known as strategic withholding. Generally, only applicants with scores that fall at or above an institution's historical median choose to submit them, while those with lower scores withhold them to avoid penalizing their applications 112012.
This self-selection bias artificially inflates the reported averages, making institutions appear far more selective than they actually are. For example, a comprehensive study utilizing data from over one million Common Application users revealed that between 2019 and 2020, the average submitted SAT score at selective colleges increased by 3.7 percent, rising from 1238 to 1284 20. This was entirely due to strategic withholding rather than an actual, sudden increase in applicant aptitude.
The data from Cornell University provides a stark case study of this phenomenon. Prior to the pandemic, approximately 70 percent of enrolled students at Cornell submitted SAT scores. During the test-optional period, that number plummeted to roughly 41 percent for the Class of 2025 and remained similarly low for subsequent classes 12. Consequently, the middle 50 percent range of submitted SAT scores at Cornell shrank and shifted upward dramatically, moving from 1410-1530 for the Class of 2024 to 1480-1550 for the Class of 2027 12. The 25th percentile score increased by a massive 70 points.
Therefore, a score that appears to be below the 25th percentile of a test-optional institution's current, inflated reported range may have been perfectly competitive just a few years prior. When researching testing profiles, students should cross-reference pre-pandemic data to understand an institution's true baseline.
The Return to Test-Preferred and Test-Required
Despite the widespread popularity of test-optional policies, long-term institutional data has recently led several highly selective universities to reinstate testing requirements. Internal research from institutions like the Massachusetts Institute of Technology (MIT), Yale University, and Johns Hopkins University has consistently shown that standardized test scores remain highly valid predictors of first-year college outcomes, early college GPAs, and retention rates - particularly in rigorous STEM fields where SAT and ACT math performance correlates strongly with success 111314.
Furthermore, intensive research indicates that test-optional policies largely failed to achieve their primary stated goal: expanding access and equity. The Harvard Kennedy School study by Dr. Christopher Avery found that test-optional policies did not increase application rates among Black, Latino, and first-generation students to elite institutions 20. In fact, application rates to the most selective colleges actually declined among these target populations who scored below the median in 2020 and 2021 20.
Institutions like Johns Hopkins found that the test-optional environment actually discouraged some less-advantaged applicants from submitting scores that would have provided a positive, validating signal of their academic abilities. The university noted that some less-advantaged students with favorable test scores chose to suppress them, withholding critical information that would have provided positive context to their application, resulting in a "lost opportunity" for both the student and the university 14.
When researching a college's testing policy, applicants must look beyond the marketing definition of "optional." If the Common Data Set reveals that a vast majority of the enrolled class submitted scores, the institution is fundamentally "test-preferred." In these environments, strong test scores remain one of the few quantifiable ways to stand out in a record-breaking applicant pool, and withholding a score may put an applicant at a distinct disadvantage 11.
The FAFSA Overhaul and Financial Reality
Understanding how a college assesses financial need is paramount to making a sound educational investment. For decades, the Free Application for Federal Student Aid (FAFSA) generated a metric called the Expected Family Contribution (EFC). In 2020, Congress passed the FAFSA Simplification Act, which mandated a complete overhaul of the federal aid system. The goal was to streamline the application process by pulling financial information directly from the IRS and reducing the number of application questions from over 100 to as few as 18 15.
This act officially replaced the EFC with the Student Aid Index (SAI) starting in the 2024-2025 academic year 25262716.
SAI vs. EFC: Meaningful Mathematical Differences
The transition from EFC to SAI was not merely a cosmetic rebranding exercise; it altered the fundamental mathematics of federal aid eligibility and shifted who receives the most support 252729.
Several key formulaic changes heavily impact how families should project their potential college costs:
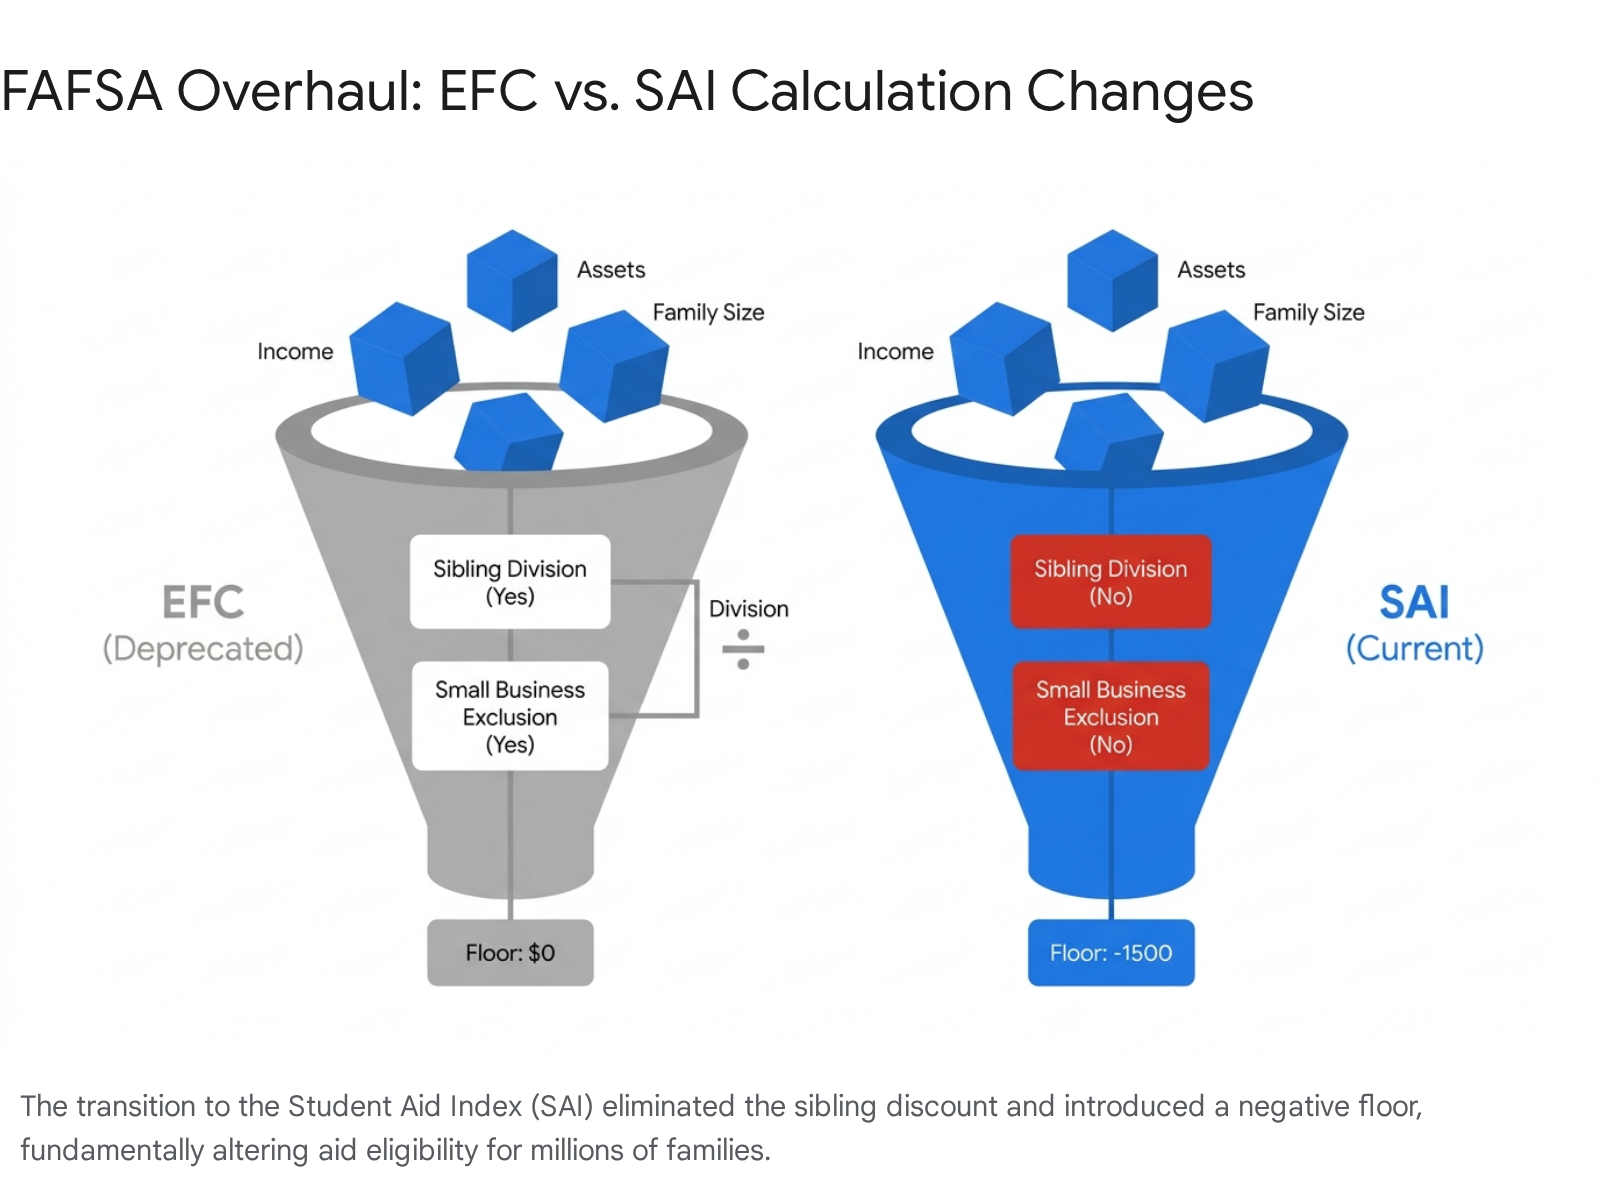
- The Floor is Now Negative: The old Expected Family Contribution bottomed out at $0. The new Student Aid Index can drop as low as -1,500. This negative range allows institutions to differentiate between students with standard financial need and those with the absolute highest need, maximizing Pell Grant eligibility for the lowest-income brackets 25262729. An SAI of -1,500 does not mean the federal government will write the student a check for $1,500; rather, it serves as a high-priority index flag for maximum aid targeting 2527.
- Removal of the Sibling Discount: Under the old EFC formula, families with multiple children in college simultaneously received a massive benefit: their expected contribution was essentially divided by the number of enrolled children. The SAI formula entirely eliminates this multi-child discount. For middle-class families with overlapping college enrollments, this single change can shift their financial picture by thousands of dollars per year, resulting in drastically higher expected costs 25272930.
- Asset Inclusion Changes: The new SAI formula mandates the inclusion of the net worth of small family businesses and family farms as assets. These assets were previously excluded under the EFC model. This change significantly alters aid eligibility for families who own land or small enterprises, making them appear wealthier on paper than they did under the old system 252930.
Because of these profound formulaic changes, historical financial aid data or older EFC-based guidance found on older blogs is largely obsolete.
The Fallout of the 2024 FAFSA Rollout
The rollout of the overhauled FAFSA system was a logistical disaster characterized by severe technical failures, calculation errors, and crippling delays. Originally slated for its traditional October 1 release, the new form was not available until late December 2023 1530. The delays compounded when the Department of Education discovered a massive calculation error affecting hundreds of thousands of submitted applications, forcing a total reprocessing effort 3132.
Because colleges lacked the necessary, verified federal data, they could not generate timely financial aid award letters. Students were forced to wait well past traditional deadlines, often having to make rushed enrollment decisions blindly, without knowing their actual out-of-pocket costs 15303132. When applicants attempted to seek help, they were met with silence; a Government Accountability Office (GAO) report revealed that 74 percent of calls to the Department of Education's call center went entirely unanswered due to severe understaffing 15.
This rolling catastrophe resulted in a 9 percent decline in submitted FAFSA applications among first-time applicants by late summer, representing roughly 432,000 fewer applications 15. This drop disproportionately impacted low-income and first-generation students who rely entirely on federal aid transparency to make higher education possible, leading many to abandon their college plans entirely 3033.
Given the extreme volatility of the federal aid system, families researching colleges must prioritize the use of institution-specific Net Price Calculators (NPCs). While the Common Data Set shows historical average aid metrics, an NPC utilizes a specific university's institutional methodology to estimate actual out-of-pocket costs based on the family's exact, current financial profile 7.
Measuring Post-Graduation Outcomes with Federal Data
To measure the actual return on investment of a college degree, researchers must look beyond a university's self-reported, cherry-picked alumni success stories. The U.S. Department of Education's College Scorecard is the most comprehensive, objective tool for this purpose 343517.
Launched to increase institutional accountability and bypass the marketing spin of higher education, the College Scorecard contains thousands of variables spanning nearly two decades of data 3435. It links Department of Education data on students who received federal financial aid with actual, verified earnings data from the U.S. Department of the Treasury 3417.
The Scorecard provides critical post-graduation metrics, most notably the median earnings of former students ten years after they entered the institution, alongside typical debt loads and median monthly education loan payments 3517. Crucially, the Scorecard's completion and default rate data is highly robust. It utilizes the National Student Loan Data System to track students over an eight-year period. This extended timeline captures students who leave an institution, transfer, and graduate elsewhere, correcting a massive historical flaw in traditional graduation rate calculations that often penalized community colleges and regional universities 35.
However, researchers must be aware of the Scorecard's specific methodological limitations. Because of congressional bans on creating a universal federal student-level database, the Department of Education is legally restricted to reporting data solely on students who received federal financial aid (Title IV funding, such as Pell Grants and federal loans) 343517. While this covers roughly 70 percent of students nationwide, the ratio varies wildly by institution; at some wealthy private colleges, fewer than half of the students receive federal aid, meaning their outcomes are excluded from the Scorecard's data 34.
Furthermore, early iterations of the earnings metric aggregated all students at an institution into a single median number, obscuring the massive variance in earnings between specific degree programs 3417. A single median salary for an entire university fails to differentiate between the earning potential of a computer science graduate and an early childhood education graduate at the exact same school. While newer federal data efforts are increasingly disaggregating outcomes by program, overall institutional medians still require careful context.
Rethinking Rankings: Social Mobility and Institutional Value
For decades, the college search has been heavily influenced by commercial ranking systems, most notably U.S. News & World Report. However, these traditional rankings have long been criticized by higher education researchers for utilizing narrow, outdated formulas. Historically, these methodologies have heavily weighted wealth metrics (endowment size, alumni giving) and exclusion metrics (low acceptance rates, high incoming standardized test scores) as primary proxies for academic quality 1819.
This methodology inherently disadvantages institutions that prioritize access and economic uplift, specifically Regional Public Universities and Historically Black Colleges and Universities (HBCUs) 1920. Regional public universities educate nearly half of all students pursuing a bachelor's degree at four-year public schools in the U.S. and serve as vital economic and employment hubs for their local communities 1921. Yet, because they admit a large percentage of applicants and serve populations with higher financial needs, they are routinely overshadowed in national prestige rankings 1921.
To find institutions that actually add measurable value to a student's life trajectory, researchers should consult alternative frameworks like the Social Mobility Index (SMI) developed by CollegeNET. The SMI explicitly measures the extent to which a university educates economically disadvantaged students (those with family incomes below the national median) at lower tuition rates and successfully graduates them into well-paying jobs 181922.
When evaluated through the lens of social mobility, the perceived hierarchy of American higher education flips entirely. HBCUs and regional public universities consistently outperform elite, highly selective Predominantly White Institutions (PWIs) on the SMI 1822. Studies comparing HBCUs to PWIs - when meticulously matched by size and geographic location - demonstrate that when controlling for pre-college characteristics like incoming SAT scores and family income, HBCUs show higher first-year retention rates and superior post-graduate financial mobility 18.
Furthermore, the academic and research footprint of HBCUs is expanding rapidly. Changes to the Carnegie Classification system criteria taking effect in 2025 have simplified the thresholds required to achieve R1 ("very high research activity") status, focusing strictly on specific spending and doctorate conferral numbers 2324. These changes have clarified the pathway for top-tier research status, with institutions like Howard University achieving R1 status, and North Carolina A&T and Morgan State University projected to reach the threshold by the end of the decade 2324. This evolving data directly challenges the outdated narrative that elite research output and strong post-graduate outcomes are confined strictly to traditional, wealth-heavy institutions.
Vetting the Culture: Student Forums and Undercover Visits
Quantitative data reveals the structural and financial reality of an institution, but it cannot capture the lived, day-to-day culture of a campus. A university may boast a flawless student-to-faculty ratio on paper, but that metric does not explain whether the campus feels isolating, hyper-competitive, or deeply supportive. To assess the actual student experience, researchers frequently turn to online forums like Reddit (specifically the r/ApplyingToCollege subreddit) and College Confidential.
While these forums provide unvarnished opinions, they are highly susceptible to intense selection bias and can easily become toxic echo chambers 444546. College Confidential is heavily populated by parents of high-achieving students and tends to lean heavily pessimistic. The site is notorious for its proprietary jargon (e.g., using "S22" for a son graduating in 2022, or "D15" for a 15-year-old daughter) and for inducing severe anxiety regarding admissions chances 454647. Users frequently over-inflate their children's accomplishments, creating a skewed perception that every applicant has a 4.0 GPA and a perfect SAT score 46. However, the veteran parent posters on the site can be incredibly useful resources for navigating complex financial aid rules, identifying realistic target schools, and finding niche merit scholarship opportunities 47.
Reddit is predominantly populated by actual high school and college students, and the tone can fluctuate wildly between extreme optimism and intense emotional venting 474849. When navigating these platforms, it is crucial to employ critical filtering to separate constructive, actionable feedback from situational anger. Vicious complaints about a specific professor being "incompetent" or angry rants about a bad grade are typically reflective of a frustrated individual venting rather than a systemic institutional failure 4950.
Conversely, researchers should look for recurring patterns of constructive feedback. Repeated, specific complaints across multiple threads about administrative bureaucracy, severe housing shortages, inaccessible mental health resources, or broken dining hall plans are highly reliable signals of structural campus issues 4950.
Finally, the most effective way to cross-reference marketing claims with campus reality is through an "undercover" campus visit. Instead of strictly following the highly curated, backward-walking admissions tour, prospective students and parents should explore the everyday, unpolished spaces of the university 5152. Analyzing campus bulletin boards in libraries, student unions, and dormitories provides immediate, unfiltered insight into the actual concerns and priorities of the student body.
A library bulletin board littered with notices regarding campus security protocols ("See Something, Say Something"), intense academic tutoring schedules, study abroad opportunities, and vibrant student club meetings offers a far more accurate and nuanced reflection of daily campus life than a glossy admissions brochure 5253.
Bottom line
Researching a college effectively requires systematically discarding subjective marketing puffery in favor of standardized, objective data. By mastering tools like the Common Data Set, families can uncover exactly what a college values in its applicants and whether it truly funds its students. While the College Scorecard and the Social Mobility Index provide crucial long-term outcomes on debt, earnings, and equity, this data must always be contextualized by the specific financial realities of the overhauled FAFSA system and validated by unvarnished cultural research on the ground.