
How Much Does GPA Matter for College Admissions
High school grade point average (GPA) remains the single most heavily weighted factor in college admissions, consistently ranking above standardized test scores, application essays, and extracurricular activities in institutional priority. However, university admissions officers rarely evaluate a GPA at face value; instead, they recalculate grades to normalize vastly different high school standards, heavily scrutinize the rigor of the courses taken, and look for specific upward performance trends over a four-year period. In today's hyper-competitive educational landscape - characterized by systemic grade inflation, the widespread reinstatement of standardized testing at elite institutions, and the legal end of race-conscious affirmative action - a near-perfect GPA is often merely the baseline requirement for entry, forcing applicants to differentiate themselves through academic trajectory and contextual demographic narratives.
The Undisputed Foundation of Holistic Admissions
The landscape of higher education admissions has experienced unprecedented volatility throughout the 2020s. A global pandemic forced a nearly universal, overnight shift to test-optional policies, which in turn triggered an 83% surge in total applications submitted via the Common App since 2020 as students felt emboldened to apply to selective schools without the anchor of a low SAT score 1. Concurrently, the 2023 Supreme Court ruling effectively banned explicit affirmative action, radically altering how universities legally build diverse incoming cohorts 233.
Amidst these turbulent administrative and legal shifts, one metric has remained the undisputed and unshakeable anchor of the application process: the high school transcript.
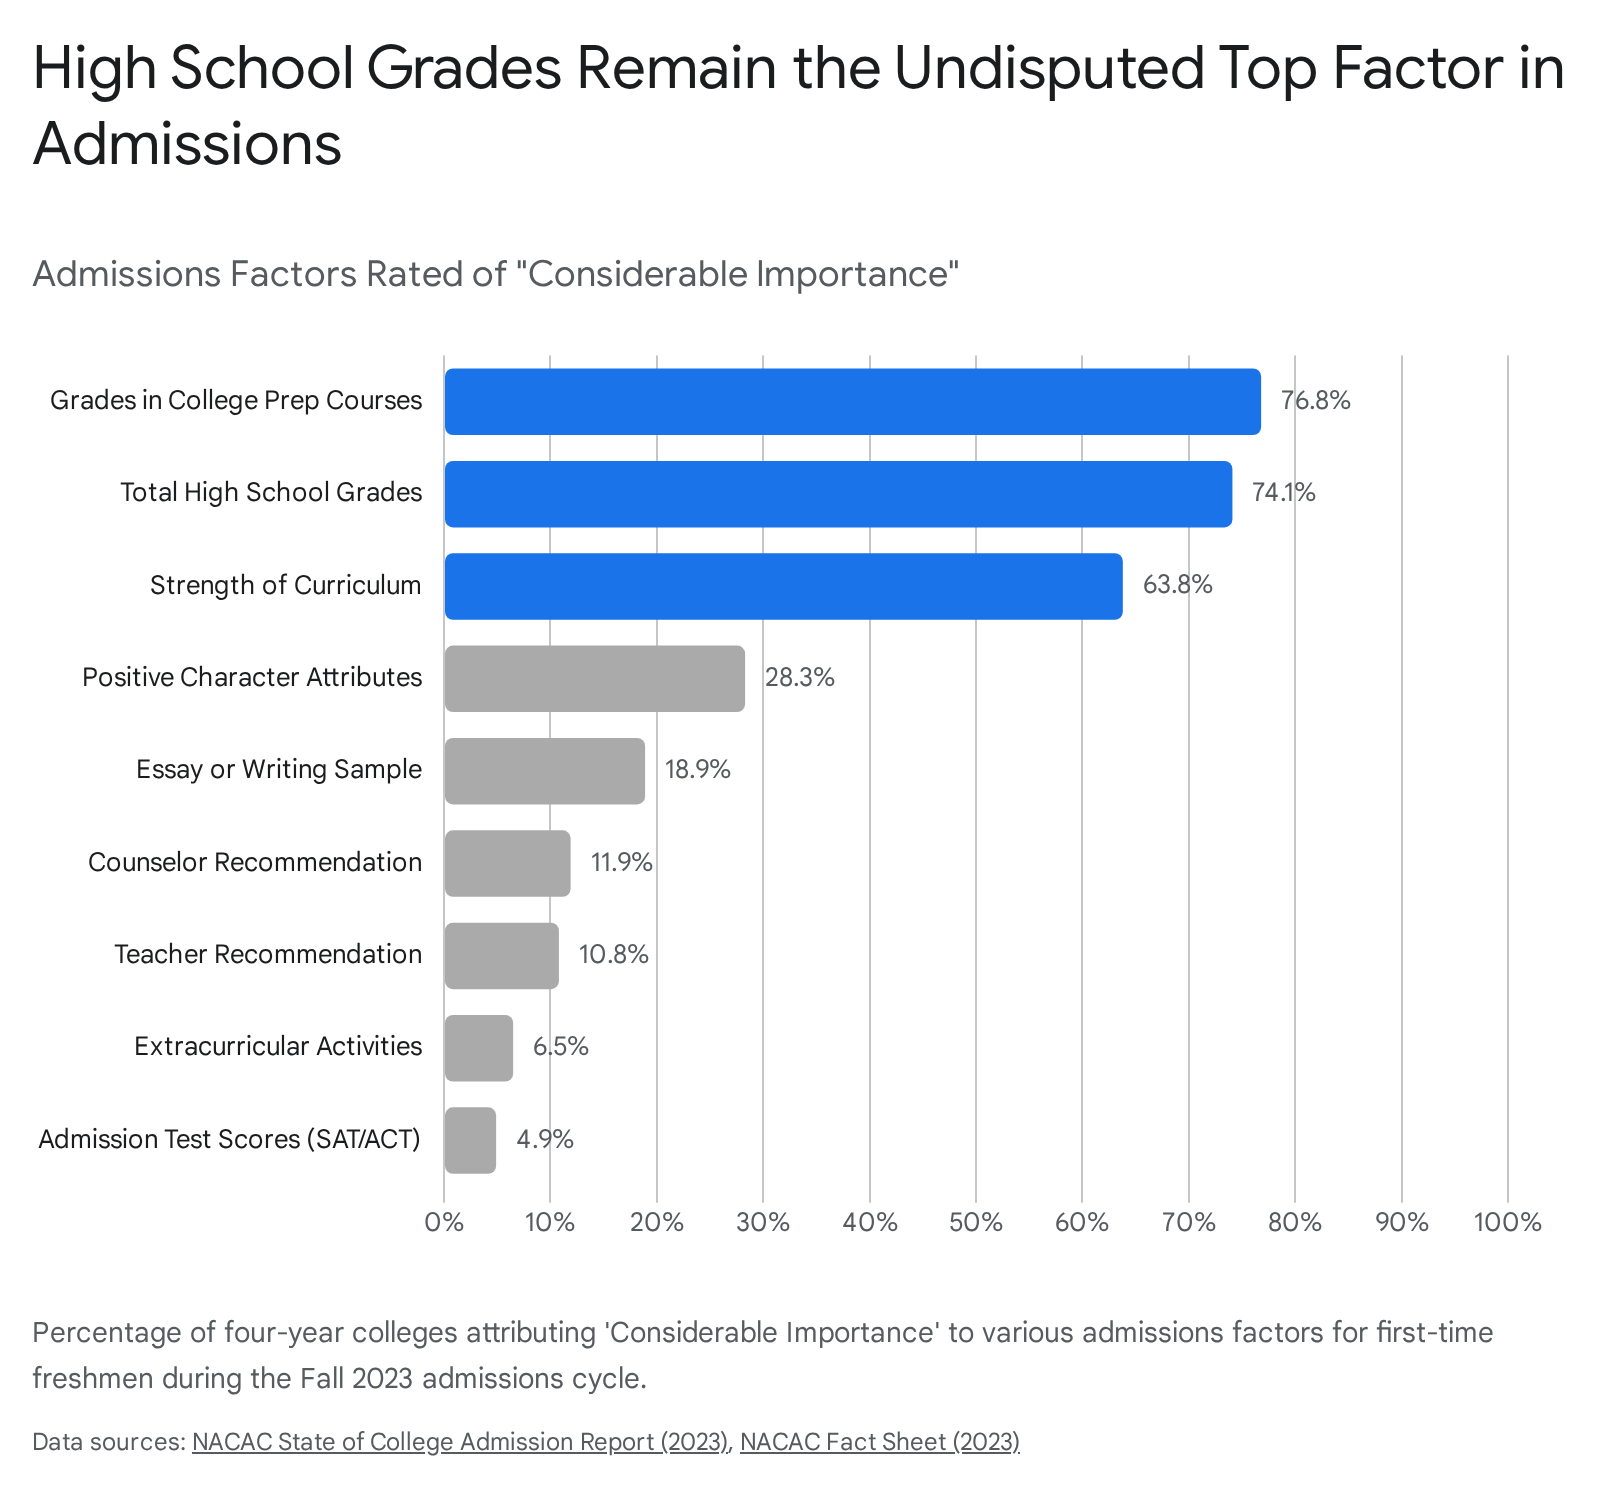
According to the National Association for College Admission Counseling (NACAC) 2023 State of College Admission report - a comprehensive survey of four-year institutions - a staggering 76.8% of colleges attribute "considerable importance" to high school grades in college preparatory courses, making it the highest-ranked factor in all admissions decisions 457. Total high school GPA across all courses closely followed, with 74.1% of institutions granting it considerable importance, and the strength of the high school curriculum ranked third at 63.8% 4.
To understand the dominance of these academic metrics, one must compare them to the secondary factors often fixated upon by applicants. In the same NACAC survey, a student's positive character attributes were deemed of considerable importance by only 28.3% of colleges 4. The application essay or writing sample stood at 18.9%, counselor recommendations at 11.9%, and extracurricular activities at a mere 6.5% 4. At the time of the survey - which captured the peak of the test-optional era - admission test scores like the SAT and ACT were given considerable importance by only 4.9% of colleges, a number that is currently shifting back as elite institutions reverse course 45.
The preeminence of the GPA is not merely a matter of traditional institutional inertia; it is rooted in proven, long-term predictive validity. The transcript provides a four-year chronological narrative of a student's intellectual capacity, executive function, work ethic, and resilience. It reveals exactly how a student responds to increasing academic difficulty, how they manage overlapping long-term responsibilities, and how they perform across a broad spectrum of disciplines. A standardized test provides a snapshot of cognitive processing on a single Saturday morning, but a GPA represents thousands of hours of sustained effort.
Public vs. Private Institutional Nuances
While GPA reigns supreme globally, the NACAC data reveals subtle philosophical differences in how public and private institutions evaluate applicants. Public universities - which frequently process tens of thousands of applications and are often bound by state legislative mandates - tend to rely more heavily on formulaic, objective measures like raw GPA thresholds and standardized graduation exams 45. Private colleges, which generally feature smaller applicant pools and possess more leeway to sculpt a highly specific campus culture, place a noticeably higher degree of importance on subjective factors such as positive character attributes, the application essay, admissions interviews, and demonstrated interest in attending the institution 45. Nonetheless, even at the most holistic private liberal arts colleges, the transcript remains the gateway that determines whether those subjective factors are ever seriously considered.
The Anatomy of a High School GPA: What Colleges Actually See
When high school students, parents, and casual observers discuss GPA, they routinely speak of a singular, defining number - a 3.8, a 4.2, or a 3.5. However, inside a university admissions office, this single aggregate figure is immediately dismantled. Admissions officers recognize that there are more than 20,000 high schools in the United States, and there are nearly as many unique grading scales and institutional weighting methodologies 8.
Taking a reported GPA at face value is statistically impossible when comparing a student from an elite private boarding school to a student from an underfunded rural public school. Therefore, universities look past the top-line number to deconstruct the components.
The Baseline: Unweighted vs. Weighted GPAs
The first and most critical distinction admissions offices make is the difference between unweighted and weighted GPAs.
An unweighted GPA is calculated on a traditional 4.0 scale, where an 'A' corresponds to a 4.0, a 'B' to a 3.0, a 'C' to a 2.0, and a 'D' to a 1.0 6789. Crucially, this calculation remains static regardless of the difficulty of the course. An 'A' in foundational Physical Education carries the exact same mathematical weight as an 'A' in Advanced Placement (AP) Quantum Physics. The unweighted GPA serves as a universal, flattened baseline, measuring raw academic execution without the confounding variables of course availability 89.
A weighted GPA, by contrast, is an institutional scale that accounts for the complexity and rigor of the curriculum. High schools add bonus points - typically an extra 0.5 to 1.0 point - for Honors, Advanced Placement (AP), International Baccalaureate (IB), or dual-enrollment college courses 68913. This system allows highly ambitious students to achieve cumulative GPAs that exceed the traditional ceiling, producing transcripts with a 4.3, 4.7, or even a 5.0.
The Recalculation Process
Because high schools weight grades so disparately, selective universities almost never use the weighted GPA exactly as it is printed on the high school transcript. A 4.3 at one high school might require a student to take five AP classes, while at another district across the state, it might require ten. Furthermore, some high schools weigh 'A+' grades differently than 'A' grades, while others do not recognize the plus/minus system at all 8.
To solve this, most selective colleges recalculate every applicant's GPA using their own proprietary, standardized formulas 889. During this recalculation, admissions officers often strip away grades from non-academic electives - such as physical education, health, or introductory art - focusing solely on core academic subjects: English, Mathematics, Science, Social Studies, and Foreign Languages 1011.
For example, the University of California (UC) system utilizes a highly specific, universally applied methodology that completely omits freshman year grades from the calculation, focuses strictly on a predetermined set of approved "A-G" core subject requirements, and caps the number of extra points a student can be awarded for honors courses 812. This ensures that an applicant from San Diego is evaluated on the exact same mathematical plane as an applicant from San Francisco.
The Critical Role of Course Rigor
Because high schools offer vastly different educational opportunities, the unweighted GPA is perpetually paired with an evaluation of course rigor. Admissions officers are universally clear on this point: they would vastly prefer to see a student earn a 3.7 unweighted GPA in a curriculum heavy with AP, IB, and honors courses than see a flawless 4.0 unweighted GPA achieved by taking the path of least resistance in standard-level classes 817.
The evaluation of rigor is highly contextual. Colleges rely on the "School Profile" - a standardized document provided by the high school counselor that details the exact curriculum offered, the grading scale, the demographic makeup of the student body, and the historical grade distribution at that specific school 18. If a student's high school offers 15 AP courses and the student only elected to take two, the admissions committee will flag that applicant as avoiding academic challenges, rendering them uncompetitive for top-tier institutions 8.
Conversely, if a rural or under-resourced high school offers zero AP courses, a student will absolutely not be penalized for lacking them on their transcript. Instead, they will be judged strictly on whether they maximized the hardest curriculum that was actually available to them in their specific environment 1920. For highly selective institutions like Columbia University or the University of Michigan, pushing to the absolute edge of a school's academic offerings is a non-negotiable expectation 192021.
Benchmarking: What Constitutes a "Good" GPA by College Tier?
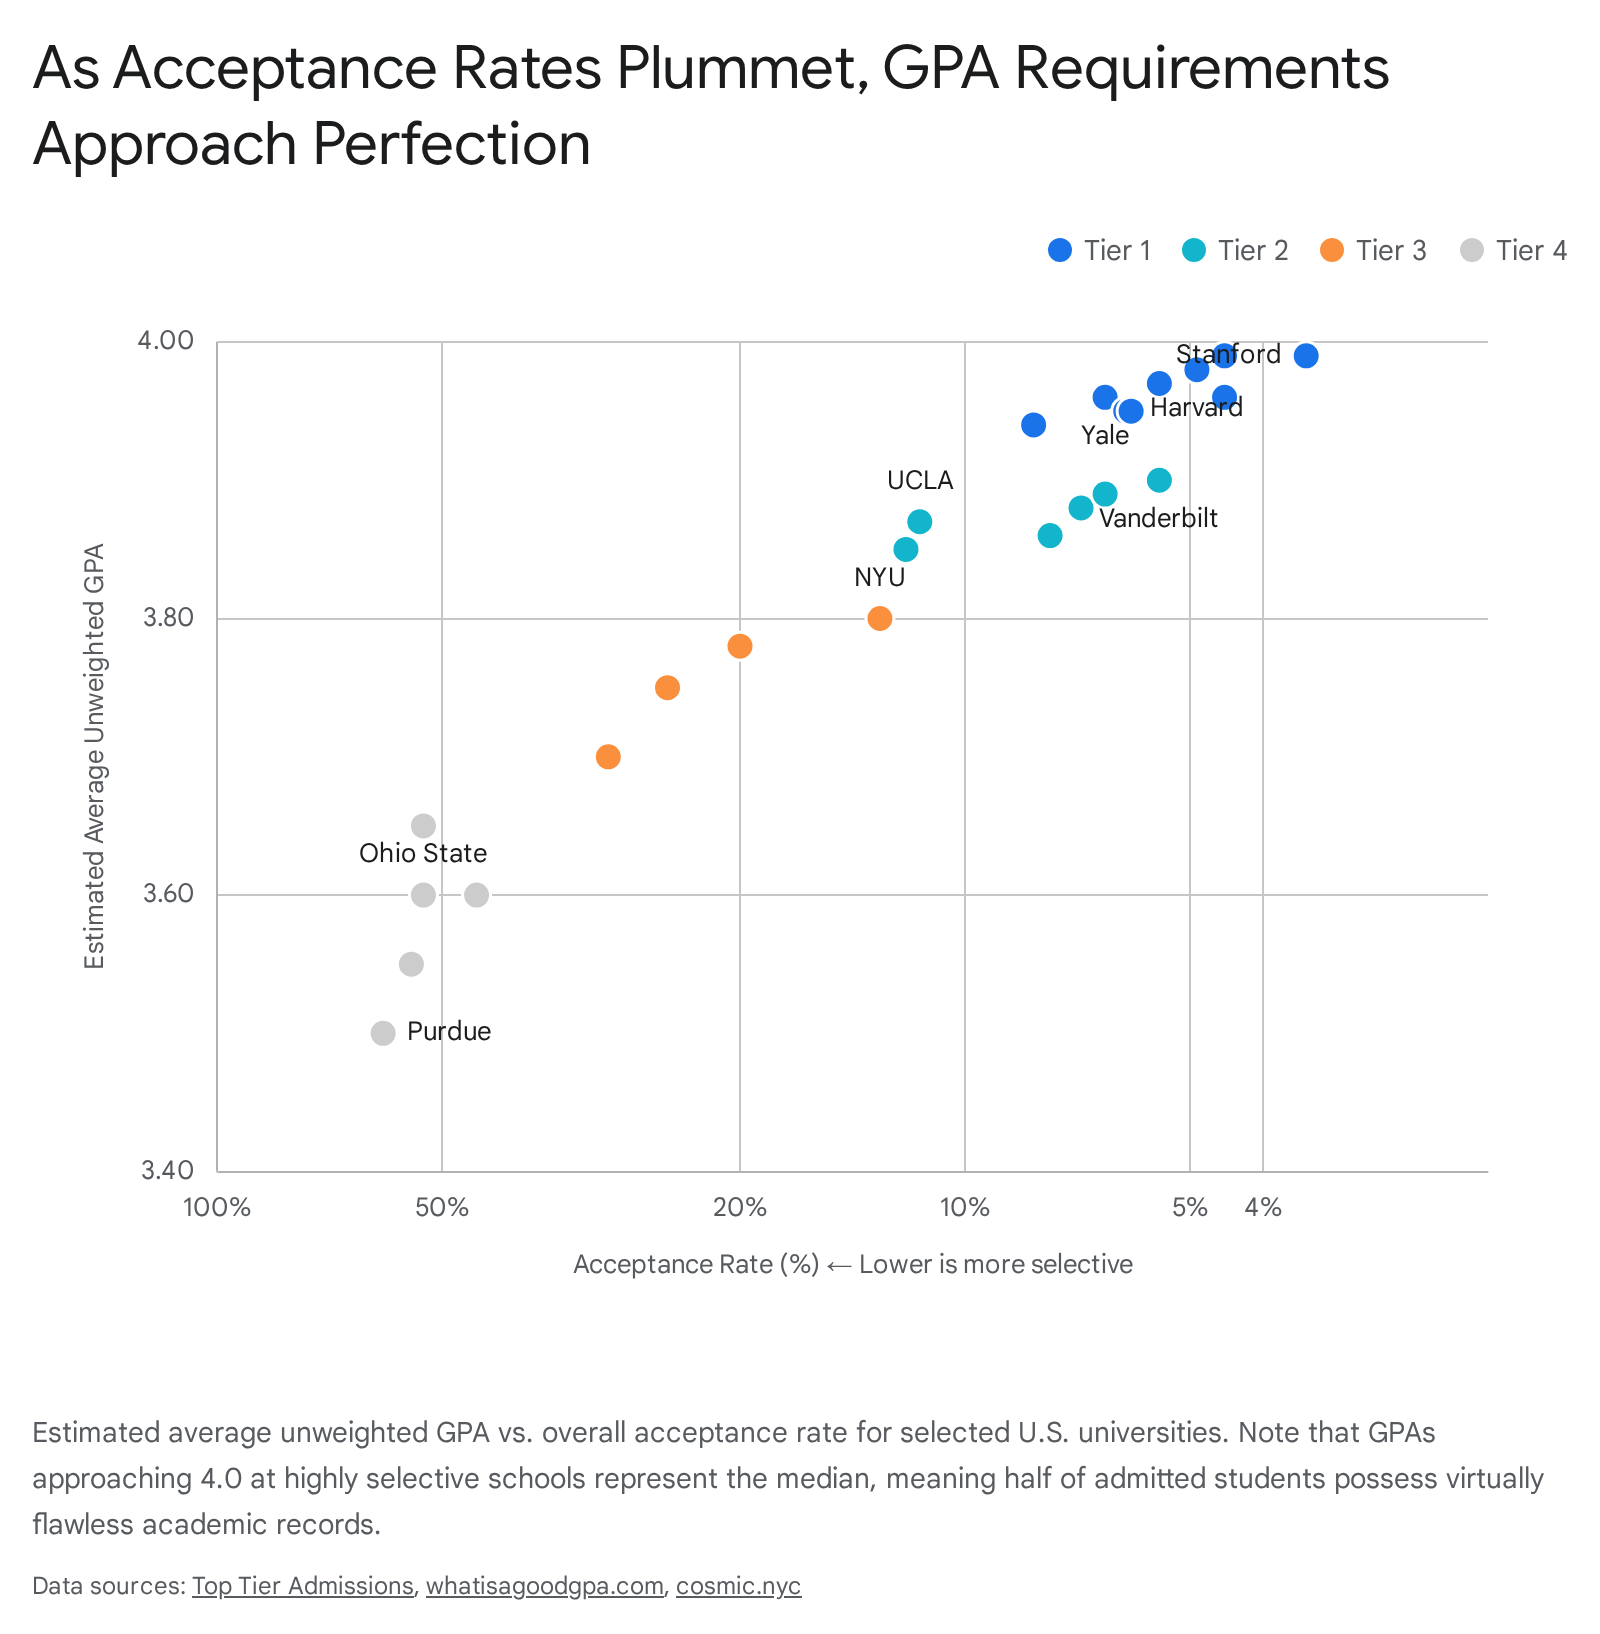
In the current admissions environment, asking "What is a good GPA?" is inherently flawed without specifying the target institution. A "good" GPA is entirely relative to the selectivity of the university. At the absolute top tier, a 4.0 unweighted GPA is no longer an exceptional achievement that guarantees admission; rather, it is considered "table stakes" - the minimum baseline requirement necessary just to have the rest of the qualitative application taken seriously 8.
To understand where a student's academic profile fits, it is helpful to segment universities into distinct tiers based on selectivity and average admitted metrics.
| Institution Tier | Acceptance Rate | Target Unweighted GPA | Target Weighted GPA | Typical Expectations for Course Rigor |
|---|---|---|---|---|
| Tier 1 (Highly Selective) Harvard, MIT, Stanford, Yale, Princeton, Caltech |
3 - 7% | 3.90 - 4.00 | 4.10+ | Maximum rigor available (e.g., 8-12+ AP/IB courses). A near-perfect transcript is expected, with virtually all 'A' grades. |
| Tier 1.25 (Elite / Near-Ivy) Columbia, UPenn, Duke, UChicago, Johns Hopkins |
4 - 8% | 3.85 - 4.00 | 4.10+ | Maximum rigor available. Minor blemishes (a single B) require heavy compensation through extracurriculars or demographic hooks. |
| Tier 2 (Selective National) Vanderbilt, Rice, Northwestern, WashU, UCLA |
8 - 15% | 3.80 - 3.95 | 4.00+ | Strong emphasis on AP/IB. Evidence of consistently challenging oneself in core academic areas. |
| Tier 3 (Competitive / Flagship) Univ. of Michigan, UNC, NYU, Boston College |
15 - 35% | 3.50 - 3.80 | 3.80+ | A mix of standard and advanced courses. Rigor is still heavily favored, but minor grade fluctuations are tolerated. |
| Tier 4 (Accessible / Regional) Penn State, Ohio State, Purdue, Rutgers |
35 - 65%+ | 3.00 - 3.50 | 3.20+ | Standard high school curriculum with demonstrated competence in core subjects. |
Data aggregated from 2024-2025 Common Data Sets and institutional reporting 682223. Note that specific high-demand programs at Tier 3 and 4 schools (e.g., Purdue Engineering, UIUC Computer Science, or NYU Stern) frequently hold admission standards closer to Tier 1 and 2.
At an institution like Princeton University, the bulk of applicants - usually around 90% - present an unweighted GPA of at least a 3.75, and the average admitted student holds a 3.95 or higher 624. For the class of 2024, Washington University in St. Louis (WashU) reported an acceptance rate of roughly 12%, noting that the rigor of the secondary school record and academic GPA were the most critical factors in their holistic review 25. Similarly, at the University of Notre Dame, a vast majority of enrolled students originate from the top 10% of their high school graduating class, with course rigor carrying immense weight 2126.
Even at massive public flagship universities, the academic bar remains exceptionally high. At the University of Minnesota Twin Cities, the middle 50% of the freshman class admitted for Fall 2025 possessed an unweighted core GPA between 3.50 and 3.95, and a high school rank percentile between 74 and 95 11. At the University of Michigan, the overall acceptance rate falls in the high teens (~18 - 20%), but for out-of-state applicants targeting the College of Literature, Science, and the Arts, the middle 50% typically possess an unweighted GPA pushing 3.9 20. For a student with a 3.6 GPA, Tier 1 and Tier 2 institutions are effectively out of reach without a massive institutional hook, whereas that same 3.6 remains highly competitive for Tier 3 and 4 institutions, provided the student has a strong narrative and extracurricular profile 68.
The Timeline of Grades: Do Freshman and Sophomore Years Matter?
A GPA is not just a static number; it is a chronological vector that demonstrates academic momentum. Admissions officers look closely at the trajectory of a student's grades over their four years of high school to gauge maturity, resilience, and their absolute readiness for the independence of college 102728.
The Freshman Year Forgiveness Policy
For many adolescents, the transition from middle school to high school is jarring. The sudden increase in workloads, shifts in social dynamics, and the introduction of more rigorous grading standards can frequently lead to a dip in performance during the 9th grade. Admissions officers are acutely aware of this developmental phase and the challenges it brings 1029. Consequently, freshman year grades generally carry the least weight in the holistic admissions process 29.
Several highly selective institutions institutionalize this forgiveness by mathematically removing it from consideration. The University of California system (including highly sought-after campuses like UC Berkeley and UCLA), Stanford University, and traditionally Princeton University either completely strip 9th-grade grades from their internal GPA recalculations or heavily discount them, focusing their academic review on the 10th and 11th grades 81229. However, this is not a universal rule. At institutions like Yale or Harvard, class rank begins accumulating on the first day of 9th grade, meaning early poor performance can mathematically disadvantage a student trying to break into the top 5% of their graduating class, even if the admissions officers view the early grades with sympathetic context 29.
The Supremacy of Junior Year
If 9th grade is the most forgiven, 11th grade (junior year) is definitively the most critical. By junior year, students are expected to be fully acclimatized to the high school ecosystem and are usually enrolled in their most difficult AP, IB, or dual-enrollment courses 102729.
Because college applications are typically submitted in the fall or early winter of a student's senior year, junior year represents the most recent full, finalized academic year on the transcript 2729. A strong performance in junior year - particularly in advanced coursework - validates a student's immediate readiness for the rigors of a university curriculum. Senior year grades also matter deeply, as colleges will review mid-year reports to ensure a student hasn't succumbed to "senioritis," but the junior year is the anchor of the initial evaluation.
Decoding the "B in Sophomore Year" Anxiety
A common source of intense anxiety among high-achieving applicants is whether a single "B" grade - often occurring in 10th grade - will permanently doom their chances at an elite university. The reality requires calibrated nuance. One "B" in an ocean of 'A' grades within a highly rigorous curriculum is almost never the sole reason a student is rejected from a school like Harvard, Yale, or MIT 1230. The baseline statistical chance of admission for any typical applicant to these schools is hovering around 4-5%; students with perfect 4.0 GPAs and flawless SAT scores are routinely rejected simply due to a lack of physical seats 3113.
However, the context of that lower grade is vital. An upward grade trend - for example, earning a B in 10th-grade Algebra II, followed by an A- in 11th-grade Pre-Calculus, and an A in 12th-grade AP Calculus - demonstrates intellectual growth, tenacity, and the ability to course-correct, all of which admissions officers highly respect 273033. This narrative of improvement is considered one of the strongest positive signals a transcript can offer 27.
Conversely, a downward trend - where a student earns As as a freshman and sophomore, but drops to Bs and Cs as a junior - is a massive red flag 27. This trajectory suggests the student has hit their academic ceiling, failed to adapt to harder material, or lost motivation just as the coursework began to mirror college-level difficulty 27.
If a student receives multiple Bs and Cs in core subjects, the statistical reality for Tier 1 admissions is exceedingly bleak. Admissions officers note that while extenuating circumstances - such as a severe illness, a family tragedy, or housing instability - can and should be explained in the "Additional Information" section of the Common Application, a transcript laden with lower grades ultimately fails to demonstrate the baseline academic mastery required to survive the intellectual pressure cooker of a top-tier university 31133334.
The Grade Inflation Crisis vs. Predictive Power
To fully grasp the current weight of the GPA, it is essential to examine its historically volatile relationship with standardized testing (the SAT and ACT) and the systemic issue of grade inflation.
Over the past decade, high school GPAs have steadily risen nationwide, untethered from corresponding increases in actual student mastery or standardized test performance 353637. At some elite colleges and many affluent, well-resourced high schools, the "A" has become the most commonly awarded grade 36. This phenomenon has degraded the differentiating power of the unweighted GPA. A 4.0 GPA is increasingly viewed less as a marker of exceptional brilliance and more as a basic participation metric among high-achievers 36.
Despite this inflation, robust, large-scale academic research consistently supports the supremacy of the GPA over standardized tests. A comprehensive 2026 working paper from the National Bureau of Economic Research (NBER), led by researchers at the CUNY Graduate Center, analyzed over 225,000 students across pre- and post-COVID cohorts at a large public university system 1439.
The researchers concluded that high school GPA is a vastly superior predictor of college student success compared to standardized test scores 1439. Specifically, the NBER study found that a one-standard-deviation increase in high school GPA raised a student's first-year college GPA by 0.36 to 0.41 points, and it increased their probability of graduating in four years by 12 to 14 percentage points 1439. At the most selective universities, high school GPA was found to be 2.5 times more predictive of college success than SAT scores, and up to 10 times more predictive at less selective institutions 39. This is largely because a GPA measures the exact skills required for college: sustained effort, time management, the ability to navigate different teaching styles, and long-term memory retention.
The Test-Optional Rollercoaster and the Return of the SAT
In the spring of 2020, the COVID-19 pandemic shuttered testing centers worldwide, forcing thousands of colleges to adopt test-optional policies overnight 3640. Without standardized test scores to act as a universal benchmark, admissions officers were forced to place unprecedented, outsized weight on high school GPA, curriculum rigor, and demographic context 15.
This shift led to a massive application surge, as students who previously would have self-selected out of elite admissions due to sub-1400 SAT scores felt emboldened by their high GPAs 11542. The result was plunging acceptance rates and an admissions landscape where GPA was essentially the sole academic gatekeeper.
However, recognizing the challenges of evaluating heavily inflated GPAs without a standardizing metric, the elite strata of higher education has recently reversed course. Beginning in 2022 with the Massachusetts Institute of Technology (MIT), and accelerating rapidly through 2024, 2025, and 2026, a wave of highly selective institutions reinstated mandatory SAT/ACT requirements. This elite list now includes Dartmouth, Yale, Brown, Harvard, Cornell, the University of Pennsylvania, Caltech, Stanford, Johns Hopkins, and Georgetown, alongside massive public systems in Florida and Georgia 404344454647.
The rationale for this reversal was multifaceted. Internal data from institutions like Dartmouth and MIT revealed that in a hyper-inflated grading environment, the SAT provides a necessary cross-validation tool to ensure a student's 'A' grades represent genuine mastery 364047. More surprisingly, admissions deans argued that reinstating tests actually promoted equity. In a purely test-optional world, a 4.0 GPA from an under-resourced, rural public high school is exceedingly difficult to compare to a 4.0 from an elite private prep school 4346. A strong SAT score from the rural student serves as an undeniable, objective beacon of talent that might otherwise be missed or doubted by an admissions committee operating with limited context 4347.
For the modern applicant aiming for Tier 1 and Tier 2 institutions, this means the GPA is no longer acting alone. A 4.0 GPA must increasingly be defended by a commensurate test score (e.g., a 1500+ SAT) to prove that the grades are a reflection of true capability, not just institutional inflation 3648. For the vast majority of four-year institutions that remain test-optional, submitting a strong test score remains a highly effective way to validate a high GPA and separate an application from the pack.
The Post-Affirmative Action Era: GPA in a Race-Neutral Landscape
The role of the GPA has been further complicated by the legal reshaping of college admissions. On June 29, 2023, the U.S. Supreme Court delivered a landmark 6-3 decision in Students for Fair Admissions (SFFA) v. Harvard and SFFA v. UNC, striking down the decades-old precedent of race-conscious affirmative action 2334950.
Chief Justice John Roberts wrote that universities had wrongly concluded that "the touchstone of an individual's identity is not challenges bested, skills built, or lessons learned but the color of their skin," ruling that admissions must evaluate applicants strictly as individuals, without utilizing race as a direct positive factor 3316.
The Shift to "Proxies" and Deep Socioeconomic Context
The legal prohibition of race-conscious admissions has forced universities to redesign their holistic review processes. Because admissions officers can no longer balance cohorts using racial checkboxes, they are placing even greater scrutiny on the intersection of a student's GPA, their high school's socioeconomic profile, and individual adversity 215.
The Department of Justice and the Department of Education have issued strict guidance - including memos from Attorney General Pam Bondi in 2025 - warning institutions against using "proxies" designed specifically to achieve racial quotas (e.g., illegally manipulating zip code or financial data to artificially mimic racial demographics) 49. However, universities are legally permitted, and encouraged, to consider an applicant's discussion of how their background, including hardships tied to their identity, affected their life and character 2350.
Consequently, a GPA is now read with microscopic attention to its socioeconomic environment. An unweighted 3.8 GPA achieved by a first-generation student working 20 hours a week in a high school with high poverty rates may be weighted far more heavily in the holistic review process than a 4.0 achieved by a legacy student who had access to private tutoring and elite resources 22715.
The Demographic Fallout: Analyzing the Class of 2028
The class entering in the fall of 2024 (the Class of 2028) was the first cohort admitted under the Supreme Court's new constraints, providing real-time data on how the loss of explicit affirmative action impacts incoming classes.
The results show distinct demographic shifts, though they are not entirely uniform across the sector. Harvard College reported a notable four-percentage-point drop in Black student enrollment (falling from 18% in the previous class to 14%), while Hispanic representation increased, and Asian American representation remained relatively flat at 37% 1617. MIT reported a steeper decline, with the percentage of Black, Hispanic, Native American, and Pacific Islander students dropping from 25% in recent years to 16% 16. Stanford University also saw Black student admissions fall from 9% to 5%, and Hispanic enrollment drop by 12% compared to the prior year 16. The University of North Carolina at Chapel Hill similarly reported drops in enrollment among Black, Hispanic, and Native American students 18.
Interestingly, a notable byproduct of the ruling is a sharp increase in the number of students refusing to disclose their race on applications - doubling from 4% to 8% at Harvard - making the exact demographic picture murkier for analysts 317. Meanwhile, institutions with strong regional pipelines, such as Duke University and the University of Virginia, actually reported increases in the share of Black and Hispanic students. This was largely attributed to aggressive new recruitment and financial aid initiatives specifically targeting lower-income high schools in their immediate geographic areas, attempting to legally capture diversity through socioeconomic targeting 19.
These outcomes underscore a vital third-order insight: in a race-neutral admissions regime, universities lean immensely on raw academic data (GPA and rigor) combined with socioeconomic indicators to identify merit. Students from historically underrepresented backgrounds must increasingly rely on their transcripts, coupled with compelling personal essays detailing their lived experiences, to secure positions at highly selective universities without the explicit boost of affirmative action 2316.
The Global Applicant: Converting International Grades to the U.S. GPA Scale
For international students aiming for U.S. universities, the concept of a 4.0 GPA is often foreign, resulting in massive anxiety over how their domestic grades will be perceived by American admissions officers. A major point of confusion is the desperate search for a universal conversion chart. The reality is that selective U.S. universities operate on a strict principle of "non-conversion" for undergraduate admissions 1820.
Admissions officers at top universities are specialists in global educational (GEO) systems. They do not feed an international student's marks into a simple mathematical formula to spit out a 4.0-scale equivalent, because doing so strips away vital context regarding a country's unique grading culture 1835. Instead, they evaluate the original transcript against the known rigor of that specific national curriculum 1820.
For general planning and benchmarking, however, industry standards (often mapped by credential evaluators like WES or ECE for graduate admissions) provide a rough equivalency matrix that helps international students understand their competitiveness.
Translating the UK and IB Systems
In the United Kingdom, grading is notoriously harsh compared to the American system. Achieving a 70% or higher on university-level work or A-Levels is classified as a "First Class" mark. While earning a 70% in a U.S. high school would be a dismal 'C-', in the UK system, it is considered excellent and effectively maps to an 'A' or a 4.0 GPA 3556.
Similarly, the International Baccalaureate (IB) Diploma Programme is recognized globally for its immense rigor. IB courses are graded on a scale of 1 to 7. An IB score of 7 (the highest possible mark) typically translates to a 4.0 unweighted GPA 57. Due to the difficulty of the curriculum, many U.S. universities will even credit a 6 as a 4.0 or a 3.7 57. For the total IB diploma (out of a maximum 45 points), achieving a score of 42 - 45 generally corresponds to a flawless 4.0 GPA 57.
Evaluating Chinese and French Grading Cultures
Different nations harbor vastly different pedagogical philosophies on awarding top marks, and applying basic math to these grades creates fatal inaccuracies.
- China (100-Point Scale): Chinese high schools and universities grade on a percentage scale, but they are incredibly conservative with high marks 5859. A score of 90% or above (优秀 / Excellent) is exceptional, often reserved for only the top 5 - 10% of a class, and equates to a 4.0 GPA in the U.S. system 5960. An 85% is considered a very strong grade (equivalent to roughly a 3.7 GPA), whereas applying a direct U.S. mathematical percentage conversion would wrongly classify it as a mediocre 'B' 596021.
- France (20-Point Scale): The French Baccalaureate system evaluates students out of 20 points, but perfection is essentially a myth within their educational culture. A grade of 16 - 20 (Mention très bien) is the highest distinction, is exceedingly rare, and translates to a 4.0 U.S. GPA 2263. A grade of 14 - 15.9 (Mention bien) is highly competitive and translates to roughly a 3.7 GPA 2263. An average of 12 or 13 in the grueling French preparatory tracks can be considered outstanding by U.S. admissions officers who understand the context 22.
| Country / Curriculum | Top Grade Bracket | U.S. GPA Equivalent | Contextual Note for U.S. Admissions |
|---|---|---|---|
| United States | 93 - 100% (A) | 4.0 | Prone to severe grade inflation. High grades are common; course rigor separates top applicants. |
| United Kingdom (A-Levels) | 70%+ (A / A*) | 4.0 | Stricter grading culture. 70% signifies high mastery, not mediocrity 3556. |
| International Baccalaureate (IB) | 7 (Subject) / 42-45 (Total) | 4.0 | Globally standardized. High rigor is assumed. A score of 6 often equates to a 3.7 or 4.0 57. |
| China | 90 - 100% (优秀) | 4.0 | Highly conservative grading. An 85% represents a very strong applicant (3.7 GPA equivalent) 5921. |
| France (Baccalaureate) | 16 - 20 / 20 | 4.0 | Perfection is culturally discouraged. 16+ is rare and exceptional 2263. |
Note: Elite undergraduate programs review transcripts in their native format using country-specific expertise rather than forcing them through a rigid mathematical converter 1820. Official evaluation services like WES are generally used for graduate admissions or transfer credits, rather than freshman undergraduate admissions 182324.
Managing Expectations and Maximizing Academic Profiles
Understanding the mechanics, history, and exact weight of the GPA allows families and students to build rational, strategic college lists.
The proliferation of applications - with 40% of applicants now applying to 10 or more colleges - has depressed acceptance rates and created massive yield unpredictability for universities 142. To manage this uncertainty, institutions increasingly lean on Early Decision (ED) and Early Action (EA) rounds, which now fill 40% to 60% of incoming seats at some top schools 1. Students with a slightly borderline GPA (e.g., a 3.7 applying to a Tier 2 school where the average is 3.85) have a significantly higher statistical chance of admission in an early binding round than in Regular Decision, provided their family does not require the ability to compare financial aid offers 142.
When constructing a college list, the GPA serves as the primary compass, dictating the categories of "Reach," "Match/Target," and "Safety/Sure" schools: * Reach: The student's GPA sits below the 25th percentile of admitted students. Admission is statistically unlikely and relies heavily on an exceptional "hook" (e.g., being a recruited athlete, writing a phenomenal essay, or possessing a demographic priority) 28. * Match (or Target): The student's GPA and course rigor fall squarely within the middle 50% range of accepted students (e.g., a 3.8 applying to a school where the middle 50% is 3.7 - 3.9). These schools offer the best balance of opportunity and probability 28. * Safety (or Sure): The student's GPA is well above the 75th percentile of admitted students, and the institution has an overall admission rate above 50%, making admission highly probable 28.
Ultimately, students and parents must realize that while the GPA is the most critical factor to get an application read and taken seriously, it is rarely the factor that gets an application accepted at the highest echelons. Once the baseline of academic competence is established via the transcript, the admissions committee pivots entirely to the qualitative: essays that reveal character and vulnerability, sustained depth and leadership in a few extracurricular activities, and teacher recommendations that speak to a student's intellectual curiosity 1920252825.
Bottom line
High school GPA, when paired with rigorous course selection, remains the undisputed heavyweight of college admissions, acting as the primary, most reliable gauge of a student's readiness for higher education. However, its value is deeply contextual; admissions officers dissect the chronological timeline of the grades, recalculate them against specific high school profiles, and increasingly use reinstated standardized tests to verify academic mastery in an era of rampant grade inflation. While a flawless 4.0 GPA is an essential prerequisite for consideration at the nation's most elite universities, it guarantees nothing on its own - students must still rely on a compelling personal narrative, upward academic momentum, and distinct character attributes to separate themselves from a sea of academically perfect peers.