How Colleges Manage Enrollment by the Numbers
At its core, the relationship between yield, melt, and the waitlist is an intricate, high-stakes balancing act of supply, demand, and risk management. Yield measures the percentage of admitted students who actually enroll, waitlists act as an insurance policy against unpredictable shortfalls, and summer melt accounts for the inevitable attrition of students who commit but fail to arrive on campus in the fall. Together, these three metrics dictate the financial and operational survival of modern colleges, forcing institutions to play a statistical guessing game to perfectly fill their incoming classes.
The Statistical Risk-Management Game
For prospective applicants and their families, the college admissions process is an intensely emotional journey, often viewed as a pure judgment of a student's academic merit, extracurricular dedication, and moral character. An acceptance letter feels like a validation of inherent worth; a rejection or waitlist offer feels like a personal failure. However, behind the ivy-covered brick walls and the glossy admissions brochures lies a fundamentally different reality. College admissions is, to a massive extent, a cold, calculated enterprise of statistical risk management 121.
Enrollment managers are essentially the actuaries of higher education. Their primary mandate is not simply to reward the most meritorious students, but to construct a class that perfectly meets the university's institutional priorities, demographic targets, and, crucially, financial requirements. If an enrollment manager underestimates how many admitted students will actually enroll, the university faces empty dorm beds, undersubscribed classes, and a devastating shortfall in tuition revenue 11. If they overestimate, the university faces a logistical nightmare: over-enrolled classes, housing shortages that force students into off-campus hotels or converted study lounges, and severely strained campus resources 123.
To navigate this peril, colleges rely on complex predictive models to manage their numbers 114. They must mathematically account for the whims of seventeen-year-olds holding multiple offers, the macroeconomic climate, and the fierce competition from peer institutions. To protect themselves from this immense uncertainty, institutions utilize three interconnected levers: yield prediction, summer melt calculation, and the strategic deployment of the waitlist 175.
The Airline Overbooking Analogy
To truly understand how college admissions works, one must look not to the classroom, but to the commercial airline industry. The way colleges manage enrollment is structurally identical to how commercial airlines overbook flights, utilizing a system known as perishable asset revenue management 29106.
In the late 1960s, an economist named Julian Simon, then a professor at the University of Illinois, observed a critical inefficiency in the aviation sector 2. Airlines were struggling with "no-shows" - passengers who booked a seat but failed to board due to traffic, misconnections, or changed plans 23. Because an airline seat is a "perishable resource," once a flight takes off with an empty seat, the revenue potential for that specific asset is lost forever 310127. Simon proposed that airlines deliberately sell more tickets than they have seats, using statistical probability distributions - specifically binomial distributions - to predict the exact number of passengers who would actually show up 22. If everyone happened to arrive, the airline would offer incentives (such as flight vouchers or hotel stays) for volunteers to take a later flight, turning a logistical disaster into a manageable, profitable mathematical equation 278.
Higher education operates on the exact same principles of yield management 10129. A bed in a freshman dormitory or a seat in a lecture hall is a highly perishable resource 1012. If a college has 1,000 open spots in its freshman class, it knows with absolute certainty that it cannot simply admit 1,000 students. Some will choose rival institutions, some will stay closer to home, and some will simply change their minds 1212. Therefore, the college must "overbook" its freshman class by admitting far more students than it can physically house 12.
However, the consequences of miscalculating are vastly different. An airline can easily bump a passenger to a flight three hours later for an $800 voucher 268. A college cannot easily bump a freshman to the spring semester or pay them to attend a rival school if too many students show up in August. The "denied boarding cost" for a university is catastrophic, involving immense public relations damage and student dissatisfaction 79. Because the cost of over-enrolling is so logistically painful, universities tend to be slightly conservative in their initial admissions offers 11017. Instead of risking a massive over-enrollment, they admit a carefully calculated baseline number of students and place thousands of other highly qualified applicants in a holding pattern: the waitlist 117. In this analogy, the waitlist acts as the standby queue at the boarding gate, allowing the institution to perfectly top off the plane at the very last minute without risking an overflow 11718.
What Exactly is Yield, and Why Does it Matter So Much?
In the lexicon of enrollment management, "yield" is the most critical metric of desirability and institutional health. Yield is simply the percentage of admitted students who choose to enroll at a particular institution 19. If a university admits 1,000 students and 300 decide to attend, the yield rate is 30% 191121.
Across the landscape of American four-year, not-for-profit colleges, the average yield rate hovered around 30% in recent cycles, with private institutions averaging 33% and public universities at 25% 1122. However, yield rates are incredibly stratified based on prestige. Yield is viewed as the ultimate indicator of a brand's power because it reveals how students "vote with their feet" when they hold multiple acceptances 19.
At the absolute pinnacle of higher education, yield rates are astronomical. Harvard University boasts a yield rate of roughly 82%, meaning that out of every 100 students lucky enough to be admitted, 82 choose to attend 119. Stanford closely follows at approximately 80%, and the Massachusetts Institute of Technology (MIT) sits near 78% 119. For these apex institutions, yield prediction is relatively straightforward; they win almost every head-to-head matchup against other schools, allowing them to precisely manage their incoming class sizes without relying on extensive waitlist gymnastics 19.
For the vast majority of institutions, however, yield is a constant source of institutional anxiety. Yield rates have been steadily declining on a national level since the early 2000s 1922. This decline is driven by structural changes in how students apply to college. The widespread adoption of the Common Application has made it frictionlessly easy for a student to apply to 10, 15, or even 20 schools simultaneously 119. Consequently, applicant pools have surged - applications rose 211% between 2001 and 2023, while total enrollment increased only 43% 22. Because a student can only attend one college, every additional acceptance they receive inherently drives down the yield rate for the schools they ultimately decline 122.
A high yield rate holds immense value for a university. Historically, major publications like The Wall Street Journal and U.S. News & World Report utilized yield as a direct factor in their prestige rankings 1923. While the metric was officially removed from the core U.S. News methodology in 2003 to discourage colleges from overtly gaming the system, yield remains vitally important behind the scenes 1923. High yield rates impress Wall Street credit rating agencies, favorably influencing institutional bond ratings and lowering borrowing costs for campus construction projects 24. Furthermore, a predictable, high yield rate allows a college to lower its overall acceptance rate, feeding into the perception of exclusivity and driving future application volume in a self-perpetuating cycle of prestige 121.
Yield Protection: You Weren't Rejected, You Were Managed
The obsession with protecting and inflating yield has birthed one of the most misunderstood phenomena in modern college admissions: yield protection 1922.
A common misconception among high-achieving high school seniors is that if they are waitlisted at a "safety" or "target" school, it means their application had a fatal flaw or they barely missed the academic cut 72225. In reality, they may have been statistically too qualified. When an admissions office reviews an application from a student with test scores and a grade point average (GPA) that sit far above the institution's median, predictive algorithms and historical data often flag that student as highly unlikely to enroll if admitted 101225. The college logically assumes the student is using them as a backup and will ultimately attend an Ivy League or equivalent elite institution 19.
If the college admits this "overqualified" applicant and the applicant declines, the college's overall yield rate takes a mathematical hit, and its acceptance rate inches higher - both of which damage its statistical prestige and predictability models 11923. To avoid this, schools with moderate yield rates (typically hovering between 20% and 40%) will often place these stellar applicants on the waitlist instead of rejecting or accepting them outright 19. This functions as a strategic test of interest: if the student genuinely wants to attend, they will accept their spot on the waitlist and write a pleading letter of continued interest to the admissions office 725. If they do not respond, the college has successfully protected its yield without wasting an admissions offer on a student who was never going to attend 1925.
How Do Colleges Predict Who Will Actually Enroll?
Because yield is so vital to institutional survival, colleges have developed highly sophisticated methods to predict the behavior of prospective students. They do not rely on guesswork; they rely on data tracking, financial incentives, and binding contracts.
Demonstrated Interest software Tracking
For schools outside the top 20 most selective universities, tracking "Demonstrated Interest" (DI) is a vital tool for predicting yield 192224. Modern enrollment management software platforms meticulously track a prospective student's digital footprint 2627. When an admissions office sends a marketing email, the software logs whether the student opened it, which specific links they clicked, and how long they spent on the corresponding webpage 26. Admissions officers track whether the student attended a virtual webinar, completed an official campus tour, or engaged with the school's social media accounts 2428.
By cross-referencing this behavioral data against historical enrollment patterns, predictive algorithms assign each applicant a probability score of enrolling 1026. Students with high DI scores are considered "safe bets" to protect the yield rate and are therefore significantly more likely to receive an outright offer of admission 192425. Conversely, "stealth applicants" who apply having never previously interacted with the university represent a high yield risk and are prime candidates for yield protection waitlisting 25.
The Early Decision Advantage
The most powerful tool a university possesses to guarantee its yield is Early Decision (ED) 1922. Unlike Early Action (which is non-binding), Early Decision requires a student to sign a contract stating that if they are admitted, they will immediately withdraw all other applications and enroll at that specific institution 1922.
Because ED admits enroll at an effective 100% yield rate, colleges rely on it heavily to establish a secure foundation for their incoming class 119. It is not uncommon for highly sought-after but lower-yield universities - such as Tulane University, Washington University in St. Louis (WashU), or Boston College - to fill 50% to 60% of their entire freshman class through Early Decision rounds 19. At Tulane, which has an overall yield rate of roughly 32%, the institution simply cannot afford the risk of relying predominantly on Regular Decision admits, who frequently defect to peer institutions when comparing financial aid packages in the spring 19.
By locking in half the class in December via ED, the admissions office drastically reduces its operational risk for the spring 119. This dynamic completely explains why the acceptance rates for Early Decision applicants are statistically vastly higher than for Regular Decision applicants; the college is willingly trading an admissions spot for a guaranteed unit of yield 1922. As application volumes have surged globally, the reliance on ED has only deepened, with universities using it to insulate themselves from the volatility of the Regular Decision market 118.
Why Are College Waitlists Getting So Long?
If a student opens their portal in late March and receives a waitlist offer, they are joining an increasingly crowded, anxiety-inducing waiting room. Over the past decade, and particularly accelerating since 2018, the size of college waitlists has ballooned dramatically 129. At many competitive institutions, the number of applicants placed on the waitlist routinely exceeds the size of the entire incoming freshman class 2912.
The statistics are staggering. The University of Michigan has been known to place over 15,000 students on its waitlist in a single cycle 117. In a recent cycle, Brown University expected an incoming class of just over 1,700 students, yet it offered waitlist spots to over 2,700 applicants 29. The University of Pennsylvania admitted 3,731 applicants for an anticipated class of roughly 2,400, while simultaneously offering waitlist spots to approximately 3,500 students 29. Nationwide, waitlist sizes have ballooned 25% since 2018, with selective colleges routinely placing 10% to 15% of their entire applicant pool in limbo 1.
This massive waitlist bloat is a direct reaction to application inflation 131. With students applying to more schools than ever, predictive yield models have become incredibly fragile 122. Admissions offices know that minor fluctuations in the national economy, shifts in institutional reputation, or aggressive financial aid packaging from rival schools can suddenly tank their expected yield 132.
To counter this fragility, the waitlist has transformed from a polite courtesy for near-miss applicants into an essential, strategic reservoir 11833. Enrollment managers view the waitlist as a meticulously organized parts bin 25. When the May 1st National Decision Day deadline passes, colleges analyze their deposits to see exactly where their predictive models fell short 1825.
Did the university miss its target for full-pay out-of-state students, resulting in a sudden tuition revenue gap? The admissions office will turn to the waitlist and extract wealthy out-of-state applicants 734. Is the classics or physics department dangerously under-enrolled? They will pull prospective classics or physics majors from the waitlist 25. Do they need to balance geographic diversity because fewer students from the Pacific Northwest deposited than expected? They will filter the waitlist by zip code 25.
The waitlist is almost never a ranked ladder where the objectively "next best" student gets the call 25. It is an unranked pool of fully qualified applicants used to precisely shape the demographic and financial contours of the final class 2534. Because institutional needs vary wildly depending on who deposits, the percentage of students admitted from a waitlist swings violently from year to year 1718. A school like Yale or Stanford might pull zero students from its waitlist one year, and 50 to 75 the next 171835. Overall, while National Association for College Admission Counseling (NACAC) data suggests roughly 20% of waitlisted students nationwide might eventually get an offer, at the most highly selective institutions, the true acceptance rate off the waitlist is usually between 0% and 7% 1736.
What Exactly is Summer Melt?
If the waitlist is a college's defense mechanism, "summer melt" is the slow, agonizing leak in the hull. Summer melt refers to the phenomenon where a high school senior formally accepts an offer of admission, pays their enrollment deposit, intends to matriculate, but ultimately fails to show up on campus in the fall 5131415.
Historically, colleges assumed that once a deposit was paid on May 1st, the student was a guaranteed, locked-in unit of yield. Today, researchers estimate that the national summer melt rate ranges between 10% and 40% depending on the institution 5131416. Furthermore, recent data from educational analytics groups like Eduventures shows that aggregate summer melt across hundreds of institutions has grown by nearly 50% since 2021 16.
Summer melt is not merely a statistical anomaly; it is a profound issue of educational equity. The phenomenon disproportionately impacts low-income, first-generation, and historically underrepresented minority students 51314. Research conducted by the Harvard Strategic Data Project on districts like the Fort Worth Independent School District found an overall summer melt rate of 48%, which spiked to nearly 60% for Latino and low-income students, compared to just 19% for their white, affluent peers 17. Similarly, longitudinal tracking by the School District of Philadelphia consistently shows summer melt rates hovering near 40% (40.5% for the class of 2024), with Black, Hispanic, English Learner, and special education students experiencing the highest odds of attrition 1415.
The Mechanics of Attrition
Why do students who have celebrated their college acceptances suddenly abandon their plans? The summer before college is a uniquely vulnerable transitional period 5. When a student graduates from high school in June, they immediately lose access to their high school guidance counselors, trusted teachers, and peer support networks 5. Simultaneously, communication from their intended college is often bureaucratic, highly automated, and deeply intimidating .
During July and August, incoming freshmen are bombarded with complex administrative hurdles: completing digital housing portals, submitting verified immunization records, waiving expensive college health insurance plans, taking online academic placement exams, and finalizing federal work-study documentation 13. For affluent students with college-educated parents, these tasks are mere annoyances easily handled by a guardian. For a first-generation student navigating the system entirely alone, a missed deadline for a housing deposit or confusion over a health insurance waiver can trigger paralysis 13.
The primary driver of melt, however, is financial friction. Unanticipated costs - such as mandatory orientation fees, unexpected gaps in financial aid packages, or the sudden realization of what a federal student loan agreement actually entails over a 10-year repayment period - frequently cause students to lose their nerve and "melt" away to a cheaper local community college, or abandon higher education entirely 518. To combat this, successful interventions have increasingly relied on automated text-messaging nudges and near-peer mentoring programs over the summer to keep vulnerable students on track 513.
The 2024 FAFSA Delays and Post-Pandemic Disruptions
While yield management has always been an imprecise science, the post-2020 landscape has pushed college enrollment models to the brink of total collapse. Enrollment predictability has been shattered by two massive, systemic shocks: the post-pandemic shift to test-optional admissions, and the catastrophic rollout of the new Free Application for Federal Student Aid (FAFSA) 42613.
The Test-Optional Mirage
When the COVID-19 pandemic shuttered standardized testing centers, thousands of colleges temporarily waived their SAT and ACT requirements. Many institutions subsequently made these "test-optional" policies permanent 419. While test-optional policies undeniably lowered the barrier to entry and brought in a wider, more diverse applicant pool, they also artificially inflated application volumes to historic highs 44520.
According to the College Board's Admissions Research Consortium, applications to consortium institutions spiked by an astonishing 38% between the fall 2020 and fall 2024 cycles 4. Over the same period, the rate of applicants actually disclosing their test scores dropped from 52% to 48% 4. Students who previously would not have applied to elite flagships or selective privates because of sub-par test scores were suddenly throwing their hats into the ring, treating selective admissions like a lottery 3120.
For colleges, this created a massive data distortion 47. The surge in applications made schools look far more selective on paper, but enrollment managers knew that these "exploratory" applicants were statistically less likely to enroll if admitted, as they were simultaneously applying to a dozen other test-optional schools 192231. With historical predictive models broken by the lack of standardized testing data, colleges were forced to rely even more heavily on Early Decision lock-ins and massive waitlists to secure their numbers, as they could no longer accurately separate serious applicants from casual ones 13345.
The FAFSA Catastrophe
If test-optional policies broke the historical forecasting models, the 2024-2025 FAFSA rollout temporarily paralyzed the entire higher education system.
Mandated by Congress, the U.S. Department of Education attempted to launch a simplified, streamlined FAFSA form 13212250. The launch was plagued by disastrous delays, severe technical glitches, and algorithmic errors. Instead of the traditional October 1st launch, the form was delayed until December 30, 2023 282150. Furthermore, the government failed to transmit Institutional Student Information Records (ISIRs) - the crucial, raw data packages colleges need to calculate financial aid - until mid-to-late March 28212251.
This delay created a catastrophic chain reaction 50. Colleges were unable to send out financial aid award letters during the traditional March window, leaving millions of students entirely blind to what their education would actually cost 262721. According to research by Carnegie Higher Ed, nearly half of all prospective students were still waiting on a financial aid offer as late as early May 26.
Because students could not make financially informed decisions, the traditional National Decision Day of May 1st functionally collapsed 17281353. Colleges across the country were forced to push their deposit deadlines to May 15th, June 1st, or indefinitely 1353. The FAFSA chaos doubled the rate of student indecision and led to a severe drop in overall FAFSA completions. According to the National College Attainment Network (NCAN), by late June 2024, only 46% of high school seniors had completed the form - a drop of 250,000 students compared to the previous year 23. A survey by the National Association of Independent Colleges and Universities (NAICU) found that 74% of institutions reported the FAFSA issues fundamentally changed the demographic composition of their incoming class 24.
For enrollment managers, this meant "flying blind" into the summer 25. Unable to accurately predict yield because students were delaying their deposits or double-depositing to buy time, colleges panicked and leaned on their waitlists harder than ever before 172533. Highly selective schools kept their waitlists open deep into July and August, generating a chaotic "trickle-down" effect 171253. When a selective university finally pulls a student off the waitlist in late July, that student abandons their previous deposit at a slightly less selective school 1253. That secondary school must then pull from its own waitlist, creating a domino effect of late-summer melt and logistical chaos across the entire higher education ecosystem 171253.
Comparing the Tiers of Higher Education
To fully grasp the mechanics of college enrollment, one must understand that "higher education" is not a monolith. The statistical realities of yield, melt, and waitlists vary dramatically depending on the institutional tier 151925.
| Institution Profile | Example Institutions | Average Yield Rate | Est. Summer Melt | Waitlist Strategy & Admit Rates |
|---|---|---|---|---|
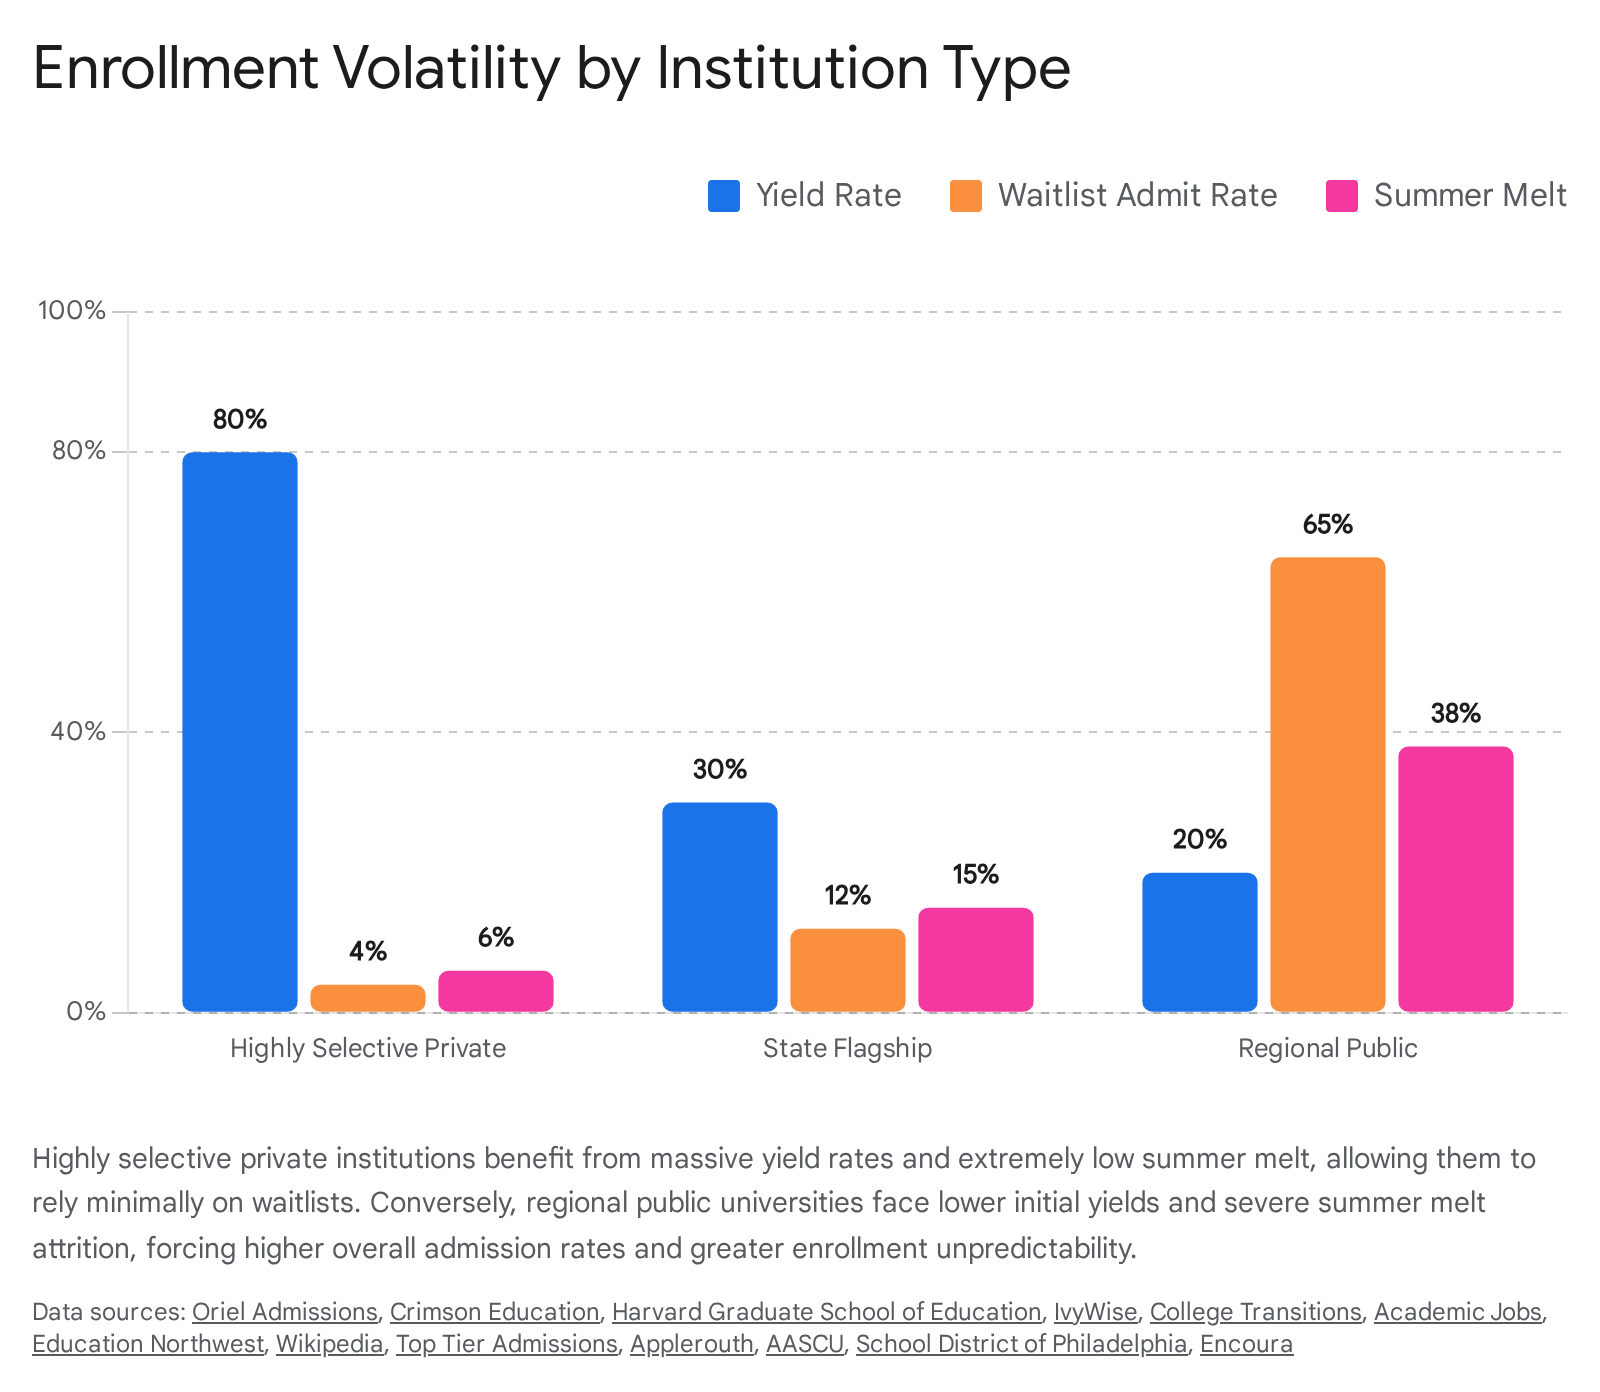
| Highly Selective Private | Harvard, Stanford, MIT, Yale | 60% - 85% | < 10% | Massive waitlists used defensively. Minimal reliance needed. Admit rates typically 0% - 7%.17181936 |
| State Flagship | U. Michigan, UW-Madison, UNC, Florida | 25% - 35% | 15% - 20% | Waitlists used heavily to balance in-state/out-of-state ratios and tuition revenue. Admit rates highly volatile (5% - 15%).117223126 |
| Regional Public | GVSU, Portland State, Western Carolina | 15% - 25% | 25% - 40% | Rarely rely on waitlists; mostly open access or rolling admissions. Suffer from extreme summer melt and demographic cliffs.5223514182728 |
Highly Selective Private Institutions
At the top of the pyramid, schools like Ivy League institutions and elite technical institutes operate in an entirely different reality 119. Because their brands are globally recognized, their yield rates naturally sit between 60% and 85% 19. Their applicant pools are heavily skewed toward affluent, highly resourced students, meaning summer melt is a negligible issue (usually well under 10%) because financial friction is rarely an obstacle 513. For these schools, the waitlist is purely a vanity metric and a safety net for unpredictable black-swan events 18. They may waitlist 5,000 students to assuage the egos of alumni donors whose children were not admitted outright, but ultimately admit fewer than 50, creating waitlist admit rates that routinely hover near zero 11829.
State Flagships
Flagship public universities (e.g., University of Michigan, University of Georgia, UNC-Chapel Hill) occupy the most turbulent middle ground 131. For years, these institutions were viewed as academically rigorous "safety" or "target" schools by high-achieving applicants 31. Today, driven by application inflation, they have become intensely selective, particularly for out-of-state students 31.
State flagships face a unique mathematical constraint: state legislatures often mandate price ceilings on in-state tuition and cap the percentage of out-of-state students they can enroll 3125. However, out-of-state students pay vastly higher tuition rates, essentially subsidizing the in-state population in an era of declining state appropriations 25. Research indicates that a 10% decline in state appropriations is associated with a 5% increase in out-of-state enrollment at public research universities 25. Consequently, flagships rely heavily on their waitlists to surgically balance their demographics 734. If too few out-of-state students accept their offers by May 1st, the flagship will dive into its waitlist specifically to pull wealthy, full-pay out-of-state applicants to balance the budget 734. This creates wild volatility; a flagship might admit 900 students off the waitlist one year to plug a revenue gap, and fewer than 100 the next 117. Notably, this reliance on out-of-state revenue comes at a cost to equity; studies show that a 10 percentage point increase in out-of-state students correlates with a 2.7 percentage point decline in Pell Grant recipients at prestigious flagships 25.
Regional Public Universities (RPUs)
Regional Public Universities educate nearly 70% of all undergraduates attending four-year public institutions in the United States, roughly 5 million students 182728. Institutions like Grand Valley State University or Portland State University are true engines of social mobility, disproportionately serving Pell Grant recipients (averaging 37% of their student body), rural students, and adult learners 182728. The average in-state tuition for RPUs remains highly affordable at roughly $10,000 per year 18.
However, RPUs are facing an existential enrollment crisis 6029. They receive, on average, $1,091 less in state funding appropriations per full-time equivalent student than non-regional flagships 276030. Because they compete for a shrinking demographic of traditional-age college students in the Midwest and Northeast, their yield rates are generally low (often between 15% and 25%) as students frequently opt for higher-ranked flagships if admitted 22182930.
Crucially, RPUs rarely utilize restrictive waitlists; instead, their primary adversary is summer melt 535. Because their student populations are highly vulnerable to financial shocks and lack systemic support, RPUs frequently see up to 40% of their intended freshman class simply melt away over the summer, forcing these institutions to scramble for revenue well into September 51418. Despite these challenges, RPUs remain vital economic anchors. Data from the Upjohn Institute shows that RPU graduates are significantly more likely to stay and work in their local metro areas and states compared to flagship graduates, delivering a massive return on investment for local economies 3031.
Practical Takeaways for Applicants: Navigating the Numbers
Understanding the cold, statistical reality behind the admissions curtain provides prospective students with distinct strategic advantages. College admissions is not a simple meritocracy; it is a complex behavioral matching market 112. Recognizing that colleges are terrified of low yield and summer melt empowers applicants to play the game more effectively.
1. Respect the Power of "Yield Protection" Because mid-tier selective colleges and prestigious public universities actively try to protect their yield rates from "overqualified" applicants who treat them as backups, applicants must actively prove their interest 192225. If a student is applying to a target or safety school, they must engage with the institution's digital footprint. Opening emails, attending virtual information sessions, and conducting official campus visits generate critical data points 2428. When an admissions algorithm flags an applicant as a high flight risk, a robust history of Demonstrated Interest (DI) serves as an essential counterweight, signaling to the enrollment manager that the student is a safe bet for their yield metrics 1924.
2. Early Decision is a Statistical Cheat Code For students who have identified a clear first-choice institution - and, crucially, who do not require the ability to compare multiple financial aid packages - Early Decision (ED) is the most powerful lever available 11922. By signing a binding ED agreement, the student completely removes the college's yield risk 19. The college knows that admitting an ED applicant secures a guaranteed 100% yield for that specific seat. Consequently, institutions like Tulane, Washington University in St. Louis, and Boston College admit ED applicants at vastly higher rates than their Regular Decision peers 1929. The math is simple: universities reward loyalty because loyalty protects their bottom line 19.
3. The Waitlist Requires Immediate, Strategic Action Being waitlisted is not a rejection, but it is also not a passive waiting game. Because waitlists are unranked pools used to fill precise institutional gaps after the May 1st deadline, students must aggressively state their case to be pulled from the pile 2534.
The primary tool for this is the Letter of Continued Interest (LOCI) 725. A successful LOCI must do two things: update the college on recent academic or extracurricular achievements, and, most importantly, explicitly promise to attend if admitted 725. Given that waitlist activity often stretches into June or July, colleges making late offers have zero time to court undecided students 171234. They want to call a student who will say "yes" immediately 2512. Furthermore, because institutional financial aid budgets are often entirely exhausted by the time colleges turn to the waitlist, students who do not require financial aid (full-pay students) frequently hold a significant, albeit controversial, mathematical advantage in waitlist admissions 72532.
Bottom line
The college admissions process is fundamentally governed by the uncompromising mathematics of yield, melt, and the waitlist. Enrollment managers are tasked with an impossibly delicate operation: predicting the behavior of thousands of teenagers while guarding their institution against catastrophic financial shortfalls or logistical overflow. Waitlists are not punitive measures of a student's worth; they are the higher-education equivalent of airline overbooking - a statistical pressure valve designed to protect the university from unpredictability.
In the wake of post-pandemic test-optional policies and the devastating 2024 FAFSA delays, these predictive models have grown increasingly fragile. Application numbers have skyrocketed while financial clarity has plummeted, leading to surging summer melt rates and historic reliance on massive waitlists that stretch deep into the summer. For applicants, understanding this mechanical reality is empowering. By leveraging Early Decision, aggressively demonstrating interest to avoid yield protection, and utilizing Letters of Continued Interest, students can effectively engage with a system that relies entirely on predictability.