How College Selectivity Really Breaks Down
Direct Answer: Understanding True Selectivity True selectivity in the modern higher education landscape is a highly fragmented, context-dependent metric rather than a singular institutional baseline. While a university might report an overall admission rate of 10%, this blended average obscures profound internal disparities. True selectivity is dictated by a candidate's intended major (with fields like Computer Science often exhibiting admit rates under 5% at institutions with overall rates above 40%), their application round (Early Decision applicants frequently enjoy acceptance rates two to three times higher than Regular Decision candidates), their geographic residency (in-state versus out-of-state), and their citizenship status. Consequently, an applicant's actual probability of admission is rarely reflected by the headline acceptance rate, but rather by the specific, hyper-segmented demographic and academic pool in which they compete.
For the contemporary high school senior and their family, the college application process frequently resembles a high-stakes, high-stress lottery. The kitchen table is covered in spreadsheets, portal login credentials, and financial aid forms, all underscored by an escalating anxiety about securing a seat at a prestigious institution. Driven by plunging acceptance rates and an increasingly opaque evaluation process, applicants are casting wider nets than ever before. During the 2024-2025 admissions cycle, the Common Application processed over 10 million applications from approximately 1.49 million distinct first-year students, pushing the average number of applications submitted per student to an all-time high of nearly seven (6.80) 121. The financial toll of this widespread application strategy is immense; with average individual application fees ranging from $40 to $90, and additional expenses for test score reporting and campus visits, the total cost of applying to college can easily soar to $2,500 per student 456. Behind this surge in volume lies a complex matrix of shifting institutional policies, Supreme Court mandates, and deeply ingrained public misconceptions. By examining Common Data Set (CDS) extracts, institutional reports, and macroeconomic enrollment trends from the 2023 and 2024 cycles, this report dissects the underlying mechanics of modern college admissions.
What Are the Macro Trends Driving Application Volume and Selectivity?
The narrative of universal, crushing selectivity is largely a phenomenon concentrated at elite coastal hubs and highly ranked national research universities. A closer examination of the 2023 and 2024 admissions data reveals a bifurcation in the higher education market: while top-tier institutions boast record-low acceptance rates, the vast majority of regional public universities remain highly accessible. The application volume boom is the primary driver of plummeting acceptance rates at highly sought-after institutions. For the Class of 2028, the University of Michigan received over 98,310 applications, resulting in an admission rate of 15.64% 78. For the Class of 2029 and 2030, this volume surged further, breaking the 115,000-application threshold and pushing the projected overall acceptance rate down toward 12.5% 79. Similarly, New York University (NYU) processed a staggering 110,807 to 120,000 applications for recent cycles, admitting roughly 8.0% to 9.2% of the applicant pool 1011. This is a dramatic contraction from a decade prior when NYU's acceptance rate sat comfortably above 30% 1011.
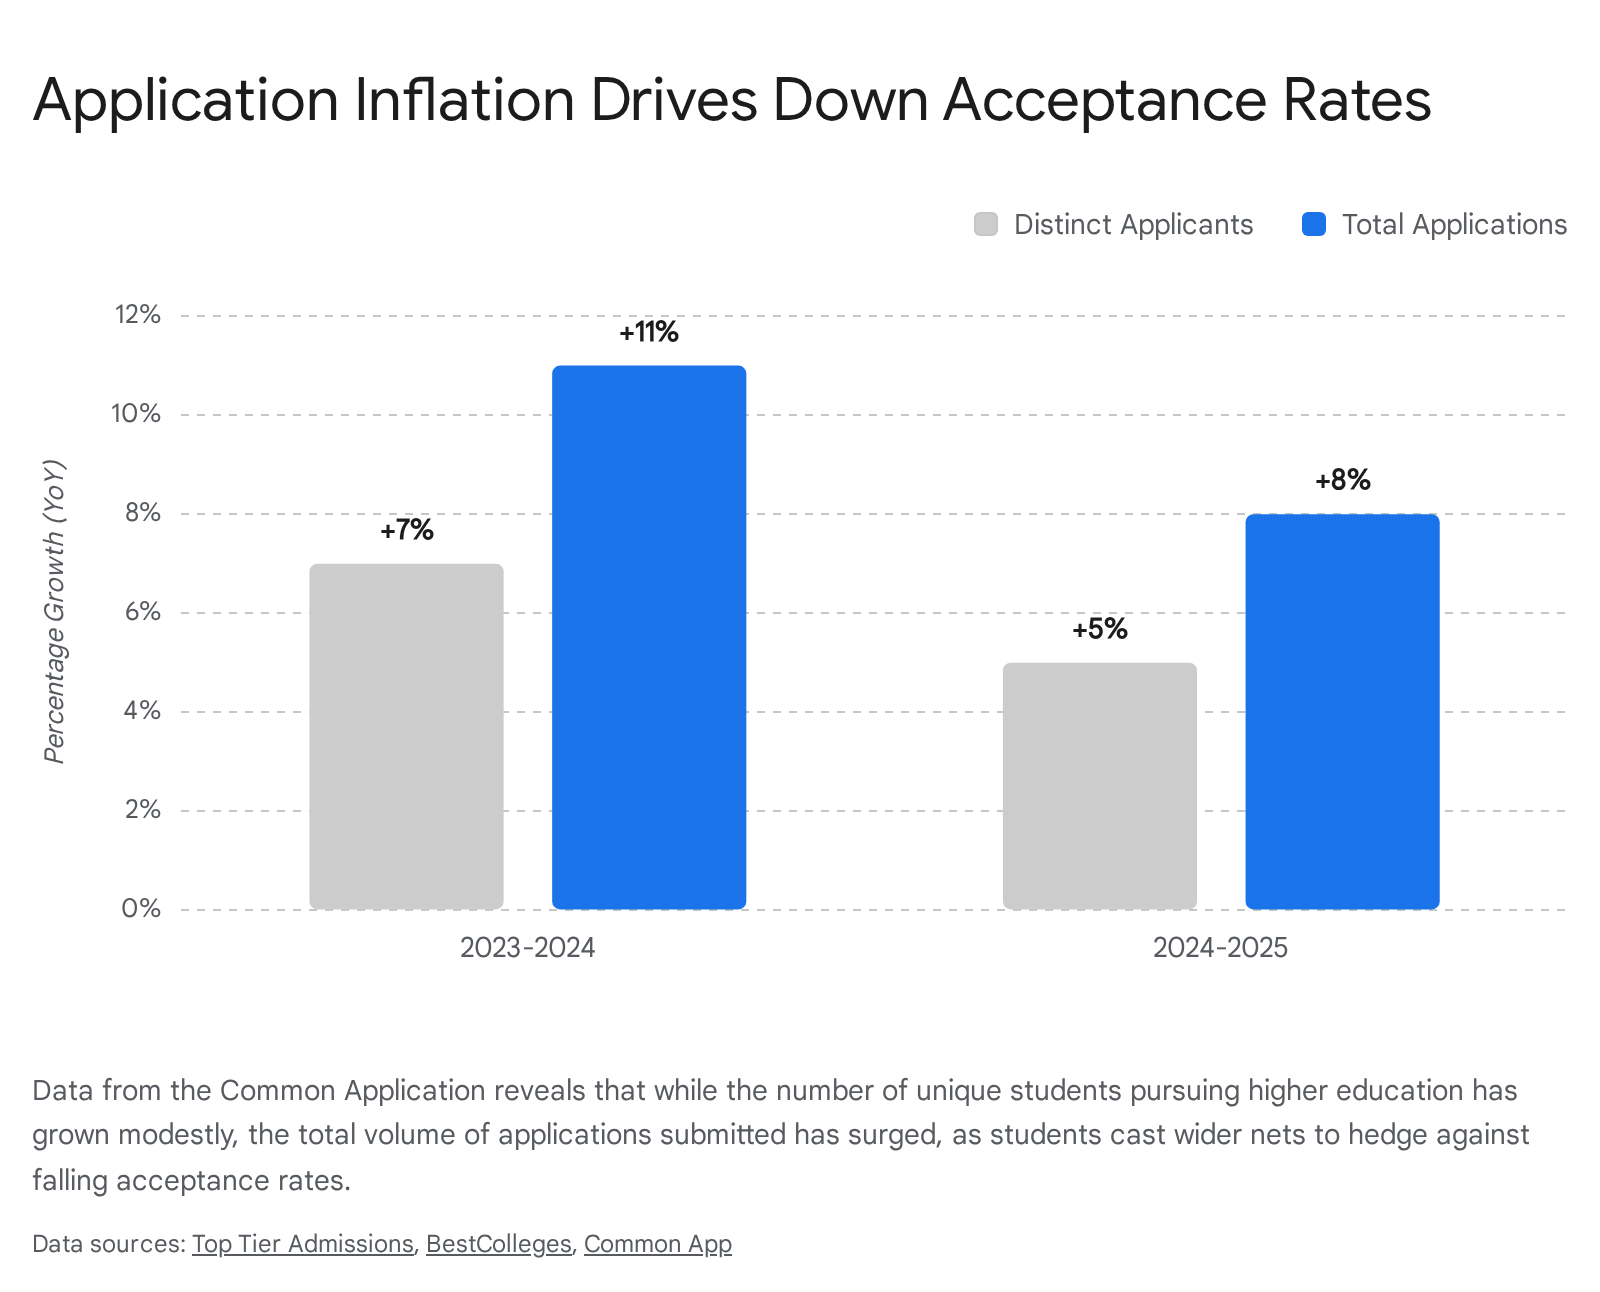
However, this phenomenon of hyper-selectivity is inextricably linked to the denominator of the acceptance rate equation: application volume. The 8% increase in total applications processed by the Common App in 2024-2025 outpaced the modest 1% to 6% increase in distinct, unique applicants from various demographics 21.
Because individual students are submitting more applications, institutions are flooded with candidates. To protect their "yield" - the percentage of admitted students who ultimately choose to enroll - universities are forced to admit a smaller fraction of their ballooning applicant pools. If a college knows that a student is applying to fifteen other comparable universities, the mathematical probability of that student enrolling drops, leading the college to act defensively in its admission offers.
The composition of this applicant pool is also rapidly diversifying, contributing to shifting institutional dynamics. The 2024-2025 cycle saw significant growth among historically underrepresented groups. Latinx applicants and Black or African American applicants represented the fastest-growing demographics, with volume increases of 15% and 12%, respectively 112. Additionally, first-generation college students surged by 14%, a stark contrast to the modest 1% increase seen among continuing-generation applicants 11. Much of this application growth is directed toward public universities, which saw application volumes surge by 13% to 16% in recent cycles, entirely outpacing the 3% to 5% growth experienced by private institutions 121. The geographic center of this application boom is also shifting; domestic applicant growth has outpaced international applicant growth for the first time since 2019, and the state of Texas experienced a staggering 43% surge in application volume, making it the leading state for applicants nationwide 1.
How Have Test-Optional Policies and the SCOTUS Affirmative Action Ruling Reshaped the Landscape?
The college admissions ecosystem is currently absorbing the shockwaves of two massive structural shifts: the normalization (and subsequent partial rollback) of test-optional policies born out of the COVID-19 pandemic, and the 2023 Supreme Court ruling in Students for Fair Admissions v. Harvard (SFFA), which banned race-conscious affirmative action.
The test-optional movement was originally intended to remove barriers for under-resourced students unable to access testing centers during the height of the pandemic. However, its most immediate macroeconomic effect was an unprecedented surge in application volume across the highly selective tier. Students who previously would have self-selected out of applying to Ivy League and Ivy Plus institutions due to sub-median SAT or ACT scores suddenly felt emboldened to apply, viewing their unweighted Grade Point Average (GPA) as sufficient. This flooded elite admissions offices, artificially driving acceptance rates into the single digits. As the pandemic receded, a notable counter-trend emerged in the 2024 and 2025 cycles: the testing rebound. Elite institutions such as Dartmouth, Yale, Brown, Harvard, and the Massachusetts Institute of Technology (MIT) reinstated standardized testing requirements, citing the predictive validity of these exams for early college success 21415. Correspondingly, Common App data from the 2024-2025 cycle indicates a 12% increase in students choosing to report test scores, signaling a return to traditional academic metrics 1. At institutions that remained test-optional, such as the University of Pennsylvania, the data reveals a stark reality: for the Class of 2028, the middle 50% of SAT scores among enrolled students who submitted them was an astronomical 1510 to 1560, and up to 30% of matriculated students opted not to submit scores 1617. This suggests that test-optional policies at elite institutions effectively function as an ultra-high score filter; only students with exceptionally high scores submit them, while others rely entirely on impeccable transcripts and extracurriculars.
Simultaneously, the 2023 SCOTUS ruling fundamentally altered how universities cultivate diverse student bodies. Forced to abandon racial checkboxes, institutions have pivoted to socioeconomic proxies, heavily weighing factors such as first-generation status, Pell Grant eligibility, and the socioeconomic characteristics of an applicant's high school and zip code. This pivot has yielded tangible results at the aggregate level, explaining the aforementioned surge in first-generation and low-income applicants utilizing fee waivers 11. However, the SFFA ruling placed intense legislative and public scrutiny on a different demographic preference: legacy admissions. The practice of affording preferential treatment to the relatives of alumni has drawn immense criticism for perpetuating systemic inequities, as these pools are overwhelmingly white and affluent.
A 2024 Brookings Institution report highlighted that prior to the SCOTUS decision, legacy preferences were remarkably prevalent, utilized by 32% of all selective four-year institutions, including 42% of selective private colleges and 15% of selective public universities 34. Regionally, the practice was most concentrated in the Northeast and South, and least common in the West 35. The data demonstrates a clear demographic impact: selective institutions that ignore legacy status enroll higher proportions of Black (15%) and Hispanic students compared to those that maintain the practice (12%) 4. The Brookings researchers also noted a troubling trend of institutional double-speak, where some colleges continue to ask about legacy status on applications while simultaneously claiming on their websites that they do not consider it in the evaluation process 3. In response to growing public pressure, states like Virginia, Maryland, and Colorado have enacted sweeping legislation banning legacy admissions at public universities 45. Despite these bans, researchers caution that eliminating legacy preferences without simultaneously increasing institutional financial aid is unlikely to dramatically transform socioeconomic diversity; it may simply result in replacing privileged legacy students with privileged, full-pay non-legacy students 3.
In navigating this turbulent environment, elite institutions have increasingly embraced "calibrated uncertainty." Universities such as Harvard, Stanford, Princeton, and the University of Pennsylvania have deliberately ceased publishing acceptance rates and demographic profiles on decision days 21. While administrators argue this guards against applicant anxiety and mitigates the media obsession with low acceptance rates, it effectively obscures the immediate impacts of the SCOTUS ruling and testing policy shifts. This opacity forces families to navigate the admissions landscape using lagging indicators, such as the Common Data Set, which is published well after the cycle concludes. This lack of transparency has even drawn federal attention; a 2025 presidential memorandum issued by the Trump administration explicitly directs the Department of Education to expand data reporting requirements via the Integrated Postsecondary Education Data System (IPEDS) to compel greater transparency in university admissions practices, threatening remedial action for institutions that fail to provide accurate and timely demographic and admissions data 22.
Does Applying Early Decision Still Provide a Meaningful Statistical Advantage?
One of the most consequential strategic decisions available to an applicant is the utilization of binding Early Decision (ED) or restrictive Early Action (REA) plans. A rigorous analysis of 2023-2024 admissions data overwhelmingly confirms that applying early provides a profound statistical advantage at highly selective private universities. The debate over whether to apply early or wait for the Regular Decision (RD) round is effectively settled by the sheer disparity in admit rates.
Institutions favor ED applicants because binding commitments guarantee yield. Yield - the percentage of admitted students who ultimately enroll - is a critical metric for university bond ratings, prestige rankings, and financial forecasting. When a university admits an ED applicant, they know with 100% certainty that the student will matriculate, allowing the admissions office to secure a significant portion of tuition revenue and carefully shape the class profile before the chaotic Regular Decision round begins. At many elite institutions, more than half of the incoming class is filled during the early rounds. For instance, Boston University, which had an overall acceptance rate of approximately 11% to 12.8%, filled roughly 59% of its incoming class through Early Decision, leaving a pool of nearly 69,000 regular decision applicants to fight for the remaining 1,400 to 1,500 seats 23625. Similarly, Northwestern University filled 55% of its incoming class before the regular round even commenced 26.
The divergence in acceptance rates between early and regular rounds is staggering. Data from the Ivy League's Class of 2028 illustrates that early applicants are admitted at rates two to four times higher than their regular decision counterparts. The advantage is consistent across both binding Early Decision and non-binding, but restrictive, Early Action protocols.

| Institution | Early Admission Plan | Early Admit Rate (Class of '28) | Regular Decision Admit Rate (Class of '28) | Overall Admit Rate |
|---|---|---|---|---|
| Brown University | Early Decision (Binding) | 14.38% | 3.8% | 5.16% |
| Columbia University | Early Decision (Binding) | 12.48% | ~3.8% | 3.85% |
| Cornell University | Early Decision (Binding) | 21.4% (est) | ~4.5% (est) | 8.41% |
| Dartmouth College | Early Decision (Binding) | 17.07% | ~4.0% | 5.32% |
| Harvard University | Restrictive Early Action | 8.74% | 2.70% | 3.59% |
| UPenn | Early Decision (Binding) | 14.85% | ~4.0% | 5.40% |
| Yale University | Restrictive Early Action | 9.02% | 3.0% | 3.73% |
Data sourced from institutional releases, Common Data Sets, and aggregated reporting for the Fall 2024 entering class 16262728293031.
While the statistical advantage is clear, it carries profound socioeconomic implications. Binding Early Decision requires a student to commit to attending if accepted, fundamentally eliminating their ability to compare financial aid offers across multiple institutions. Consequently, ED pools inherently skew toward affluent applicants who do not require leveraging competing financial aid packages to afford tuition 26. For middle- and low-income families, applying Early Decision represents a substantial financial risk, further concentrating wealth within the early admission cohorts. Despite this, the calculus for applicants unburdened by financial constraints remains unambiguous: if a clear first-choice school is identified, Early Decision is the single most potent lever to increase admission odds.
Are Certain Majors Creating Hidden Admissions Bottlenecks?
A critical misconception among applicants is treating a university's overall admission rate as a universal probability for all programs. In reality, at universities that "Admit by Major" or by specific undergraduate college, the choice of major creates massive, hidden bottlenecks. The exponential surge in demand for Science, Technology, Engineering, and Mathematics (STEM) - particularly Computer Science (CS) - has radically warped the admissions landscape, creating hyper-competitive micro-environments within otherwise moderately accessible universities.
At the University of Illinois Urbana-Champaign (UIUC), the overall admission rate for the 2024-2025 cycle hovered around 36.6% to 42%, portraying a moderately accessible flagship institution 3334. However, slicing the data by the applicant's first-choice major reveals vastly different realities. The Grainger College of Engineering accepted roughly 21.2% to 24.2% of applicants, while the highly coveted Computer Science program plummeted to a brutal 7.2% to 7.4% admit rate 33. Conversely, applicants targeting the College of Agricultural, Consumer & Environmental Sciences enjoyed a 48.5% to 56.7% admission rate, and the Division of Exploratory Studies admitted over 53% 33.
This dynamic is pervasive across both public and private institutions. A single university can simultaneously operate as a highly selective Ivy-equivalent for engineering applicants and a broad-access state school for humanities applicants.
| Institution | Overall Admit Rate | Selected Highly Competitive Major/College | Selected Accessible Major/College |
|---|---|---|---|
| UCLA (Fall 2024) | ~9.0% | Computer Science: 4.1% Aerospace Engineering: 3.3% |
Humanities (The College): 9.5% Chemical Engineering: 14.0% |
| UIUC (Class of '28) | ~36.6% - 42.0% | Computer Science: ~7.4% Gies College of Business: 20.9% |
Info Sciences: 48.1% Ag, Consumer & Env: 48.5% |
| Purdue (Fall 2024) | ~50.0% | College of Engineering: 34.7% Computer Science: Highly Competitive |
Liberal Arts: 66.0% Education: 70.5% |
| Cornell (Class of '28) | ~8.4% | College of Engineering: ~8.0% | College of Ag & Life Sci: ~11-12% |
| UPenn (Class of '29) | 4.9% | Wharton (Business): ~5.4% | College of Arts & Sciences: ~7.5% |
Data sourced from institutional program reports, FOIA requests, and college-specific Common Data Sets 33736373839.
At the Georgia Institute of Technology, where the overall admit rate is roughly 13.8%, the disparity is equally pronounced. Computer Science accounts for a staggering 92.7% of all applications to the College of Computing, yet computing-related majors ultimately represent only 23% of incoming enrolled students 408. Despite massive infrastructural investments allowing Georgia Tech to increase CS bachelor's degrees by 388% over the last decade, the sheer volume of applicants keeps the computing acceptance rate locked below the university's already low overall average 368.
This phenomenon requires strict strategic discipline from applicants. It may be tempting to attempt a "backdoor" entry by applying to a less competitive major - such as applying for a Liberal Arts or Agricultural Sciences degree with the intent to internally transfer into Engineering later. However, universities are acutely aware of this tactic and are actively closing these loopholes. Institutions frequently cap transfers into impacted majors like Computer Science or Business, implementing rigorous prerequisite GPA requirements or barring internal transfers altogether. Therefore, students must be genuinely willing to study the major for which they are admitted, as the pathway to pivot into STEM post-enrollment is increasingly restricted 368.
How Do Public Flagships Compare to Regional State Universities?
When evaluating state-funded institutions, the geographic lens is paramount. The admissions landscape reveals a stark contrast between coastal research hubs (and state flagships) versus regional public universities, exposing significant variations in access, cost, and admission difficulty.
State flagship universities carry a mandate to serve the taxpayers of their home state, creating a dual-tiered admissions system where out-of-state (OOS) applicants face significantly higher hurdles. For instance, the University of Georgia (UGA) maintains a deliberate goal of enrolling an incoming class that is roughly 80% in-state residents. In its Early Action round, UGA admitted approximately 50% of in-state applicants, compared to just 25% of out-of-state applicants 9. Similarly, Georgia Tech's admit rate was 33% for Georgia residents versus a hyper-competitive 10% for non-residents 404310.
However, looking beyond the flagship level reveals incredible opportunities for accessibility and value. While the University of California, Los Angeles (UCLA) operates with a punishing 9% acceptance rate and intense competition for out-of-state seats, the nearby California State University, Fullerton (CSUF) offers a highly accessible 86.7% to 90.5% acceptance rate 45464748. CSUF provides a robust educational framework, a six-year graduation rate of 69%, and affordable in-state tuition roughly half the cost of UCLA, fulfilling the original mandate of the state university system to provide broad access to higher education 464749.
This pattern replicates across the country, demonstrating that high-quality education is widely available outside the most exclusive brands: * Virginia: The flagship University of Virginia (UVA) admits roughly 16.9% of applicants and requires near-perfect academic credentials, whereas Old Dominion University (ODU) admits over 90% of its applicant pool. ODU boasts an average admitted GPA of 3.3 and provides critical access for students in the Hampton Roads region 505111. * Michigan: The University of Michigan - Ann Arbor (UMich) is a global powerhouse that received a record-breaking 115,000 applications for 2025, yielding an acceptance rate between 15.6% and 17% 79. Conversely, the land-grant Michigan State University (MSU), located in East Lansing, received over 62,000 applications and admitted roughly 84.7% of them 125455. Despite the vast disparity in selectivity, MSU features elite programs in engineering and business, retains 91.4% of its freshmen, and caters to a larger undergraduate population than UMich 5413. * Georgia: While UGA and Georgia Tech feature single-to-low-double-digit out-of-state admit rates, Georgia Southern University remains highly accessible, accepting roughly 88% of applicants with average SAT scores ranging from 970 to 1140, providing a vital educational pathway for thousands of students 571459.
For students constructing a college list, these regional public universities represent critical "safety" or "match" anchors. They offer rigorous academic environments, excellent regional alumni networks, and robust post-graduate outcomes without the lottery-like odds associated with their flagship counterparts.
Are International Students Facing Harsher Odds Than Domestic Applicants?
A persistent point of confusion among international applicants is the conflation of a university's international enrollment percentage with its international acceptance rate. Many globally recognized U.S. institutions heavily publicize their diverse, global student bodies. For instance, NYU reports that 25.3% of its first-year class is international, representing over 1,400 students 10. Boston University (BU) reports a 21% international composition from 68 different countries, and the University of Washington (UW) Seattle maintains an international enrollment of 14.5% 23660.
However, these high enrollment figures do not equate to relaxed admissions standards. In fact, at elite private universities and public flagships, international acceptance rates are often dramatically lower than the overall domestic rates 61. The large international populations on these campuses are the result of exceptionally high yield rates. These institutions act as "Global Magnets"; when an international student from China or India is admitted to NYU, BU, or MIT, they are highly likely to enroll. This high yield allows the university to maintain a massive global footprint without needing to admit a high percentage of international applicants 61.
The competition is particularly fierce from nations like China, India, and South Korea, where thousands of highly qualified students compete for a strictly capped number of seats. At Boston University, where the overall admission rate hovers near 11% to 12.8%, the estimated acceptance rate for international students is a severely constrained 7% to 8% 232562. International candidates must not only demonstrate flawless academic records but also navigate complex visa sponsorship requirements and demonstrate exceptional English proficiency 2363.
Public flagships operate under similar, and sometimes more rigid, structural constraints. Universities like UW Seattle must prioritize in-state taxpayers and navigate state-mandated non-resident enrollment caps. Consequently, while UW Seattle admits 53.9% of its overall applicant pool, the international cohort faces a much tighter bottleneck, evaluated in a separate, highly competitive pool 6061.
Furthermore, financial aid requests severely impact international odds. Institutional policies that are "need-blind" for domestic applicants - meaning the ability to pay is not factored into the admission decision - are frequently "need-aware" for non-citizens. At need-aware schools, an international applicant's request for financial aid can actively diminish their chances of admission, as universities possess limited institutional funds to sponsor non-domestic students 6164. Therefore, international applicants must interpret headline admission rates with extreme caution, recognizing that they are evaluated in a much narrower and more competitive operational framework.
What Are the True Costs of Applying to College Today?
Beyond the academic and emotional toll, the financial burden of the modern admissions cycle is a significant, often under-discussed barrier. The push to apply widely, fueled by decreasing acceptance rates, has exponentially increased the total cost of securing a college acceptance.
While the average application fee for a U.S. college is approximately $48, the fees at prestigious private institutions and Ivy League universities frequently range from $75 to $90 4565. When multiplying these fees by the Common App average of 6.80 applications per student, the baseline cost of merely submitting applications can easily exceed $400 to $600 116. However, application fees are just the beginning.
The total cost of applying to college must also factor in standardized testing expenses. While the College Board provides a limited number of free score reports, transmitting SAT or ACT scores to additional colleges costs approximately $12 per institution 46. When adding the costs of test preparation, tutoring, transcript retrieval fees, and travel expenses for campus visits or interviews, the true average cost to apply to college can soar to $2,500 per student 45.
To mitigate these expenses, low-income students rely heavily on fee waiver programs. Organizations like the College Board and the National Association for College Admission Counseling (NACAC), alongside platforms like the Common App, provide pathways for eligible students to bypass these fees entirely 4666. Furthermore, an increasing number of institutions, particularly community colleges and certain four-year public universities, are adopting zero-fee application policies to remove financial friction and expand access for all demographics 665.
What Are the Common Misconceptions About Applicant Qualifications and Waitlists?
The modern admissions landscape has generated a pervasive mythology surrounding the "perfect" applicant. A primary misconception is that elite universities demand superhuman, well-rounded candidates. In reality, the data reveals a phenomenon of academic compression: flawless grades are no longer a distinguishing factor, but merely the baseline price of entry.
At the University of Pennsylvania, Common Data Set extracts reveal that 59% of enrolled first-year students possessed a perfect 4.0 unweighted GPA, and 92% ranked in the top 10% of their graduating high school class 1631. At Cornell, 95.5% of admitted students who reported a class rank were in the top 25% of their graduating class, and 85.6% ranked in the top 10% 67. This intense clustering of top-tier metrics means that a 4.0 GPA and a 1500 SAT score do not guarantee admission to highly selective schools; rather, they simply prevent the application from being immediately filtered out in the initial review. As noted in Penn's data, the middle 50% SAT range for enrolled students is 1510 to 1560 17. An applicant submitting a 1500 is technically in the bottom quartile of admitted students.
Another major misconception is that hyper-selectivity equates to educational superiority. The reality is that the plunging acceptance rates at top universities are primarily a function of excess demand (application inflation) and fixed supply (campus infrastructure). An institution dropping from an 8% to a 4% acceptance rate has not doubled its academic quality; it has simply received twice as many applications for the exact same number of dormitory beds.
Finally, students often mistakenly view the waitlist as a viable pathway to admission, clinging to false hope long after decision day. Institutional data exposes the waitlist as a highly volatile, unreliable, and often completely stagnant pool. For example, in 2023, California State University, Fullerton placed 931 applicants on its waitlist and ultimately admitted zero (0%) of them 48. At Michigan State University, waitlist behavior exemplifies this extreme volatility: the university admitted just 12 students (0.4%) from a pool of 3,000 waitlisted candidates in 2022, before rebounding to an 82.9% waitlist admit rate in 2024 55. Applicants must treat a waitlist offer as a functional denial and proceed with committing to other institutions, viewing any eventual waitlist admission as an unexpected anomaly rather than a strategic contingency.
What Are the Practical Takeaways for Building a Balanced College List?
Given the nuances of the 2023-2024 admissions cycle, prospective students and counselors must transition from a strategy of sheer volume to a highly targeted, data-driven approach to list building.
Accounting for the intended major is the most critical first step. A balanced list cannot be built using overall institutional acceptance rates alone. If an applicant intends to study Computer Science, Engineering, or Business, they must identify the specific admit rates for those programs. A university that is broadly considered a "match" based on a 45% overall acceptance rate operates as a distinct "reach" if its engineering program admits only 15% of applicants. Aligning expectations with the reality of program-specific bottlenecks prevents devastating surprises on decision day.
Leveraging regional public universities provides the strongest foundation for any college list. Coastal flagship universities are operating with Ivy-like selectivity for out-of-state applicants, making them highly unpredictable. To ensure favorable outcomes, students should actively target high-quality regional public universities, which offer exceptional programmatic strength alongside acceptance rates exceeding 80%. These institutions provide robust alumni networks and excellent post-graduate outcomes without the anxiety of single-digit admit rates.
Deploying Early Decision must be handled strategically and cautiously. If a family does not require competing financial aid packages to afford tuition, Early Decision remains the most powerful statistical tool available. The data from elite institutions undeniably proves that applying ED drastically improves admission probabilities. However, this advantage should not be wasted on a "reach" school where the student's academic metrics fall far below the institutional median; it is best utilized at a highly competitive "match" institution where the commitment can push a borderline application into the accepted pile.
Financial planning must extend to the application process itself. With students applying to an average of nearly seven schools, families should budget accordingly for application fees, test transmissions, and travel, recognizing that total costs can quickly approach $2,500. Proactively seeking fee waivers and identifying institutions with zero-fee application policies can alleviate this burden, ensuring that financial constraints do not dictate where a student can apply.
Finally, authenticity must supersede gamesmanship. Attempting to game the system by applying to niche, under-enrolled majors with the intent to internally transfer to a competitive STEM program is highly risky. Universities are acutely aware of this tactic and enforce strict barriers to internal transfers. Applicants should align their declared major with their authentic high school coursework and extracurricular narrative, ensuring that their application presents a cohesive and genuine academic profile.
Bottom Line
The 2023 and 2024 college admissions cycles have crystallized a new reality: the concept of universal selectivity is a myth driven by application inflation, while true selectivity is a highly localized, hyper-competitive phenomenon shaped by an applicant's chosen major, residency, and application timing. As test-optional policies drive application volumes to record highs and the fallout from the SCOTUS affirmative action ban reshapes demographic evaluations, elite institutions are retreating behind walls of data opacity. To successfully navigate this environment, applicants must look past the headline acceptance rates. By understanding the profound statistical advantages of Early Decision, acknowledging the severe bottlenecks within STEM majors, and recognizing the immense value and accessibility of regional public universities, families can transition from stressful, lottery-style application behaviors to a strategic, data-grounded approach.