Cold Email vs LinkedIn Outreach Conversion Rates in 2026
The State of B2B Buyer Behavior and Market Dynamics
The landscape of business-to-business (B2B) sales outreach has undergone a structural transformation by 2026, driven by tightening digital deliverability regulations, sophisticated platform anti-automation algorithms, and a fundamental shift in buyer preferences. The era of high-volume, generic outreach has decisively ended. B2B buyers now operate in an environment characterized by severe inbox saturation; the average business professional receives approximately 121 emails per day, with nearly half generated autonomously by artificial intelligence 12. Consequently, buyers have developed advanced filtering mechanisms, both psychological and technological, to ignore template-based communications 34.
Buyer preferences have also shifted away from early vendor engagement. In 2026, 67% of B2B buyers express a preference for an entirely rep-free buying experience, and 73% actively avoid suppliers who send irrelevant outreach 51. Modern buying committees shape their opinions long before engaging with sales development representatives (SDRs). Furthermore, 94% of B2B buyers now utilize large language models (LLMs) to synthesize and organize research during their purchase process, displacing traditional search engines and shifting initial vendor discovery out of the reach of standard outbound sales cadences 57.
Buying Committees and Sales Cycles
The structural complexity of B2B transactions has increased substantially. The median B2B buying group for deals exceeding $50,000 has expanded to 11.2 stakeholders, up from 9.7 in 2024 2. This expansion has predictably elongated the sales cycle for organizations relying on legacy demand generation tactics. Mid-market sales cycles now average 121 days, while enterprise sales cycles average 218 days 2. However, organizations running unified account-based marketing (ABM) and intent-driven outreach stacks have managed to reduce their average sales cycles by up to 17 days year-over-year 2.
The primary challenge for revenue organizations is no longer generating outreach volume, but rather achieving precision and relevance across a diffuse committee. Buyers consume an average of 13.4 pieces of content before directly contacting sales, leaving 67% of the early buying journey entirely self-directed 2. Sellers can no longer rely on static collateral to exert influence; outreach must intercept buyers with highly personalized, context-aware information 1.
Budget Allocations and Outreach Economics
Despite these friction points, the B2B ecommerce market is projected to reach $36.16 trillion globally in 2026 5. To capture this market, overall B2B marketing budgets have stabilized at a cross-industry median of 9.1% of company revenue 2. However, this aggregate figure masks significant industry variance: software organizations allocate approximately 11.4% of revenue to marketing, professional services allocate 8.9%, and manufacturing firms allocate 5.7% 2.
Chief Marketing Officers and Revenue Officers are actively redirecting funds away from broad-reach demand generation and into ABM, intent data infrastructure, and AI tooling 2. This reallocation is driven by the stark reality of modern outreach unit economics. Data indicates that ABM-led programs generate 2.6 times more pipeline per marketing dollar than broad-reach demand generation, boasting 41% higher win rates and 33% larger average deal sizes upon conversion 2.
Cold Email Performance Metrics and Deliverability
Open Rates, Reply Rates, and Funnel Conversion
The degradation of cold email baseline performance is one of the most prominent trends in 2026 sales data. Between 2019 and 2026, average response rates collapsed due to inbox saturation, the commoditization of generative AI copywriting tools, and increasingly hostile spam filters. In 2019, the average cold email reply rate stood at approximately 8.5% 910. By 2024, this average had declined to 5.1%, and platform-wide data from late 2025 and 2026 indicates the global average reply rate has stabilized at a historically low 3.43% 910. Simply put, roughly 19 out of 20 cold outbound emails are ignored 10.
Open rates, while historically relied upon as top-of-funnel indicators, remain highly skewed by privacy technologies. Following the introduction of Apple's Mail Privacy Protection (MPP), which pre-fetches and auto-loads tracking pixels, open rates artificially inflated to over 36% in 2023 10. By 2026, algorithms and analytics platforms have partially corrected for this inflation, reporting stabilized median open rates between 27.7% and 42.35%, heavily dependent on the specific sender's list hygiene and domain reputation 2510. However, revenue operations leaders increasingly discount open rates entirely, treating the reply rate and the positive response rate (prospects expressing genuine interest rather than merely replying to opt out) as the only valid indicators of campaign health 1112. The average positive response rate hovers around 2% 11.
The ultimate conversion metric - cold email to booked meeting - remains razor-thin. The typical funnel architecture reveals severe drop-offs at every stage: a campaign delivering 1,000 emails might yield 250 opens (25%), 50 link clicks (5%), 30 replies (3%), and ultimately 5 booked meetings (0.5%) 13. Across the industry, the average meeting booking rate sits between 0.8% and 1.0% 1114. When tracking the full funnel from initial cold email to closed-won revenue, the conversion rate drops to an average of 0.215%, representing roughly one closed deal for every 464 to 500 emails sent 1013.
Industry-Specific Email Benchmarks
While the aggregate averages suggest a struggling channel, a bifurcated reality exists. Senders employing generic, mass-blast templates consistently yield reply rates below 2%, often triggering spam traps and domain blacklists. Conversely, top-quartile performers consistently achieve reply rates of 15% to 25% by utilizing signal-anchored personalization and rigorous ideal customer profile (ICP) targeting 341015.
Furthermore, cold email performance is highly sensitive to the recipient's industry vertical. Sectors with historically lower digital adoption or higher regulatory urgency often yield higher response rates, whereas technologically saturated industries are highly resistant to outbound communication.
| Industry Vertical | Average Open Rate | Average Reply Rate |
|---|---|---|
| Legal Services | 38.0% - 42.0% | 10.0% - 10.42% |
| Professional Services | 26.0% - 30.0% | 8.0% - 11.0% |
| Healthcare / MedTech | 28.0% - 32.0% | 4.0% - 9.0% |
| Financial Services | 30.0% - 35.0% | 3.4% - 8.0% |
| Manufacturing | 25.0% - 29.0% | 7.0% - 10.0% |
| SaaS / Software | 47.1% | 1.9% - 4.77% |
| Consumer Goods | 19.3% | < 2.0% |
Data compiled from 2025/2026 industry benchmark analyses 101617.
The 2024 Sender Requirement Reset and 2026 Impact
The most severe headwind facing cold email operators in 2026 is deliverability infrastructure. In February 2024, major mailbox providers Google and Yahoo implemented a strict "Bulk Sender Requirement Reset" that fundamentally altered how commercial email is processed, measured, and penalized 18. These protocols are now fully enforced, and non-compliance results in severe throttling, spam folder routing, or permanent domain rejection 419.
The definition of a "bulk sender" was officially established at 5,000 emails per day to Gmail or Yahoo addresses 18. However, the cascading effect of these regulations means even low-volume senders must adhere to the new standards to maintain overall inbox placement. The mandatory requirements that govern 2026 outreach include:
- Strict Authentication (SPF, DKIM, DMARC): Bulk senders can no longer skip authentication protocols. Sender Policy Framework (SPF) and DomainKeys Identified Mail (DKIM) must both align and pass cryptographic validation. Furthermore, a Domain-based Message Authentication, Reporting, and Conformance (DMARC) policy must be published in the DNS, transitioning from a monitoring
p=nonestatus to enforcement modes likep=quarantineorp=reject1834. - One-Click Unsubscribe (RFC 8058): Commercial senders must implement a specific List-Unsubscribe header allowing recipients to opt out with a single click, without navigating to a secondary landing page or logging into a portal 1835.
- Spam Complaint Thresholds: Google explicitly requires spam complaint rates to remain below 0.3%, though deliverability experts strongly advise keeping complaints below 0.1% 18195. Once a domain exceeds the 0.3% threshold, algorithmic deliverability degrades rapidly across all sending domains linked to the same underlying infrastructure 18.
As a result of these strict parameters, approximately 17% of all cold emails never reach the primary inbox, often due to poor domain authentication, high bounce rates, or spam-triggering lexical patterns 103. The "Inbox Apocalypse" has forced sales teams to abandon the legacy strategy of routing all outreach through a single primary corporate domain 1. Instead, modern organizations deploy sophisticated infrastructure setups utilizing dozens of secondary domains, automated domain warm-up tools, and strict volume limits capping individual mailboxes at 30 to 40 emails per day 1017. Exceeding 50 emails per mailbox per day is heavily correlated with triggering Google and Microsoft's algorithmic spam filters 17.
ISP Filtering Distinctions
Deliverability realities also vary heavily depending on the recipient's Internet Service Provider (ISP). In 2026, mailbox providers utilize advanced artificial intelligence to measure engagement quality rather than mere volume.
Gmail continues to dominate global inbox share. While its overall deliverability rate is high (approximately 87.2%), a significant portion of commercial mail is routed to the Promotions tab rather than the primary inbox 3. Gmail prioritizes engagement quality; low reply rates combined with missing DMARC records trigger immediate penalties 3.
Microsoft (Outlook and Hotmail) is widely considered the most hostile ISP for cold outreach in 2026. Its AI-based filters and aggressive user feedback loops result in an inbox placement rate of just 75.6%, with nearly 14.6% of mail routed directly to spam 3. Microsoft strictly monitors bounce rates; domains generating bounce rates above 2% face severe reputation degradation 23. Yahoo and AOL provide a middle ground, with an 86.0% inbox placement rate and lower spam routing (4.8%), provided the sender strictly adheres to the 0.3% spam complaint threshold 193.
LinkedIn Outreach Performance and Platform Constraints
Connection Acceptance and Direct Message Reply Rates
As cold email deliverability faltered under regulatory pressure, B2B sales teams migrated aggressively to LinkedIn. The platform offers immediate professional context, mutual connections, and verifiable identities, which collectively reduce the perceived risk for the buyer and increase foundational trust 122425.
LinkedIn outreach consistently outperforms cold email on pure engagement metrics. The average acceptance rate for LinkedIn connection requests ranges from 20% to 45%, heavily dependent on the level of personalization, the sender's profile optimization, and the relevance of the target audience 121426. Once a connection is established, the average reply rate to direct messages sits between 10% and 25% 3126. LinkedIn InMail, a premium feature that allows senders to bypass the connection requirement and message open profiles directly, generates average response rates of 18% to 25% 910.
The quality of engagement on LinkedIn also skews notably higher than email. Research indicates that highly personalized LinkedIn direct messages can achieve up to a 39% positive reply ratio 26. Furthermore, 35% of sales and marketing decision-makers report receiving their highest-quality, most pipeline-ready leads through social platforms 25.
The execution of the outreach also matters. Including a highly personalized message within the initial connection request boosts the reply rate to 9.36%, compared to just 5.44% for blank connection requests 16. Interestingly, while utilizing AI to draft the first message increases the initial response rate (4.19% vs. 2.60% for non-AI messages), subsequent follow-up messages perform slightly better when drafted without AI assistance, suggesting buyers are highly sensitive to automated conversational pacing 16.
The Shift to Behavioral Fingerprinting
The primary operational disadvantage of LinkedIn in 2026 is its severe restriction on scale. Following a multi-year explosion of automation tools that flooded the network with spam, LinkedIn completely overhauled its Trust & Safety detection engine, culminating in a massive, ongoing automation crackdown 729.
Prior to 2025, LinkedIn monitored simple API rate limits, allowing users to send upwards of 100 connection requests per day with relative safety. In 2026, LinkedIn's enforcement has shifted entirely from counting visible volume limits to calculating invisible behavioral scores 729. The platform now utilizes advanced "behavioral fingerprinting" and Transport Layer Security (TLS) fingerprinting to definitively distinguish human users from automation scripts 293031.
LinkedIn's data science algorithms analyze variables that are mathematically complex for legacy automation tools to spoof. These detection vectors include: * Hardware and Browser Fingerprinting: The platform collects and analyzes operating systems, GPU traces, installed system fonts, and screen resolutions to establish a unique, persistent device identity for every session 31. * Session Consistency and Cookie History: The platform tracks the persistence of a user session. Starting every session with a fresh login and zero cookie history is mathematically predictable and flags the account as non-human 31. Sharing a single hardware fingerprint across multiple user accounts triggers an immediate high-risk flag under LinkedIn's strict one-user policy 31. * Navigation and Scroll Velocity: LinkedIn actively tracks the time a user spends reading a profile, the cadence of typing, irregular scrolling patterns, and non-linear site navigation 2931. * IP Anomalies: The platform detects logins originating from data center IPs or accounts exhibiting sudden geographic shifts (e.g., logging in from New York and London within a two-hour window) 30.
Safe Operational Limits and Account Security
Consequently, standard browser extensions that inject code directly into the LinkedIn Document Object Model (DOM) are classified as the highest-risk tools and are the most common cause of account bans in 2026 3032. The only sustainable automation platforms are cloud-based systems utilizing dedicated residential IP addresses and anti-detect browsers that inherently replicate real hardware environments and human session protection 730.
Even with sophisticated, secure automation infrastructure, the acceptable volume limits on LinkedIn are exceedingly low compared to historical norms. Safe operational thresholds in 2026 dictate limits of 20 to 50 connection requests per day (for established accounts), 30 to 80 messages per day, and 50 to 100 profile views per day 2930. Operating beyond these strict limits, particularly with a connection acceptance rate falling below 60%, rapidly accelerates penalty points and triggers automatic account restrictions or permanent bans 3032.
Comparative Economics and Return on Investment
Infrastructure and Labor Cost Breakdowns
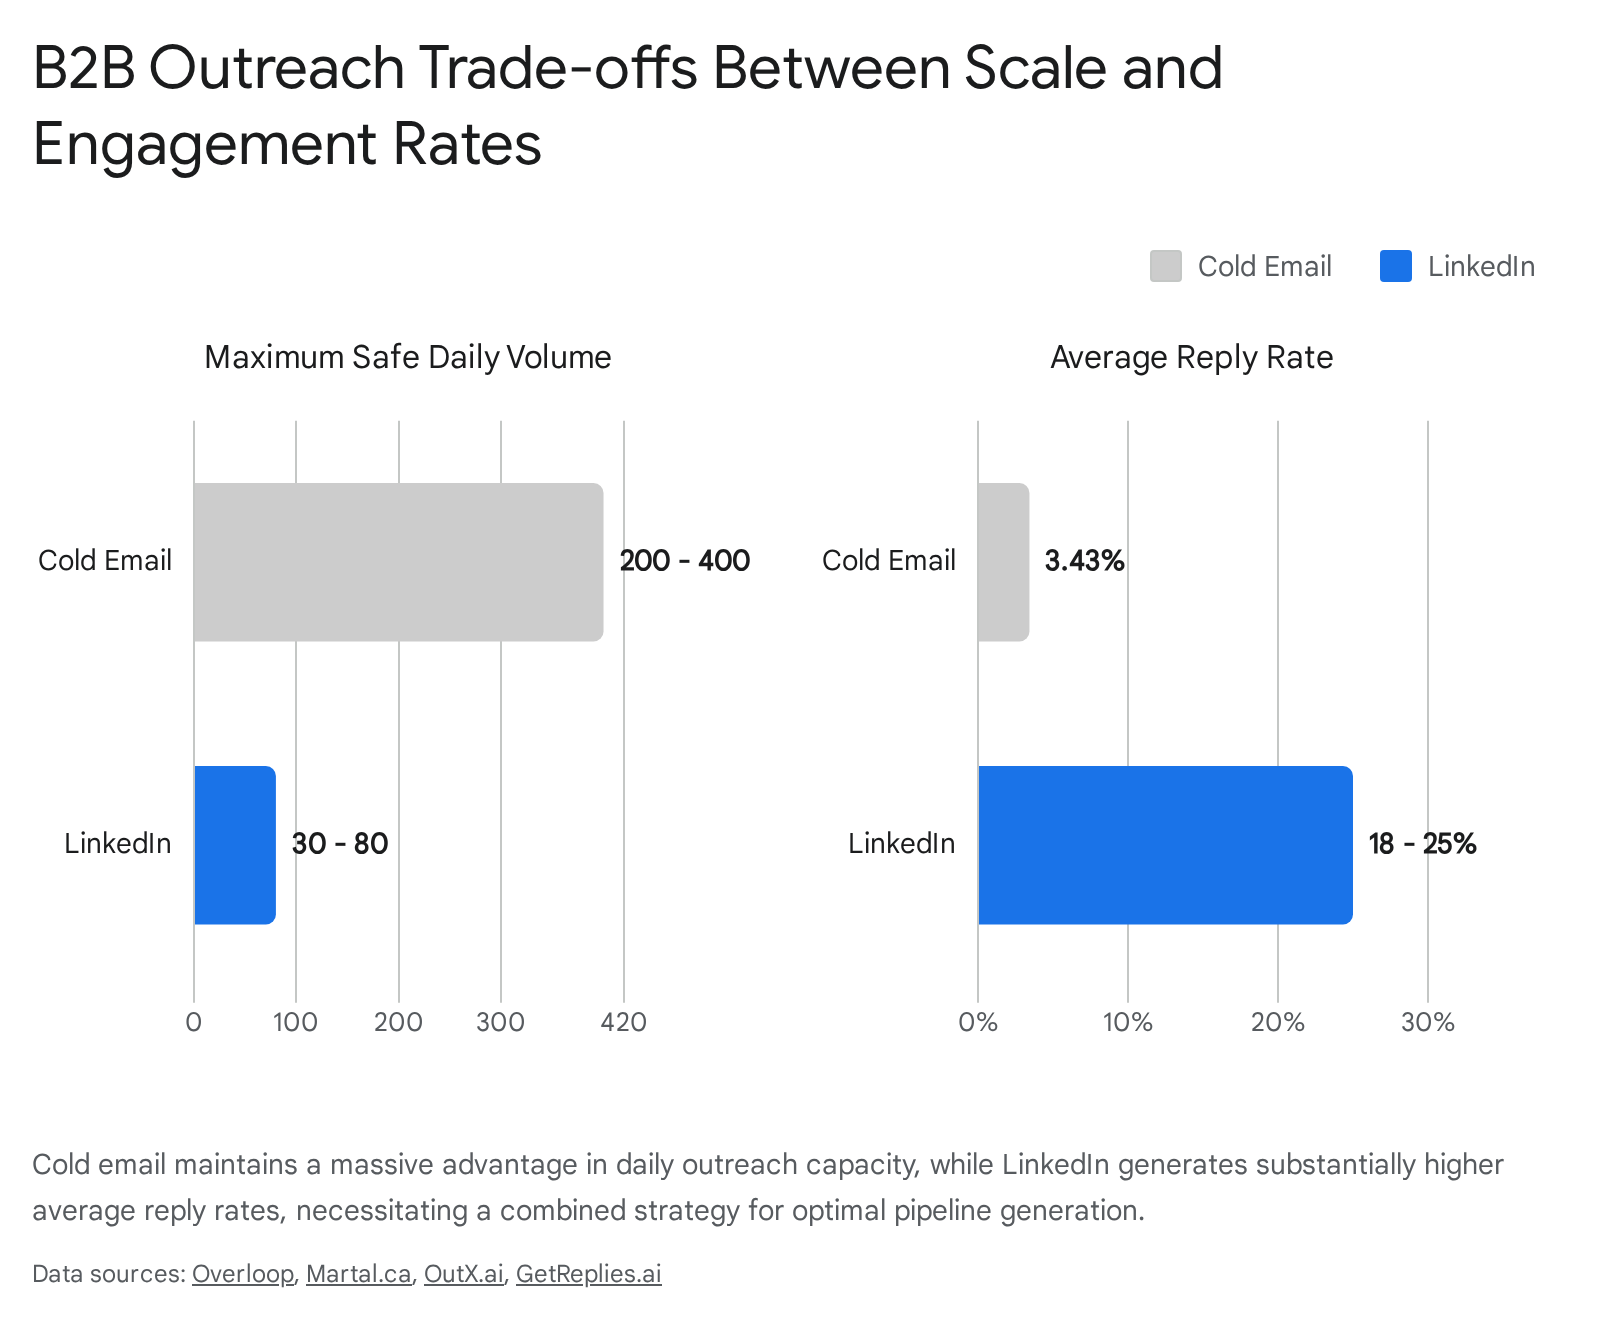
The decision to allocate resources between cold email and LinkedIn rests on a fundamental trade-off between scale and engagement quality, which directly impacts the unit economics of a campaign.
Cold email is highly scalable and cost-efficient on a per-touchpoint basis. Once the initial infrastructure is established - purchasing secondary domains, configuring authentication records, warming mailboxes, and securing contact data - the marginal cost of sending an additional 1,000 emails is negligible, often equating to mere pennies per contact 126.
In contrast, deploying LinkedIn at scale requires higher fixed capital. It demands premium subscriptions like LinkedIn Sales Navigator (approximately $80 per user/month) alongside specialized, cloud-based automation tools to protect the account from bans 6. When modeling a standard 2025/2026 campaign targeting 1,000 contacts, the economic differences become clear. Contact search and verification (labor plus data tools) cost between $530 and $2,000. Copywriting and message personalization require $800 to $1,000 in labor. The technical message-sending infrastructure requires approximately $480. Factoring in follow-up labor and response processing, a 1,000-contact campaign run entirely in-house averages $2,200, whereas outsourced models range from $1,500 to $3,000 33.
Cost Per Lead and Meeting Booking Efficiency
Because of its massive volume capacity, cold email presents a low cost-per-contact ($0.01 to $0.05). However, its low conversion rate (roughly 0.2% to 1% to a meeting) necessitates this volume to yield sustainable pipeline 126. LinkedIn presents a significantly higher cost-per-contact, estimated between $0.50 and $3.00 6. However, because LinkedIn generates reply rates roughly three to four times higher than email, and those replies generally carry higher commercial intent, the ultimate cost-per-qualified-meeting is frequently competitive with, or superior to, cold email alone 9.
| Metric | Cold Email Outreach | LinkedIn Direct Messaging |
|---|---|---|
| Average Visibility / Open Rate | 27.7% - 42.35% (Varies by list quality) 21014 | 10% - 20% (Message Visibility) 26 |
| Average Reply Rate | 3.43% - 5.1% 10 | 10% - 25% (On accepted connections) 912 |
| Top-Quartile Reply Rate | 15% - 25% (Signal-based) 3 | 35% - 40% (Highly personalized) 9 |
| Meeting Booking Rate | 0.8% - 1.0% 1114 | 2.0% - 5.0%+ (Derived from higher intent) 634 |
| Safe Daily Volume Limit | 200 - 500+ (Spread across multiple domains) 12 | 20 - 80 Actions (Strict platform caps) 2930 |
| Primary Failure Risk | Domain reputation decay, algorithmic spam routing 1224 | Behavioral fingerprint detection, permanent account bans 2430 |
| Average Cost Per Touchpoint | Extremely Low ($0.01 - $0.05) 126 | Moderate/High ($0.50 - $3.00) 6 |
Multichannel Orchestration and Funnel Velocity
The Synergy of Email, LinkedIn, and Phone
Because each channel possesses distinct structural limitations - email lacks immediate trust, LinkedIn severely lacks volume capacity, and cold calling is difficult to scale without exhausting representatives - the standard operating procedure for enterprise and mid-market revenue teams in 2026 is multichannel orchestration 35.
Isolating outbound efforts to a single medium results in compounding inefficiencies. Analyzing millions of outreach touchpoints, benchmark data definitively proves that multichannel sequences utilizing three or more channels (Email, LinkedIn, and Phone) deliver 287% more overall responses than single-channel outreach campaigns 101114. Breaking this down further, merely adding strategic phone touches to an email sequence increases conversions by 128%, while pairing email with LinkedIn messaging lifts total reply rates by 101% compared to executing email alone 14.
Cold calling remains highly effective for immediate objection handling and rapport building, despite broader digital trends. The baseline dial-to-meeting conversion rate averages 2% to 3% 36. However, this aggregate metric masks the actual funnel mechanics. The average "connect rate" (when a prospect actually answers the phone) is only 5.4%. Once connected, the "set rate" (conversations converted into booked meetings) averages 4.6% 36. Top-quartile representatives drastically outperform these averages, hitting a 13.3% connect rate (largely due to superior mobile phone data accuracy) and a 16.7% set rate based on superior conversational execution 36. It typically requires an average of 8 call attempts to successfully reach a decision-maker, underscoring the need for persistent, automated cadences rather than manual ad-hoc dialing 3738.
Optimal Cadence Architecture
The optimal 2026 outbound strategy utilizes LinkedIn as the tip of the spear to build initial warmth, professional familiarity, and identity verification, followed by cold email for detailed value propositions, scalability, and long-term follow-up. A standard, high-performing sequence framework operates over 4 to 6 weeks, executing 8 to 12 varied touchpoints 324.
A highly effective sequence architecture follows this pattern: * Day 1 (LinkedIn): Profile view and personalized connection request to establish identity. * Day 3 (Email): Initial cold email referencing the LinkedIn connection attempt. Data indicates that referencing a mutual LinkedIn connection or a recent social interaction in an email subject line improves open rates by 30% to 50% 24. * Day 7 (LinkedIn): Direct message providing a concise, relevant industry insight if the connection was accepted, without an aggressive sales pitch. * Day 10 (Email): Value-led follow-up email iterating on the core business problem. * Day 14 (Phone): Cold call attempt targeting the prospect, leveraging the warmth generated by the previous digital touches 263536.
Consistent follow-up is critical across these sequences. Follow-up emails collectively generate 42% of all campaign replies; yet astonishingly, 48% of sales representatives fail to send a second message, abandoning vast swaths of potential pipeline 10. Furthermore, sequence timing influences outcomes. Launching multi-channel campaigns on Mondays, with automated follow-ups pushed on Wednesdays, consistently outperforms other scheduling patterns 1025.
Lead Handoff Latency and Meeting Show-Up Rates
Securing a reply is merely a mid-funnel metric; the ultimate goal is booking a qualified discovery meeting that the prospect actually attends. In 2026, severe friction exists between establishing initial contact and securing calendar placement.
The average B2B qualified-to-meeting-booked conversion rate sits at 40%, indicating that 60 out of every 100 qualified leads generated by outreach never actually materialize into a calendar event 39. This friction is highly sensitive to the industry. In highly regulated sectors like Financial Services, structured procurement timelines elevate the booking rate to 52%. Conversely, in IT Services, inbox saturation and complex multi-stakeholder scheduling suppress the booking rate to just 28% 39.
A massive, often overlooked point of failure in B2B pipeline generation is "handoff latency." In organizations where specialized SDRs qualify leads and subsequently hand them off to Account Executives (AEs) for the actual meeting, the time elapsed between qualification and AE contact dictates the booking probability. In 2026, data reveals a steep exponential decay curve related to this handoff latency: * Qualified leads contacted within 5 minutes of handoff achieve a 78% booking rate 39. * Leads contacted after 24 hours achieve a 32% booking rate 39. * Leads contacted after 48 hours achieve an 18% booking rate 39.
By the 72-hour mark, a qualified lead actually possesses a lower booking probability than a net-new cold outbound contact, because the prospect's immediate context has shifted and their window of peak intent has closed entirely 39.
The Impact of Artificial Intelligence on Outreach Efficacy
The Artificial Intelligence Personalization Paradox
In 2025 and 2026, the adoption of generative AI in B2B marketing reached near ubiquity, with 96% of B2B marketers reporting the use of AI tools 23. However, this rapid adoption coincided with a paradoxical, systematic decline in overall conversion rates. According to industry analysis, as AI utilization scaled across revenue teams, baseline cold email conversion rates actively dropped from historical norms of 1 - 2% to 0.5 - 1.5% 23.
This phenomenon, recognized industry-wide as the "AI SDR Trap," occurs when organizations deploy autonomous software agents to maximize outreach volume without implementing human judgment or strategic oversight 23. The economic rationale is highly enticing to CFOs: a fully loaded human SDR costs between $110,000 and $139,000 annually (including software, benefits, and churn), while an autonomous AI SDR tool licenses for approximately $25,000 23.
However, relying entirely on AI for volume generation breaks down rapidly at the execution layer. A 90-day controlled corporate study comparing an AI-only pipeline against a human-AI hybrid model demonstrated severe quality disparities. The AI-only model booked 847 meetings, but only converted 11% into qualified opportunities. The human-AI hybrid booked just 312 meetings, but converted an impressive 38% into opportunities, ultimately generating 2.3 times more closed revenue from 63% fewer meetings 23.
The failure of the AI-only model is rooted in the "Mail Merge Fallacy." Traditional automation simply injects a prospect's name or company into a static template. By 2026, buyers operate with the baseline assumption that all digital text is AI-generated unless proven otherwise 1. AI SDRs generating massive volume fail to detect nuanced human behaviors - such as realizing a prospect responded only to terminate the conversation, or identifying that a company's recent hiring freeze negates the timing of the pitch 23. Consequently, relying on volume without judgment results in low engagement, high spam complaints, and the swift algorithmic destruction of domain reputation 123.
Signal-Based Prospecting Mechanisms
The organizations achieving 15% to 25% reply rates in 2026 have shifted away from AI-generated template injection toward "Signal-Based Prospecting" 315. In this model, AI is utilized primarily for deep account intelligence and data synthesis, rather than bulk copywriting.
Signal-based personalization requires anchoring every outbound message to a specific, real-world business event - such as a recent funding round, a strategic M&A announcement, a sudden surge in specific departmental job postings, or an executive leadership change 3. Historically, this approach was bottlenecked by manual research; a human SDR required 30 to 60 minutes per account to synthesize data from news outlets, SEC filings, LinkedIn, and corporate websites, limiting total output to 8-10 accounts per day 3.
In 2026, AI platforms have collapsed this "Research-to-Outreach" cycle to under 60 seconds 15. AI tools now monitor live behavioral and intent data, synthesize insights from thousands of disparate sources, and trigger contextually relevant messaging precisely when the buyer enters a purchasing window 340. Personalization has moved beyond firmographics (e.g., targeting all Chief Marketing Officers at SaaS companies) to advanced psychographics and intent (e.g., targeting CMOs actively exploring alternatives to a specific competitor) 40.
This methodology fundamentally alters the unit economics of B2B sales. Teams deploying intent-aware sequencing and signal-anchored outreach report a 15% to 25% lift in conversion rates and a 20% reduction in time-to-first-meeting within two quarters 7. The differentiation lies in reaching a precise prospect at a highly relevant moment, providing immediate proof that the sender understands their specific operational context.
Governance Risks and the Shift to Human Validation
The unregulated explosion of generative AI in commercial applications has introduced significant enterprise risk. Forrester predicts that in 2026, B2B companies will lose more than $10 billion in enterprise value due to the ungoverned use of generative AI in go-to-market applications, stemming from declining stock prices, legal settlements, and regulatory fines regarding data usage and hallucinated claims 8.
Furthermore, as buyers increasingly rely on genAI to source information, trust deficits are emerging. Data shows 19% of buyers using AI applications feel less confident in their purchasing decisions due to unreliable information 8. Consequently, a counter-trend is emerging: human expertise is rivaling genAI in appeal. In the final commit stage of a purchase, buyers actively seek out product experts and human validation to confirm the complex insights generated by their own internal AI tools 8. The highest-performing organizations in 2026 are those that utilize AI to orchestrate the outreach logistics and surface the signals, while retaining human sellers to validate insights, negotiate dynamically, and build ultimate trust.
Regional Variations in B2B Outreach
Global B2B outreach strategies cannot be applied uniformly; response metrics, channel preferences, and cultural norms diverge sharply across North America, Europe (EMEA), and the Asia-Pacific (APAC) regions.
North America Market Dynamics
The United States market is characterized by extreme inbox saturation, high technological adoption, and a cultural preference for direct, ROI-focused communication. North American professionals receive over 120 emails per day, significantly higher than the 60-80 typical in Europe 2. Consequently, the US market exhibits 15% to 20% lower overall response rates compared to EU markets across all digital channels 14.
Furthermore, North America demonstrates an email unsubscribe rate that is 3.9 times higher (0.39%) than the global average (0.1%) 2. This is driven by high baseline awareness of anti-spam regulations (CAN-SPAM and CASL), the sheer volume of daily noise, and a cultural directness where professionals prefer to formally opt out via compliant one-click mechanisms rather than passively ignore irrelevant messaging 2.
Europe, Middle East, and Africa Market Dynamics
The European market generally yields higher engagement rates but requires nuanced, hyper-localized execution. Email open rates hover around 22%, but reply rates frequently reach 7% to 10% - and up to 15% for top-tier campaigns 14. Southern Europe (e.g., Italy, Spain) leads global benchmarks with reply rates peaking at 11.81%, heavily emphasizing relationship-building prior to transactional business discussions 1416.
Northern Europe and Scandinavia demonstrate exceptional engagement on LinkedIn, featuring high positive response rates (45% to 53% of replies denote genuine interest) 14. The DACH region (Germany, Austria, Switzerland) requires highly structured, formal outreach, where respecting hierarchical titles and professional formalities is mandatory for success 14. Furthermore, European buyers generally prioritize value propositions centered on compliance, sustainability, and long-term partnership viability over aggressive, short-term growth metrics 14.
Notably, WhatsApp has emerged as a powerhouse B2B channel in specific European regions (particularly Spain, Italy, and Germany), where adoption is nearly universal and response rates can exceed 50% when used appropriately as a final, warm touchpoint 14.
Asia-Pacific Market Dynamics
The APAC region is highly fragmented, requiring distinct channel strategies by country. In aggregate, email open rates remain standard (22% to 23%), but reply rates suppress to 3% to 5%, with meeting booking rates languishing between 1% and 2% 14. However, the cost per lead in APAC ($80) is notably lower than in North America ($230) or EMEA ($120), allowing for slightly different volume economics 9.
LinkedIn adoption and outreach efficacy are strong in India, Australia, and Singapore, mirroring Western benchmarks with 10% to 12% reply rates 14. Australian buyers prefer casual, direct outreach, while Indian professionals expect formal language and professional deference 14.
Conversely, in East Asian markets such as Japan and South Korea, cold LinkedIn direct messaging is highly ineffective, yielding a response rate of roughly 3% 14. These cultures are highly hierarchy-conscious and rely heavily on warm introductions, corporate pedigrees, and established relationships over cold digital outreach 14. Furthermore, WhatsApp has virtually no B2B presence in China, Japan, or Korea, where localized applications like WeChat, LINE, and KakaoTalk entirely dominate all professional digital communication 14.
| Region | Email Reply Rate | LinkedIn Reply Rate | Cost Per Lead | Dominant Cultural Preference |
|---|---|---|---|---|
| North America | 3.4% - 5.0% | 10% - 15% | $230 | Direct, ROI-focused, High unsubscribe tendency |
| EMEA (General) | 7.0% - 10.0% | 10% - 17% | $120 | Compliance, Sustainability, Formal structures (DACH) |
| APAC (India/Aus) | 3.0% - 5.0% | 10% - 12% | $80 | Mix of casual (Aus) and highly formal (India) |
| APAC (East Asia) | ~3.0% | ~3.0% | N/A | High hierarchy, Warm introductions required |
Data compiled from regional marketing benchmarks in 2025/2026 149.
Sales Engagement Platform Ecosystem
Consolidation and Native CRM Integration
The execution of these complex, multichannel, AI-driven strategies relies entirely on the underlying sales engagement platforms (SEPs). In 2026, the SEP category has evolved far beyond simple email sequencing tools, consolidating into massive revenue orchestration engines.
Salesloft and Outreach remain the dominant enterprise platforms, though their strategic positioning has diverged. Salesloft's 2025 merger with Clari combined engagement workflows with deep revenue intelligence and forecasting, relying heavily on its "Rhythm AI" engine to prioritize daily representative activities based on live deal signals 1044. Outreach continues to excel in high-volume sequence optimization, robust A/B testing, and real-time call coaching via its Kaia integration 4445.
Platform Comparison and Market Positioning
For mid-market teams, native CRM engagement tools have gained significant market share. HubSpot Sales Hub offers seamless functionality without the data syncing errors that often plague third-party integrations, appealing to teams that prioritize ease of setup and ecosystem cohesion over extreme volume capabilities 1044. Meanwhile, platforms like Apollo provide massive value by combining a 275-million contact database natively with engagement tools, though users face inconsistent data quality outside US markets and restrictions on LinkedIn scraping 10. The choice of platform in 2026 dictates an organization's ability to execute signal-based personalization at scale while avoiding the algorithmic penalties associated with raw volume.
Conclusion
The 2026 B2B outreach landscape has firmly rejected the high-volume, low-effort tactics that defined the early 2020s. While cold email remains the most scalable and cost-effective channel, algorithmic spam enforcement and severe buyer fatigue have suppressed average platform-wide reply rates to just 3.43%. LinkedIn offers a high-trust environment with reply rates soaring between 10% and 25%, but its strict behavioral fingerprinting and session tracking severely restrict volume.
Success in modern pipeline generation relies on three operational pillars. First, the deployment of synchronized, multi-channel sequences that leverage LinkedIn for warmth and email for scale, which generates 287% more responses than single-channel efforts. Second, the rejection of "AI SDRs" acting as autonomous spammers, replaced by AI utilized for deep account intelligence and sub-60-second signal identification. Third, a ruthless focus on funnel efficiency, particularly regarding CRM data hygiene and the elimination of handoff latency, to ensure that hard-won replies actually convert to calendar bookings. Revenue teams that adapt to this precision-first, signal-anchored methodology routinely achieve top-quartile performance, generating 15% to 25% reply rates in a market where competitors are increasingly filtered out as noise.