Common Pitfalls in Financial Backtesting
The Epistemological Framework of Historical Simulation
Historical simulation, commonly referred to as backtesting, serves as the foundational empirical process in quantitative finance. The procedure is designed to evaluate the viability of algorithmic trading strategies, factor models, and asset allocation frameworks by simulating their performance against historical market data 12. The fundamental assumption underlying this process is that a strategy capable of identifying and exploiting structural market inefficiencies in the past will, subject to regime stationarity, continue to perform favorably in the future 34.
However, historical simulation is inherently vulnerable to systematic methodological errors. Financial time series are noisy, non-stationary, and highly dimensional 156. Within these environments, researchers can easily construct models that exhibit exceptional historical performance but fail entirely when deployed with real capital. This discrepancy has precipitated a reproducibility crisis within financial machine learning and quantitative research, where published anomalies and highly profitable backtests frequently collapse out-of-sample 7.
The most pervasive and structurally damaging of these methodological errors are survivorship bias, look-ahead bias, and overfitting 123. These pitfalls do not merely introduce random variance into backtest results; they systematically skew the output in an optimistic direction 19. This unidirectional inflation of performance metrics - such as annualized returns, hit rates, and the Sharpe ratio - creates a profound credibility gap. Understanding the mathematical origins, statistical symptoms, and rigorous mitigation frameworks for these vulnerabilities is critical for the robust evaluation of quantitative investment systems 2710.
Survivorship Bias in Asset Universes
Mechanisms of Universe Selection Bias
Survivorship bias is a statistical error that occurs when a historical dataset restricts its constituent universe only to those entities that have survived a selection process through the end of the observation period, systematically overlooking the entities that failed, were delisted, or were acquired 311. In the context of financial backtesting, this bias typically manifests when researchers utilize the current constituents of a stock index, or the current roster of a mutual fund database, to simulate historical returns retroactively 2312.
Financial indices and market exchanges are highly dynamic ecosystems subject to continuous reconstitution. Companies that experience severe market capitalization declines, bankruptcy, or prolonged underperformance are routinely deleted from major benchmarks, while successful, growing companies are added 2313. If a researcher conducts a backtest spanning from 2000 to 2020 using only the companies listed in an index in 2020, the simulation introduces an immediate, severe distortion. It retroactively imparts the long-term success of the surviving companies onto the historical period, treating them as if they were established index constituents during their early growth phases 312.
Simultaneously, this flawed methodology effectively erases the losses generated by defunct companies that were actively traded - and likely held by an active strategy - during the intervening years. Prominent historical capital destructions, such as the collapses of Enron, Lehman Brothers, and Eastman Kodak, disappear entirely from the simulation universe because these entities no longer exist in the present-day index 124.
The exclusion of underperforming or failed assets skews the perception of stability and truncates the apparent downside risk. Because the most volatile and distressed assets are removed from the historical record, the aggregated volatility of the backtested portfolio is artificially suppressed 1112. This leads to conclusions that overestimate historical returns and severely underestimate maximum drawdowns and portfolio variance 1112.
Empirical Impact on Equity and Fund Performance
The empirical impact of survivorship bias varies depending on the asset class, the capitalization tier of the universe, and the duration of the backtest. However, the magnitude of the distortion is consistently significant across global markets.
In mutual fund research, seminal studies by Brown, Goetzmann, and Ross (1995), followed by Elton, Gruber, and Blake (1996), demonstrated that relying solely on surviving funds overstates the average performance of the industry. These early analyses of the U.S. mutual fund industry indicated that survivorship bias inflated average risk-adjusted returns (alpha) by approximately 0.9% to 1.4% per annum 13516. This bias was found to be particularly pronounced in the small-cap fund sector, where the probability of a fund folding or merging due to poor performance is historically much higher 316.
The impact is even more severe when backtesting individual equities, particularly in emerging markets and small-capitalization indices where corporate turnover and failure rates are structurally elevated 25. A comprehensive analysis of India's NIFTY Smallcap 250 index over a nine-year period (2016 - 2025) quantified the exact magnitude of this distortion. The study reconstructed the historical index composition and revealed that survivor-only backtesting overstated annualized returns by 4.94 percentage points 5. This represented a 23.3% relative overstatement of returns (26.17% in the survivor-biased simulation versus 21.23% in reality). Furthermore, the bias inflated the Sharpe ratio by 0.097 points (a 9.1% relative overstatement) 5. Over the nine-year period, the compounding effect of this annual inflation resulted in a staggering cumulative return difference of 284 percentage points 5.
In large-cap U.S. equities, evaluating the S&P 500 using only its present-day constituents generates similar, albeit slightly smaller, structural inflations. Studies comparing "current constituents only" against true point-in-time constituent data for the S&P 500 indicate that backtested returns are inflated by 1.5% to 2.0% annually when survivorship bias is present 618. Broad market studies analyzing the entire U.S. stock market from 1926 through 2023 reveal that out of 29,078 U.S.-listed stocks, only 31 existed for the entire 98-year period 4. Approximately 24,000 companies disappeared due to bankruptcy, acquisition, or privatization, and 51% of all stocks generated negative returns over their lifetimes 4. Backtests that ignore these failures present a fundamentally false reality.
| Asset Universe / Index | Annualized Return Inflation | Relative Sharpe Inflation | Measurement Characteristics |
|---|---|---|---|
| U.S. Equity Mutual Funds | 0.9% - 1.4% | Moderate | Focuses on institutional fund survival and merger masking 135. |
| S&P 500 (Large Cap U.S.) | 1.5% - 2.0% | Moderate | Reversal of index inclusion effects; removal of high-profile bankruptcies 6. |
| CRSP US Stock Database | 1.6% (1926-2001) | N/A | Total market analysis capturing long-term delisting impacts 18. |
| NIFTY Smallcap 250 (India) | 4.94% | 9.1% (0.097 points) | Emerging market dynamics; high volatility and strict removal thresholds 5. |
Sector-Specific and Cap-Size Vulnerabilities
The severity of survivorship bias is not uniformly distributed across investment styles. Strategies that rely heavily on distressed value, momentum, and small-capitalization stocks suffer disproportionately from universe selection errors 118.
The Russell 3000 index provides a stark historical example. If a simulation is restricted to the stocks that were in the Russell 3000 on December 31, 1986, and survived until 2014, the sample size is reduced to fewer than 500 companies 2. These survivors massively outperform the equally weighted Russell 3000 index because deletions are intrinsically linked to extended underperformance or bankruptcy. Consequently, a backtest of a credit-risk factor model operating on a survivor-biased universe will generate absurd conclusions. When tested on a survivor universe, firms with the highest credit risk appear to produce cumulative returns seven times higher than the best-quality stocks, solely because the "risky" firms that actually defaulted were excluded from the dataset, leaving only the risky firms that experienced miraculous recoveries 2.
A secondary consequence of dynamic market capitalization is index graduation and demotion. The Russell 2000 index, a subset of the smallest securities from the Russell 3000, reconstitutes annually with approximately 25% turnover 619. Stocks that perform exceptionally well experience market capitalization growth and "graduate" out of the small-cap index. Conversely, mid-cap stocks that underperform are demoted into the small-cap index. A 10-year backtest utilizing today's Russell 2000 composition systematically excludes the hundreds of successful companies that drove the index's historical returns before graduating, while inadvertently including recent underperformers that were historically mid-caps 619.
Architectural Mitigation via Point-in-Time Data
The definitive solution to survivorship bias is the implementation of rigorous "point-in-time" (PIT) constituent datasets. A PIT dataset maintains a precise, day-by-day historical record of index membership, corporate actions, delistings, and bankruptcies 1267.
When executing a historical simulation, the quantitative engine must strictly align the available tradable universe on any given day $t$ with the exact constituents that comprised the index on day $t$, irrespective of their future status 2127. For institutional researchers, procuring survivorship-free databases that explicitly retain delisted and bankrupt securities is a strict prerequisite for generating valid strategy analytics 118. If such data is unavailable, the analytical limitation must be explicitly acknowledged, and any strategy holding small-cap or distressed equities must be viewed with extreme skepticism 1.
Look-Ahead Bias and Information Leakage
The Temporal Divergence of Financial Data
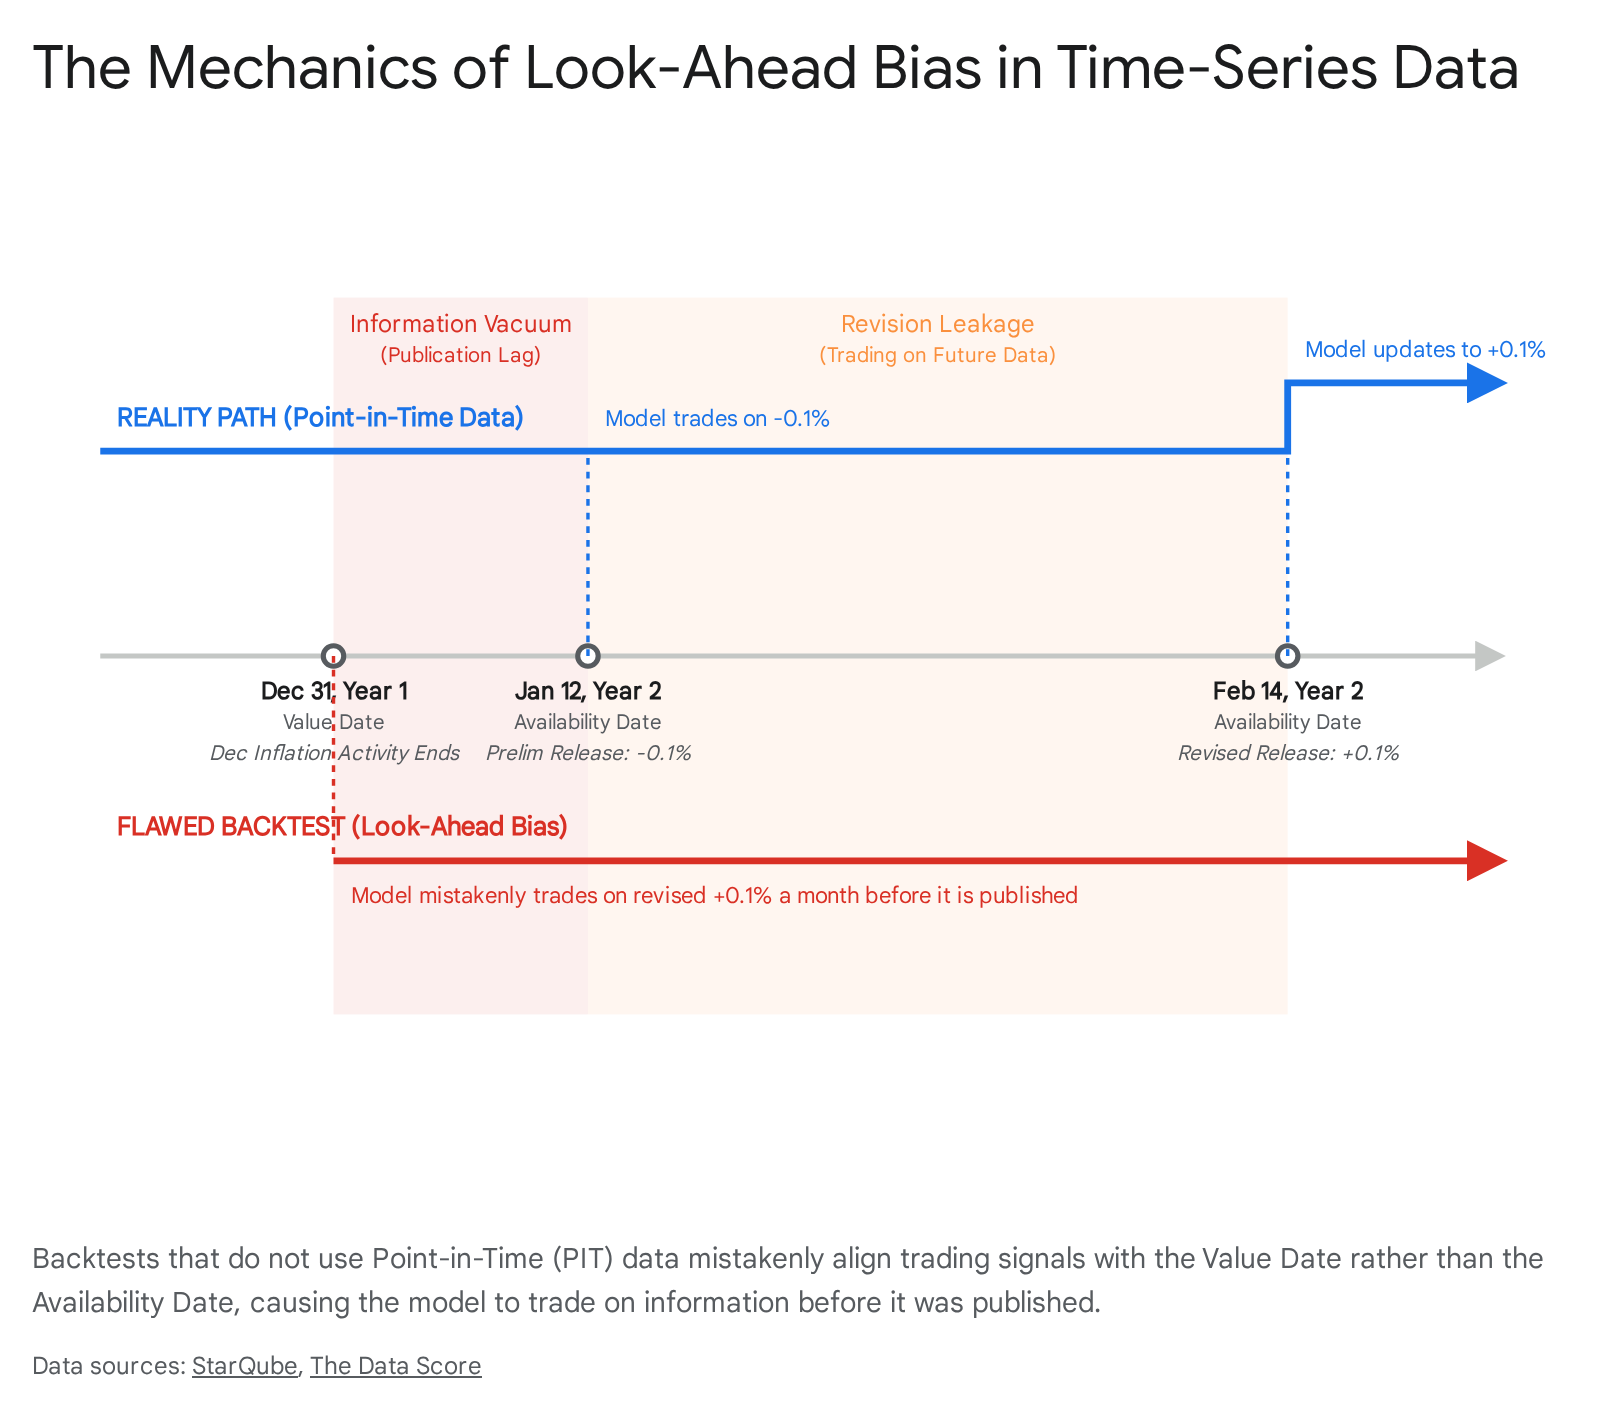
Look-ahead bias occurs when a backtesting model incorporates information that would not have been available to market participants at the point in time the simulated trading decision was made 1221. This form of temporal information leakage is among the most fundamental backtesting errors, frequently resulting in hypothetical trading systems that appear highly profitable in simulation but collapse instantly when deployed in live trading environments 8.
The root cause of look-ahead bias is the failure to distinguish between a data point's value date (the chronological accounting period the data describes) and its availability date (the exact timestamp when the data was published and became known to the market) 6. Without robust database infrastructure to enforce this distinction, quantitative models default to aligning data based on value dates, thereby allowing the system to peer into the future.
Corporate Earnings and Fundamental Reporting Lags
Corporate fundamental data introduces severe temporal challenges for backtesting engines. Publicly traded companies typically report quarterly earnings four to six weeks following the conclusion of the accounting period 6. If a quantitative model natively aligns a company's first-quarter financial metrics (ending March 31) to a timestamp of March 31, it introduces a massive look-ahead advantage, because the actual earnings release - and the corresponding market reaction - does not occur until mid-May 6. This creates a six-week "information vacuum" where the backtest trades on unpublished revenue figures and profitability metrics 6.
This discrepancy is particularly dangerous in systematic equity strategies and factor investing. Strategies relying on value, quality, or growth factors (e.g., price-to-earnings ratios, return on equity, year-over-year EPS growth) must utilize fundamental data precisely as it was known on the day of the portfolio rebalance 27.
Restatements further compound this issue. Companies frequently revise prior quarterly earnings due to accounting errors, regulatory audits, or changes in compliance standards 8910. For instance, Chinese technology firm ZTE Corporation restated its Q1 2018 financials in July 2018 to report a net loss, precipitating a severe drop in share price 11. If a standard fundamental database simply overwrites the Q1 2018 data with the restated figures, a backtest running over the April-to-June period will act upon a corrected reality that the historical market never actually experienced 81011. The algorithm will "know" about the loss months before the market was informed, generating illusory short-selling profits.
Macroeconomic Indicator Revisions
Macroeconomic indicators represent a primary vector for look-ahead bias due to the structural nature of government data publication. Datasets such as Gross Domestic Product (GDP), the Consumer Price Index (CPI), and employment statistics are subject to both publication lags and subsequent, often substantial, revisions as statistical agencies gather more comprehensive data over time 6812.
For example, preliminary estimates for U.S. GDP are released approximately 30 days after the end of a quarter, but the final, definitive GDP figures may be revised up to three years later 6. During the 2008-2009 recession, initial estimates for U.S. job losses were subsequently revised upward from 4.8 million to 8.7 million - an 81% underestimation of the crisis's severity at the time 6. A backtest utilizing the final, revised macroeconomic data would correctly identify the severe depth of the recession in real-time and adopt defensive posturing. However, actual market participants operating during those months lacked that precise scale of information, operating instead on the milder initial estimates 6.
The capitalization of this unavailable information leads to "false alpha." Quantitative studies indicate that factor timing strategies relying on macroeconomic indicators exhibit Sharpe ratios 15% to 25% higher when using final revised figures compared to simulations restricted strictly to the initial, unrevised releases 6.
Even standard data preprocessing techniques can introduce look-ahead bias. For instance, seasonal adjustment algorithms (such as X-13ARIMA-SEATS) use future observations to estimate seasonal factors at any given historical point 1314. Applying fully retrospectively smoothed or seasonally adjusted time series into a backtest allows future variance to bleed into past signals, contaminating the simulation 13.
| Bias Vector | Value Date Definition | Availability Date Reality | Look-Ahead Mechanism |
|---|---|---|---|
| Corporate Earnings | End of Fiscal Quarter (e.g., Mar 31) | Earnings Release (e.g., May 15) | Trading in April using fundamental data prior to official SEC filing and public release 621. |
| Macro Data (GDP/CPI) | End of Month/Quarter | 30+ days post-period | Model executes trades based on economic states before statistical agencies publish initial estimates 6. |
| Data Revisions | Initial Release Date | Revision Date (Months/Years later) | Overwriting historical databases with modernized, corrected estimates (e.g., 2008 job loss corrections) 68. |
| Alternative Data | Corporate Event Date | Public Announcement Date | Trading on CEO departures or M&A before the events are disclosed to regulatory bodies 11. |
Constructing Point-in-Time Architectures
Eradicating look-ahead bias requires the deployment of strictly time-stamped, Point-in-Time (PIT) architectures 26. A PIT database stores multiple "vintages" of data, recording every iteration of a data point alongside the exact millisecond it was made available to the public 101230.
In a PIT framework, fundamental and macroeconomic data points are stamped with two distinct dates: the period end date and the observation/publication date 81031. When a backtesting engine queries a PIT database for an asset's earnings on April 15th, the system evaluates the timestamp constraint and returns only the specific data vintage that was definitively published prior to that date, accurately preserving the historical constraints faced by actual traders 101230.
Overfitting and the Illusion of Predictive Signal
Parameter Optimization and In-Sample Calibration
While survivorship and look-ahead biases stem primarily from data infrastructure deficiencies, backtest overfitting is a profound methodological failure of statistical inference. Overfitting occurs when a mathematical model is excessively complex or heavily parameterized, causing it to "learn" the idiosyncratic noise and random fluctuations of a historical dataset rather than the underlying, repeatable market signals 167.
In modern quantitative finance, the proliferation of immense computational power has enabled analysts to run millions of simulated variations of a strategy - testing different moving average lengths, holding periods, stop-loss limits, indicator thresholds, and weighting schemes 4321534. This process, formally known as parameter optimization or hyperparameter tuning, frequently degenerates into data snooping 73215. A researcher or algorithmic optimizer systematically searches through the parameter space until it identifies a combination that maximizes the historical performance metric (e.g., highest in-sample net profit or Sharpe ratio) 43536.
Because financial data is highly stochastic, non-stationary, and dimensional, any sufficiently flexible model can isolate a specific sequence of random fluctuations in a bounded historical period and generate an impressive upward-sloping equity curve 115. However, because market noise is entirely random and does not repeat, a model calibrated to historical noise will suffer immediate performance degradation when exposed to out-of-sample data or deployed in live markets 161015.
The integration of advanced machine learning (ML) models, including deep neural networks and reinforcement learning agents, severely exacerbates overfitting risks 73738. These algorithms possess vast capacities to approximate complex functions and are highly susceptible to capturing spurious, localized patterns in training data 6736. Reinforcement learning approaches are specifically noted for their tendency to exploit patterns that exist only in frictionless, simulated environments, making it extraordinarily difficult to translate high in-sample rewards into live trading success 7.
The Multiple Testing Problem and Selection Bias
The mathematical core of backtest overfitting is governed by the "Multiple Testing Problem" and selection bias. When researchers conduct large-scale, correlated searches for profitable strategies without strong prior economic hypotheses, they generate thousands of iterative "trials."
Even if every single strategy tested possesses a true expected out-of-sample return of zero (i.e., no inherent predictive skill), random variance dictates that a certain percentage of these strategies will exhibit highly positive historical performance purely by statistical chance 3940. If an analyst evaluates 1,000 random-noise strategies and selectively reports only the single best-performing iteration, the resulting in-sample Sharpe ratio will be extraordinarily high. However, this high performance is a statistical illusion caused by selection bias 44142.
This dynamic was critically implicated in the high-profile failure of Long-Term Capital Management (LTCM). While LTCM utilized sophisticated convergence trades, the models relied on brief historical track records (approximately 36 months) exhibiting extraordinarily high Sharpe ratios (around 2.0). The strategies were the product of extensive parameter testing across hundreds of factor variations. Because the firm failed to adjust these performance metrics for the sheer volume of multiple testing and the non-normality of the underlying assets, the statistical evidence of their "edge" was deeply flawed. When market regimes shifted and asset spreads exploded rather than converged, the overfit models failed catastrophically 39.
Mathematical Foundations of False Discoveries
The mechanics of data snooping have been mathematically formalized by David H. Bailey, Marcos López de Prado, and others through the False Strategy Theorem (FST). The FST provides the theoretical foundation for understanding multiple testing by quantifying how much the maximum expected Sharpe ratio among a set of unskilled strategies will exceed zero purely due to statistical chance 16.
The theorem proves that as the number of trials ($N$) increases, the expected maximum Sharpe ratio of a false strategy increases logarithmically, completely independent of any true predictive skill 1516. Consequently, the optimal outcome of historical simulations is right-unbounded. With enough computational trials, there is no historical Sharpe ratio sufficiently large to reject the null hypothesis that a strategy is overfit and destined to fail 16. It is guaranteed that a researcher will eventually discover a strategy with an annualized Sharpe ratio of 2.50 or higher simply by running a sufficient number of backtest permutations on random data 1540.
Memory Effects and Performance Degradation
Overfit financial models do not merely revert to a mean of zero performance out-of-sample; they often exhibit systematic, catastrophic losses. This phenomenon is driven by memory effects and serial correlation in financial time series. When an optimizer fits a model to a specific historical noise pattern, it inadvertently takes on hidden exposures to the specific risk factors that generated that noise 7.
When the market regime inevitably shifts, these over-calibrated exposures rapidly unwind. Studies show that portfolio returns for documented trading anomalies often decline significantly post-publication, with roughly half of that decline mathematically attributable to data-mining bias 7. As a result, performance degradation is not merely a failure to capture future alpha, but an active mechanism of capital destruction 3215.
Advanced Validation Methodologies
To mitigate overfitting, quantitative researchers must abandon simple static backtests and employ robust validation frameworks that penalize excessive parameter searching, constrain degrees of freedom, and test for true generalization.
Walk-Forward Analysis and Out-of-Sample Discipline
Considered the gold standard for time-series validation, Walk-Forward Analysis (WFA) dynamically divides the historical dataset into chronological, rolling windows of in-sample (training) and out-of-sample (testing) periods 74417.
In a standard WFA pipeline, a model is optimized on the initial training window (e.g., Year 1) and its parameters are temporarily locked. The strategy is then run on the immediate subsequent out-of-sample window (e.g., Year 2). The entire window then rolls forward: the model is re-optimized on Years 1-2, and tested blindly on Year 3, continuing this sequential progression 44. By concatenating the out-of-sample results from each step, researchers generate a continuous equity curve that authentically reflects how the model would have continuously adapted to unseen data in real-time 44. This methodology explicitly enforces information set discipline and prevents the optimizer from observing future states 717.
Combinatorially Symmetric Cross-Validation (CSCV)
While WFA is practically robust, it generates only a single out-of-sample path, limiting rigorous statistical inference. Furthermore, standard K-fold cross-validation, widely used in general machine learning, is heavily flawed when applied to financial time series. Standard K-fold randomizes data allocation, breaking the temporal precedence and serial correlation fundamental to market dynamics, thereby leaking future information into the training sets 1046.
Combinatorially Symmetric Cross-Validation (CSCV), developed by Bailey et al., addresses these specific limitations 7104418. CSCV partitions the historical time series into an even number of chronological slices. It then generates a vast number of testing sets by recombining these sequential slices in all possible permutations, ensuring that training and testing sets remain of equal size and respect time-dependence 1046.
By evaluating the strategy across these thousands of combinations, CSCV establishes a dense distribution of paired in-sample and out-of-sample performance metrics. This framework allows researchers to calculate the Probability of Backtest Overfitting (PBO) - a precise mathematical metric defining the likelihood that a strategy's superior in-sample rank is merely a statistical artifact. If the PBO exceeds 50%, the researcher's "best" strategy has worse than coin-flip odds of being genuinely profitable out-of-sample 104418.
Monte Carlo and Objective Function Design
Beyond chronological partitioning, advanced stress testing relies on Monte Carlo bootstrapping techniques. By resampling actual historical trade sequences without assuming independent and identically distributed (IID) returns, analysts can evaluate strategy robustness under thousands of execution scenarios that preserve the temporal structure and serial dependence of the trades 48.
Furthermore, modern algorithmic development emphasizes the use of composite objective functions to deter overfitting during the optimization process itself. Frameworks like the GT-Score integrate raw performance, statistical significance, consistency across sub-periods, and downside risk into a single optimization target 4249. By biasing the search algorithm away from fragile, high-return parameter peaks and toward robust, generalized parameter plateaus, the GT-Score materially improves out-of-sample performance retention 63649. Alternatively, researchers may fit parameters to the underlying time-series generation models (e.g., maximum likelihood estimation of an Ornstein-Uhlenbeck process) rather than optimizing trading thresholds directly, significantly reducing data snooping bias by utilizing a vastly larger dataset of price ticks rather than sparse trade counts 50.
Statistical Adjustments to Risk-Adjusted Returns
Deficiencies of the Standard Sharpe Ratio
The Sharpe ratio, defined as the annualized excess return divided by the standard deviation of returns, remains the ubiquitous benchmark for risk-adjusted performance in asset management 3416. However, its unadjusted application in quantitative backtesting is dangerously flawed when evaluating strategies derived from computational optimization.
The traditional Sharpe ratio rests on restrictive statistical assumptions derived from early Modern Portfolio Theory 4. Primarily, it assumes that asset returns are independent and identically distributed (IID) following a normal (Gaussian) distribution 31651. In reality, financial returns consistently exhibit fat tails (positive excess kurtosis) and asymmetry (negative skewness) 33951. Strategies that generate steady, incremental gains while harboring massive, infrequent downside risks - such as selling out-of-the-money options or highly levered mean-reversion - will produce a misleadingly high Sharpe ratio that completely conceals catastrophic tail risk 35152.
Second, the standard Sharpe calculation is invariant to the length of the track record. A Sharpe ratio of 2.0 achieved over six months carries vastly higher estimation uncertainty than a Sharpe ratio of 1.0 achieved over ten years, yet the raw mathematical output does not reflect this critical disparity in statistical confidence 43916.
Most critically, the standard Sharpe ratio is entirely blind to multiple testing 3916. A Sharpe ratio of 2.5 is highly significant if it is the result of a single, hypothesis-driven test. It is statistically meaningless if it is merely the maximum result harvested from a parameter sweep of 10,000 model variations 39.
The Probabilistic and Deflated Sharpe Ratios
To counter the systemic inflation of performance metrics, advanced statistical adjustments have been formalized, culminating in the Probabilistic Sharpe Ratio (PSR) and the Deflated Sharpe Ratio (DSR) 16.
The Probabilistic Sharpe Ratio adjusts the standard metric by directly incorporating the third and fourth moments of the return distribution. It recalculates the probability that the estimated Sharpe ratio exceeds a benchmark (typically zero) after penalizing the metric for negative skewness, excess kurtosis, and small sample sizes 43953. This successfully mitigates the "fat tail" illusion but does not solve the data snooping problem.
The Deflated Sharpe Ratio (DSR), developed by Bailey and López de Prado, addresses the totality of backtest overfitting 1652. The DSR calculates a severely penalized performance metric by explicitly accounting for the research process itself.
- Selection Bias: Utilizing the False Strategy Theorem, the DSR computes the expected maximum Sharpe ratio generated purely by the effective number of independent trials ($N$) attempted during the research phase 1652. The threshold for significance is elevated from zero to this expected maximum.
- Estimation Uncertainty: The DSR accounts for the variance of the Sharpe estimates across all trials, clustering correlated strategies to determine the true number of independent degrees of freedom explored by the researcher 16.
- Non-Normality and Length: The framework integrates the PSR adjustments, severely discounting strategies with non-normal downside risks and short track records 3916.
| Risk Metric | Core Assumptions | Primary Vulnerabilities | Mitigation / Adjustments |
|---|---|---|---|
| Standard Sharpe Ratio | Returns are Normal and IID. Single trial execution. | Blind to fat tails, short track records, and multiple testing 316. | Baseline metric; highly vulnerable to optimization illusions. |
| Probabilistic Sharpe Ratio (PSR) | Single trial execution. Accounts for higher moments. | Still vulnerable to selection bias from parameter sweeps 3953. | Adjusts confidence bands based on skewness, kurtosis, and sample $T$ 4. |
| Deflated Sharpe Ratio (DSR) | Accounts for multiple testing, non-normality, and sample length. | Computationally complex; reduces statistical power for massive search spaces 16. | Penalizes performance based on the number of trials ($N$) and strategy variance 4016. |
By applying the DSR, researchers establish a rigorous, elevated threshold for alpha generation. For example, an optimized algorithmic strategy might yield an apparent raw Sharpe ratio of 2.50. However, once the DSR corrects for the fact that the researcher ran 1,000 backtest iterations on non-normal returns, the adjusted, statistically valid metric might collapse to an equivalent Sharpe of 0.30 - indicating that the strategy lacks genuine predictive edge and is a product of data snooping 39. The application of DSR ensures that the probability of a false discovery in data-mined environments is rigorously controlled, separating robust empirical findings from statistical flukes 414216.
Conclusion
The pursuit of systemic, uncorrelated alpha in financial markets relies inextricably on historical simulation. Yet, backtesting is an epistemologically fragile process susceptible to profound distortions. Survivorship bias engineers an illusion of safety by erasing the historical presence of corporate failure, leading to severe underestimations of market volatility. Look-ahead bias weaves future knowledge into past decisions via publication lags and restatements, generating impossible historical foresight. Finally, even when data integrity is perfectly maintained via point-in-time architecture, the sheer computational capacity of modern parameter optimization guarantees that statistical noise can be manipulated to resemble predictive signal, leading to backtest overfitting.
Protecting quantitative capital requires an aggressive, adversarial approach to model validation. Practitioners must assume that all unadjusted backtests are systematically biased toward optimism. Deploying survivorship-free databases, enforcing strict point-in-time constraints, implementing walk-forward and combinatorially symmetric cross-validation, and rigorously deflating performance metrics to account for multiple testing are not optional refinements. They are mandatory technical barriers required to ensure that a quantitative strategy represents a genuine structural market inefficiency rather than a perilous artifact of flawed historical observation.