When Does Compound Interest Start to Pay Off
Compound interest fundamentally alters a financial trajectory when a portfolio reaches its "crossover point" - the exact mathematical threshold where annual investment returns surpass yearly out-of-pocket contributions. For most consistent savers, this tipping point typically occurs when the total portfolio balance reaches ten to fifteen times their annual savings rate. Beyond this juncture, the portfolio's self-generated growth overtakes human labor as the primary engine of wealth creation, shifting the math from linear savings to exponential accumulation.
The Cognitive Dissonance of Early Wealth Accumulation
Human beings are naturally wired to think in linear increments. If an individual walks ten paces, they expect to travel ten paces forward. If a saver puts away $1,000 every month, their brain intuitively expects to be exactly $12,000 wealthier after one year, and $120,000 wealthier after a decade. This linear expectation is precisely why the early years of investing often feel profoundly frustrating and unrewarding for retail investors. In the initial accumulation phase, the individual is doing all the heavy lifting, while the financial markets seem to be offering only pennies in return.
Compound interest, however, operates on an exponential curve. In financial terms, compound interest is the process of earning a return on an original principal amount, and then subsequently earning returns on those accumulated returns in perpetuity 11. It is the financial equivalent of a snowball rolling down a mountain, gathering mass not just from the fresh snow packed onto it, but from the ever-expanding surface area of the snow it has already collected.
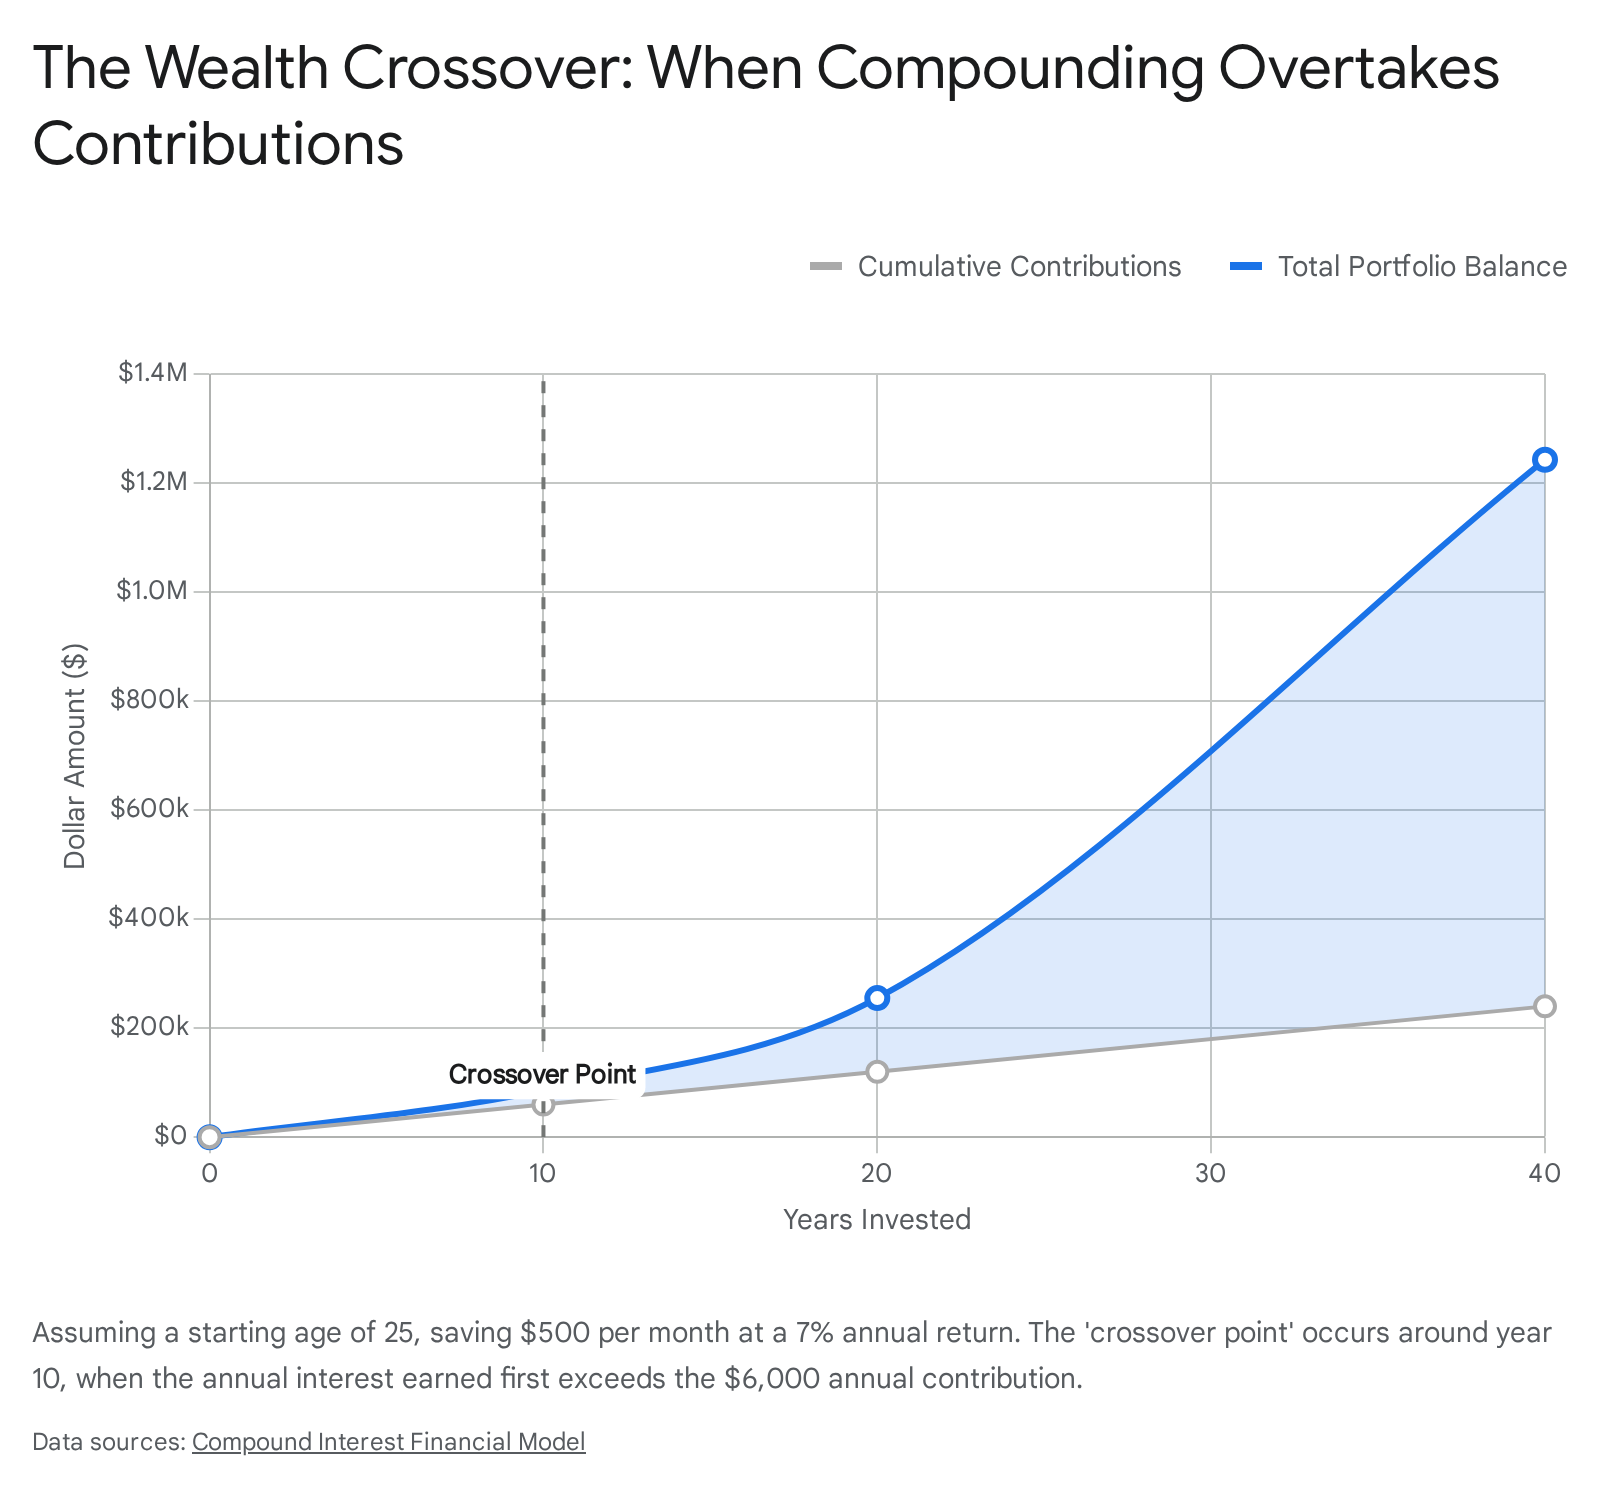
When an investor first enters the market, their principal is simply too small for the interest rate to generate any meaningful momentum. For example, if an individual starts from zero and invests $1,000 a month at a 7% annual return, it takes roughly a decade to accumulate a total balance of $165,800 2. At first glance, crossing the six-figure mark appears to be a monumental success. However, looking under the hood reveals that $120,000 of that total came directly from the investor's own paycheck 2. The money is not yet working harder than the individual; the investor is still manually dragging the portfolio up the hill.
The transformative power of compounding does not reveal itself as a gradual easing of the burden. Instead, it reveals itself suddenly. There is a precise, mathematically verifiable moment when the heavy lifting permanently shifts from the investor's labor to their accumulated capital. In financial planning communities, this critical milestone is known as the crossover point.
Defining and Calculating the Crossover Point
The crossover point is not an abstract concept, a subjective feeling of wealth, or a generic milestone like reaching a million dollars. It is a single, straightforward division problem. The crossover point is calculated by dividing an individual's annual savings contribution by their expected annual rate of return 35.
When a total investment balance surpasses this specific quotient, the portfolio officially begins to generate more capital per year than the investor contributes to it 3.
The mathematics fundamentally shift from the investor pushing the money forward, to the money pulling itself forward 3.
Consider the median American household as an example. According to data from the Bureau of Economic Analysis, the United States personal savings rate occasionally hovers around 4% of income. For a household earning the 2024 median income of roughly $83,730, a 4% savings rate equates to an annual retirement contribution of about $3,349 3. If that household models an 8% long-term return on their diversified investments, their crossover point is $41,863. The very moment their retirement account hits $41,863, the 8% average market return will generate roughly $3,349 a year, perfectly matching their personal effort 3.
However, this formula reveals a dynamic that is perfectly linear yet deeply counterintuitive: the more aggressively a person saves, the higher their crossover point becomes 34. Because their manual contributions are so large, the portfolio must grow to a much larger baseline before its percentage-based returns can outpace those massive cash injections 34.
This reality creates a profound psychological trap for high-income earners and extreme savers. An individual who saves $100,000 a year might look at their $1 million investment portfolio and feel as though they have achieved financial independence 3. However, at an 8% growth rate, a $1 million portfolio only generates $80,000 in returns. Therefore, their $100,000 cash contribution remains the primary engine of their wealth creation. For an extreme saver, reaching the point where their money actually outearns their labor requires staggering patience and a massive capital base 3.
Required Portfolio Balances to Reach the Crossover Point
The following table illustrates the exact portfolio balance required to reach the crossover point across various savings profiles, assuming a moderately aggressive 8% long-term annual return.
| Annual Savings Contribution | Expected Annual Return | Portfolio Crossover Point |
|---|---|---|
| $3,349 (Median US Saver at 4%) | 8.0% | $41,863 |
| $10,048 (Average 12% 401k Saver) | 8.0% | $125,600 |
| $20,000 (Aggressive Saver) | 8.0% | $250,000 |
| $50,000 (High-Income Saver) | 8.0% | $625,000 |
| $100,000 (Extreme Saver) | 8.0% | $1,250,000 |
The Mathematics of Frequency and Euler's Number
To truly understand why the crossover point acts as a financial fulcrum, it is necessary to examine the mathematical mechanics that govern how interest is applied. The standard compound interest formula dictates that the future value of an investment equals the principal amount multiplied by one plus the annual interest rate divided by the compounding frequency, with that entire sum raised to the power of the compounding frequency multiplied by time 1.
A pervasive misconception among retail investors is that the frequency of compounding - whether a financial institution calculates and applies interest daily, monthly, or annually - will drastically alter their long-term wealth accumulation 7. Consumer marketing materials often tout "daily compounding" as a massive competitive advantage for high-yield savings accounts or specific debt instruments. The mathematical reality, however, is far less dramatic.
When the frequency of compounding increases, the final yield does technically increase, but these returns face severe diminishing marginal utility 5. If an individual invests $10,000 at a 5% annual rate for exactly ten years, an account that compounds annually will yield a final balance of $16,288.95 6. If that individual switches to an account that compounds monthly, the final balance rises to $16,470.09 6. If they locate a rare account that compounds daily, the balance creeps up to $16,486.65 7. Over a full decade of compounding, the difference between a standard monthly schedule and an aggressive daily schedule is a mere sixteen dollars.
Diminishing Returns of Compounding Frequency
The following table demonstrates the rapidly diminishing impact of compounding frequency on a $100,000 initial deposit held for 10 years at a static 5% annual interest rate.
| Compounding Frequency | Final Balance After 10 Years | Percentage Increase from Principal |
|---|---|---|
| Annual (1x per year) | $162,899 | 62.9% |
| Semi-Annual (2x per year) | $163,862 | 63.9% |
| Quarterly (4x per year) | $164,362 | 64.4% |
| Monthly (12x per year) | $164,701 | 64.7% |
| Daily (365x per year) | $164,866 | 64.9% |
| Continuous (Infinite) | $164,872 | 64.9% |
This mathematical limitation is tethered to one of the most famous constants in advanced mathematics: Euler's number, denoted as e 7. If a hypothetical financial institution were to offer a 100% interest rate and continuously compound that interest an infinite number of times per year, the account balance would not grow to infinity. The limit of that continuous compounding equation converges perfectly on e, meaning the initial capital would multiply by approximately 2.71828 after one year, and absolutely no further 118.
The practical lesson for investors is that while the underlying mathematics of compounding frequency are elegantly complex, the ultimate driver of wealth is not how often the interest is calculated. The true drivers are the gross rate of return and, most importantly, the sheer length of time the capital is allowed to sit uninterrupted 56.
The Psychological Milestones of the Wealth Journey
Because compound interest requires vast stretches of time to take meaningful effect, investors must rely on a series of psychological milestones to stay the course. The journey from zero to financial independence is generally categorized into several distinct phases, each defined by the shifting ratio of human effort to market growth.
The First $10,000: The Grind Phase
At this initial stage, compounding is entirely invisible to the naked eye. If an investor has $10,000 deployed in the market and achieves a historically average 7% return, they earn $700 over an entire year. Conversely, if they skip a few meals out or take on a brief side project, they can save $700 in a single month. At this point, extreme frugality and active income generation completely dominate financial progress. The market's performance is practically irrelevant compared to the individual's baseline savings rate.
The First $100,000: The Illusion of Momentum
Hitting six figures is widely celebrated as a massive emotional milestone, but mathematically, it is largely an illusion built on the investor's own sweat equity 4. If an individual is aggressively saving $20,000 a year, it will take them roughly four to five years of disciplined contributions to reach $100,000. In a 7% market, that $100,000 portfolio generates $7,000 a year 4. The investor's $20,000 contribution is still doing nearly three times as much work as their investments. They remain the primary engine of their own wealth 49.
The $300,000 to $500,000 Zone: Reaching Crossover
For most upper-middle-class savers who are maximizing their tax-advantaged retirement accounts, this half-million-dollar zone is where the mathematics quietly flip. If an investor has $300,000 invested, a 7% return yields $21,000 in capital appreciation 49. If that same investor is contributing $20,000 a year, they have officially reached their crossover point.
From this day forward, market returns will regularly outpace paycheck contributions. In a particularly strong year where the broader market returns 20%, the portfolio will jump by $60,000 - an amount that might rival the investor's actual take-home salary from their primary occupation 4. This is the phase where the accumulation of wealth transitions from feeling like a struggle to feeling like an inevitability.
The $1 Million Mark: Escape Velocity
At $1 million invested, a conservative 7% historical return yields $70,000 a year. If the investor is still contributing their usual $20,000, their personal effort has been reduced to a mere supporting role 24. The money is now generating a median American salary entirely on its own. At this stage, trying to boost net worth by clipping coupons, cutting out coffee, or skipping vacations is financially meaningless; the portfolio's routine daily fluctuations will easily eclipse months of strict household budgeting. Compounding has fully taken control of the financial trajectory.
Coast FIRE and the Danger of Wealth Shocks
Understanding the exact location of the crossover point is the foundation of a modern financial strategy known as Coast FIRE (Financial Independence, Retire Early) 249.
The traditional model of retirement assumes that a worker must save a set percentage of their income every single month from age 25 until age 65. Coast FIRE, however, relies on the aggressive, front-loaded acceleration of the crossover point. If an investor can live exceptionally frugally and save massive amounts of capital in their twenties and thirties, they can reach their personal crossover point decades ahead of schedule 24.
Once they hit this threshold - for example, accumulating $250,000 by age 32 - they can theoretically halt all future contributions to their retirement accounts 9. Because the portfolio has reached critical mass, the isolated force of compounding will carry that $250,000 to over $1.5 million by traditional retirement age, even without another dime added. The investor can then "coast" into a lower-paying, lower-stress job, secure in the knowledge that their retirement is fully funded by the mathematical certainty of compound interest 49.
However, purposefully stopping contributions at the crossover point carries profound systemic risk. It leaves zero room for error in the sequence of returns 2. If a sudden medical emergency, prolonged unemployment, or severe disability forces the investor to liquidate portions of that portfolio prematurely, they break the compounding chain and shatter the Coast FIRE mathematical model 2.
These risks are not merely theoretical. Longitudinal data from the US Health and Retirement Study (HRS) spanning 1995 to 2020 highlights the prevalence of "negative wealth shocks" in middle-to-later life, defined as an individual losing 75% or more of their total equivalized household wealth over a short period 10. Such severe drawdowns, whether caused by medical bankruptcy or divorce, can permanently derail a compounding curve. Furthermore, advanced machine learning analyses of the Survey of Consumer Finances indicate that high levels of home-secured mortgage debt and elevated debt-to-income ratios are massive predictors of retirement under-saving, often forcing individuals to raid their equity prematurely 15. Consequently, financial planners universally advise treating the crossover point as a psychological milestone rather than an immediate cue to stop saving entirely 2.
The Silent Thief: How Inflation Alters the Crossover Timeline
When modeling the mathematics of compound interest, digital calculators inherently rely on nominal returns - the raw, unadjusted percentage increase of the portfolio. But nominal wealth is a dangerous illusion if the core cost of living rises at a faster pace. Inflation acts as the ultimate friction that drags on the compounding curve, silently stealing purchasing power over the decades 1611.
If a portfolio achieves a 7% nominal return in a year where inflation runs at 6%, the investor's "real" return - the actual increase in their ability to buy real-world goods and services - is essentially flat, and likely negative after accounting for capital gains taxes and fund management fees 11.
Between 2020 and 2025, global markets provided a brutal masterclass in how rapid inflation can disrupt long-term financial planning and push crossover points further over the horizon. Cumulative inflation over this five-year window reached staggering levels worldwide. In Argentina, sweeping currency devaluation and unconventional monetary policy caused consumer prices to surge by 2,614% 12. In Turkey, prices jumped 464% 12.
Even in highly stable, developed economies, the damage to accumulated purchasing power was severe. In the United States, cumulative inflation between 2020 and 2025 reached 23% 12. In the United Kingdom, it hit 24%, and in Germany, it climbed to 22% 12. A conservative saver who kept their money in a traditional checking account during this half-decade permanently lost nearly a quarter of their life's accumulated financial energy.
Retail Investor Misconceptions and the Equity Hedge
Navigating this inflationary friction requires holding assets that naturally appreciate alongside consumer prices. Unfortunately, retail investors often misunderstand this dynamic. A 2022 survey of German bank clients, conducted precisely when regional inflation hit a 30-year high of 5.3%, revealed deep confusion about asset classes. About half of the active investors surveyed incorrectly assumed that nominal returns for the stock market would automatically be lower during periods of high inflation, prompting many to reduce their equity exposure exactly when they needed it most 13.
Despite terrifying short-term spikes in consumer prices, historical data firmly suggests that long-term investors who stay fully allocated to diversified equities generally outpace inflation 14. A comprehensive historical study by Dimensional Fund Advisors analyzed the performance of the S&P 500 against U.S. inflation over an extensive timeline. They found that since 1926, the S&P 500 has posted an annualized return of roughly 7.0% strictly after adjusting for the destructive impact of inflation 14.
This 7% real return is the holy grail of financial planning. It indicates that despite world wars, great depressions, and modern inflationary spikes, capital deployed into the broader market has reliably doubled its true, inflation-adjusted purchasing power roughly every decade. While fixed-income assets and cash bleed value during high inflation, equities representing real companies tend to hold their value because those underlying businesses simply raise their prices to absorb the inflation, eventually passing those inflated revenues back to the shareholders 11.
For investors, the lesson is clear: calculating a true crossover point requires using an estimated real return, not a nominal one. If an individual expects the market to return 10% nominally, but expects inflation to average 3%, they must run their compound interest calculations using a 7% expected return to ensure their future wealth actually affords the lifestyle they are planning for.
Global Systems: How Geography Dictates Your Compounding
The ability to reach the crossover point is not purely a matter of personal discipline and financial literacy; it is heavily dictated by the structural design of the country in which an investor resides. Global governments understand the macroeconomic power of compound interest, and they have designed widely varying tax frameworks and labor laws to either encourage, trick, or force their citizens onto the compounding curve.
Comparing the retirement systems of the United States, Australia, and the United Kingdom reveals drastically different philosophies on how to push workers toward their crossover points.
The United States: The Voluntary 401(k) Model
The American 401(k) system is fundamentally voluntary and heavily reliant on free-market flexibility 21. Employees must actively choose to participate, determine their own contribution rates, and select their own investments from a curated menu provided by their employer 1523. While the IRS allows generous pre-tax and Roth contributions - up to $23,500 in 2025, with expanded catch-up contributions for older workers delayed by the SECURE 2.0 Act until 2026 - the lack of compulsion leaves millions of citizens entirely behind 15.
By early 2025, roughly 28% of private industry workers in the U.S. were not even offered a retirement plan by their employers 23. Among those who are offered a 401(k), participation is never guaranteed. To incentivize workers, U.S. employers frequently offer matching contributions, which essentially acts as free capital that massively accelerates the employee's crossover point. However, outside of specific Safe Harbor plans designed to pass IRS non-discrimination testing, employers are not legally obligated to provide a match 152416.
Australia: The Compulsory Superannuation Engine
Australia takes a highly paternalistic approach to compound interest through its Superannuation (or "Super") system. Since 1992, the Australian government has mandated that employers contribute a set percentage of their employees' ordinary earnings directly into a retirement fund, regardless of whether the employee contributes a single cent themselves 2126.
As of July 2025, this mandatory Superannuation Guarantee (SG) rate stands at 12% 211526. This means every working Australian has a legally enforced compounding engine running in the background of their economic life 2123. Because the contributions are mandatory, the vast majority of Australian workers will inevitably hit their mathematical crossover point simply by remaining continuously employed.
However, this robust system is not without friction. The Australian model is frequently criticized for its high administrative costs, regulatory complexity, and embedded fees that quietly eat into the compounding rate of return 21. Furthermore, the Australian government uses the Super system as a dynamic revenue lever, taxing contributions at 15% on the way in, and implementing Division 293 and proposed Division 296 taxes that heavily penalize the compounding returns of high-net-worth accounts containing over $3 million 23.
The United Kingdom: The Auto-Enrollment Compromise
The United Kingdom sits firmly between the laissez-faire U.S. approach and the compulsory Australian model. Over the last decade, the UK completely revolutionized its defined contribution landscape by mandating widespread "auto-enrollment" 1627. Employers must automatically enroll eligible staff into a qualifying pension scheme, though employees retain the legal right to explicitly opt out 1627.
The UK system relies heavily on the principles of behavioral economics: by making participation the default state rather than an active choice, human inertia ensures that most people stay invested and begin building their compounding curve 27. Furthermore, UK residents utilizing Self-Invested Personal Pensions (SIPPs) benefit from massive tax relief, where the government actively tops up individual contributions based on the saver's income tax bracket, and retirees are permitted to withdraw up to 25% of their total pot as a completely tax-free lump sum starting at age 55 (rising to 57 in 2028) 24272829.
Structural Comparison of Global Compounding Vehicles
| System Feature | US 401(k) | Australian Superannuation | UK Pension (DC / SIPP) |
|---|---|---|---|
| Participation Logic | Voluntary (Employers may opt to auto-enroll) | Mandatory for all eligible workers | Auto-enrollment mandated by law, but employees may opt out |
| Employer Role | Discretionary matching (unless Safe Harbor) | Legally required 12% contribution (as of July 2025) | Legally required minimum contributions under auto-enrollment |
| Access Age | Generally 591⁄2 (10% penalty for early withdrawal) | Preservation age (usually 60) | Currently 55 (rising to 57 in 2028) |
| Tax on Growth | Tax-deferred until withdrawal (or tax-free if Roth) | Taxed at 15% (Proposed higher taxes for balances > $3M) | Tax-free growth |
Bottom line
Compound interest transitions from a theoretical mathematical concept to a life-altering reality the moment a portfolio reaches the crossover point - the threshold where investments generate more annual return than the investor's yearly out-of-pocket contributions. While the exact timeline to reach this point depends entirely on an individual's savings rate and market returns, crossing this milestone permanently shifts the burden of wealth creation from daily labor to accumulated capital. However, to ensure this wealth is tangible and capable of supporting early retirement strategies like Coast FIRE, investors must stay vigilant against the silent erosion of inflation by targeting real returns, while maximizing the unique tax-advantaged retirement frameworks available in their specific geographic region.