What Is Feature Engineering in Quantitative Trading
Feature engineering in quantitative trading is the process of mathematically transforming raw, chaotic market data - such as tick-by-tick prices, trading volumes, and textual news - into structured, predictive signals that algorithmic models can understand. It acts as the critical bridge between noisy financial environments and profitable trading strategies, filtering out random market fluctuations to expose the underlying economic mechanics that drive asset prices.
The Fundamental Barrier of Market Noise
To comprehend why quantitative researchers dedicate the majority of their time to feature engineering rather than algorithm selection, one must first understand the fundamental nature of financial markets. Financial data is characterized by an exceptionally low signal-to-noise ratio. Unlike image recognition or natural language processing, where the data generating process is relatively stable and the rules of the system are fixed, financial markets are highly stochastic, evolving, and reflexively driven by human psychology and institutional constraints. The true predictive information - the signal - is largely obscured by the random daily fluctuations of millions of interacting participants, known as the noise 12.
Feeding raw market data, such as a historical sequence of closing stock prices, directly into a sophisticated deep learning model is a recipe for catastrophic failure. Algorithms do not innately understand the concept of a market, an economy, or a company. When presented with raw price time-series data, advanced neural networks, owing to their vast parameter counts, will inevitably memorize the historical noise rather than uncover repeatable market mechanics 134. This phenomenon leads to models that appear highly profitable during backtesting but immediately lose capital when deployed in live trading environments.
Furthermore, financial data is profoundly non-stationary. The statistical properties of a given asset - its mean, variance, and correlation with other assets - do not remain constant over time 25. Financial markets experience violent regime shifts triggered by macroeconomic policy changes, geopolitical shocks, and evolving regulatory frameworks. A raw price pattern that successfully predicted equity returns during a decade of zero-interest-rate monetary policy will likely behave completely differently during an inflationary tightening cycle. Without the intervention of feature engineering to extract stable, stationary representations of the data, predictive models are fundamentally blind to these structural breaks 1.
Feature engineering acts as the essential refinery in this quantitative pipeline.
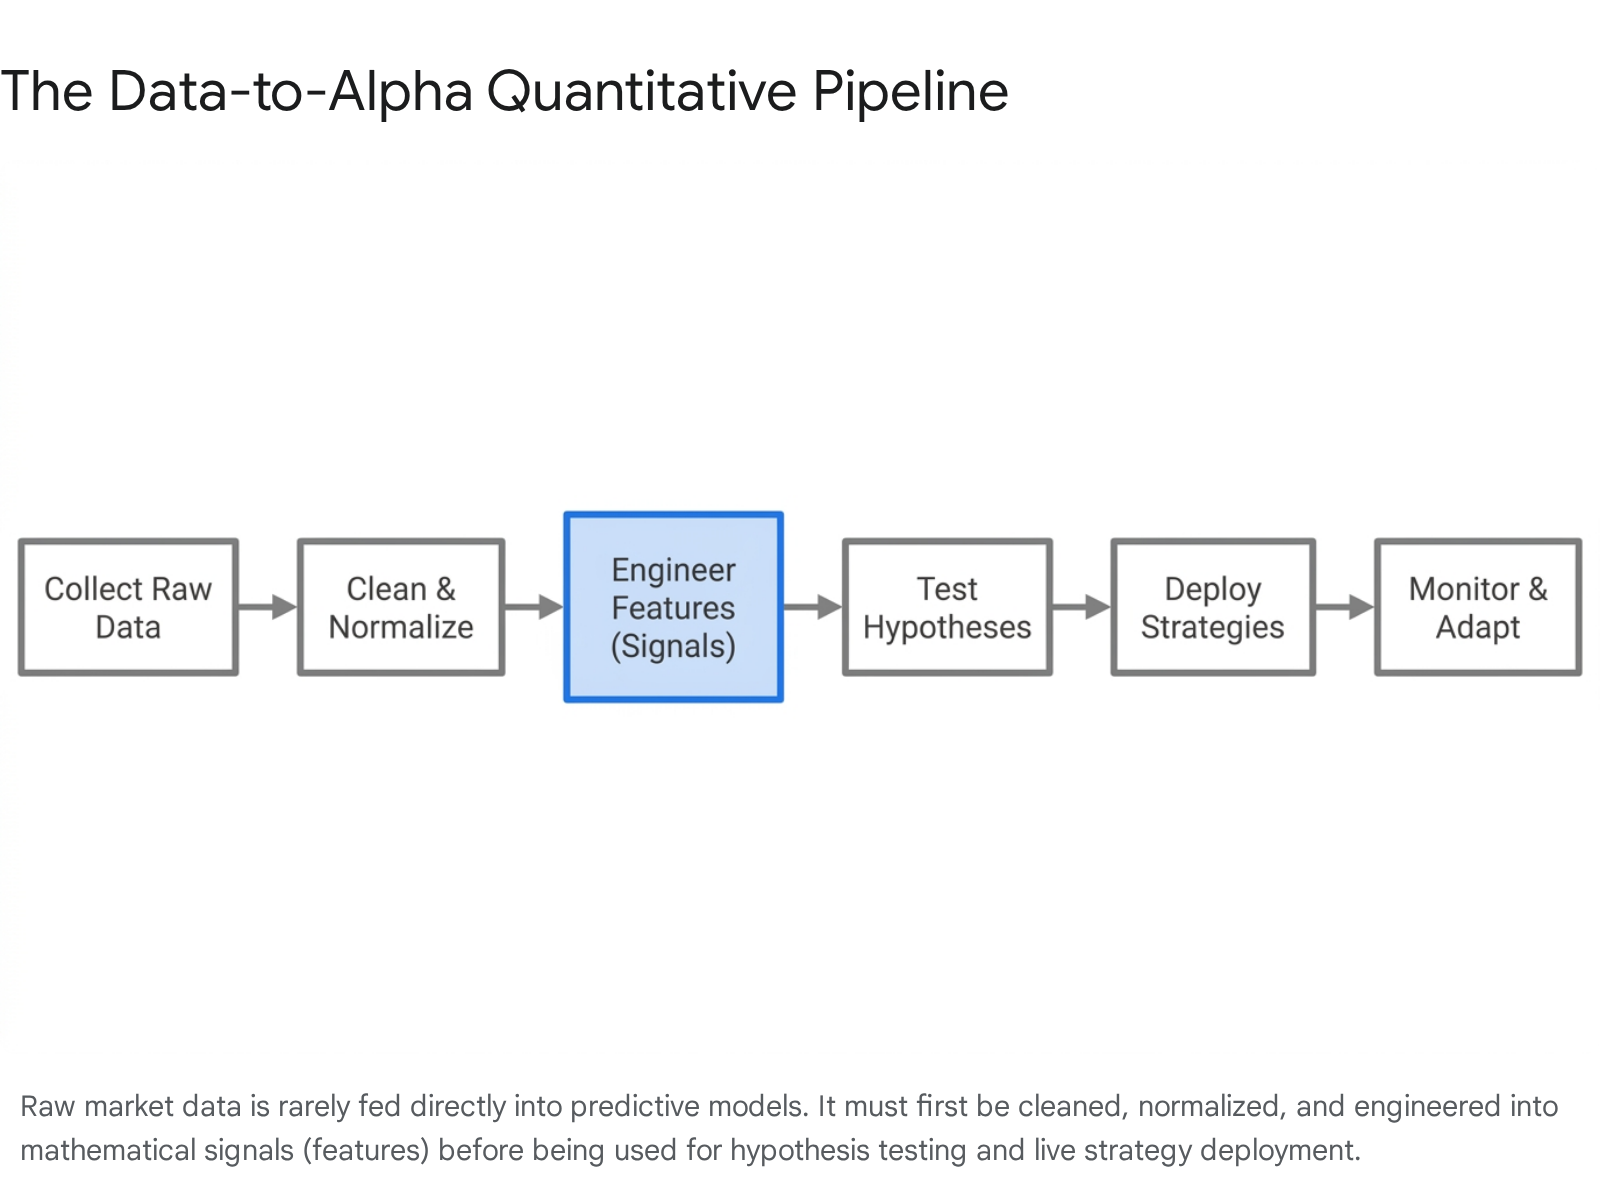
If raw financial data is the crude oil extracted from global exchanges, feature engineering is the complex distillation process required to produce the high-octane fuel that powers machine learning algorithms 6. By transforming raw variables into engineered features, quantitative analysts provide algorithms with the economic context required to detect genuine anomalies, momentum, and mean reversion in a chaotic ecosystem.
The Mathematical Foundation: Rethinking Returns
The first and most foundational step in engineering features for quantitative trading involves abandoning raw prices entirely. Prices themselves have no natural mathematical boundary or "zero point," rendering them highly problematic for statistical modeling 7. A stock priced at one hundred dollars does not intrinsically hold a different predictive value than a stock priced at ten dollars; what matters to a portfolio manager is the proportional change in capital over time.
However, even simple percentage returns - the standard metric used by retail investors and the broader financial media - present significant mathematical hurdles for algorithmic feature engineering. If a stock falls by fifty percent, it must subsequently rise by one hundred percent just to return to its original value. This asymmetry creates highly skewed distributions that violate the core assumptions of many statistical machine learning models 81.
To solve this, quantitative researchers predominantly convert raw prices into logarithmic returns. The log return is calculated as the natural logarithm of the current price divided by the previous price. This mathematical transformation is not a mere academic preference; it is a structural necessity for building robust trading features. Log returns provide statistical stability, as they naturally conform more closely to a normal or log-normal distribution, which is a prerequisite for advanced econometric analysis and volatility modeling 81.
More importantly, log returns are time-additive. If a quantitative strategy requires analyzing the return of an asset over a one-month horizon, the total return can be calculated by simply summing the daily log returns across that period. This property of continuous compounding drastically reduces the computational complexity required to process vast arrays of historical data compared to multiplying discrete simple returns 82. This additivity also ensures that the feature space is mathematically symmetric; a positive log return of a given magnitude perfectly cancels out a negative log return of the same magnitude, providing a balanced landscape for neural networks and gradient boosting algorithms to navigate 11.
In systems utilizing modern reinforcement learning to optimize portfolio allocations, engineering the algorithm's reward function using simple returns often encourages the agent to take excessive, destabilizing risks 11. Defining the reward signal via per-step log returns ensures the model scales its understanding of risk correctly, penalizing severe drawdowns appropriately and stabilizing the machine learning training environment against extreme outliers 11.
| Feature Metric | Mathematical Formulation | Primary Engineering Advantage | Quantitative Limitations |
|---|---|---|---|
| Simple Return | $(P_t - P_{t-1}) / P_{t-1}$ | Easy to interpret; accurately reflects discrete portfolio growth and aggregated cross-sectional weights. | Asymmetrical compounding; bounded at -100%; highly skewed statistical distributions 812. |
| Logarithmic Return | $\ln(P_t / P_{t-1})$ | Time-additive (can be summed over periods); mathematically symmetric; normalizes compounding effects. | Difficult to aggregate across a portfolio of multiple assets simultaneously 812. |
| Trailing Volatility | Standard Deviation of Returns | Quantifies historical risk and dispersion; essential for scaling position sizes dynamically. | Inherently backward-looking; slow to adapt to sudden, explosive market regime shifts 812. |
Architecting Predictive Features from Time Series Data
With the foundational mathematical transformations established, quantitative analysts construct massive libraries of predictive features designed to capture specific market dynamics. These features generally fall into several distinct categories based on the time horizon of the trading strategy and the underlying economic rationale they attempt to exploit.
Price Action and Momentum Indicators
The most ubiquitous engineered features are derived entirely from historical price and volume time series. Quantitative models rely heavily on these engineered inputs to identify the basic psychological and mechanical forces of the market: namely, momentum and mean reversion 7. By shifting from raw prices to price deltas and lags, engineers provide the algorithm with a sequential "memory" of market behavior 4712.
Momentum features attempt to capture the empirical reality that assets exhibiting strong recent performance tend to continue outperforming in the near term. Quants engineer these features by calculating trailing returns over multiple time horizons - such as one-month, three-month, and twelve-month periods - often deliberately excluding the most recent week or month to avoid capturing short-term mean-reverting liquidity shocks 13.
Conversely, mean reversion features are engineered to exploit temporary dislocations in asset prices. Short-term lags, such as one-day or five-day returns, often negatively predict the subsequent day's return due to market microstructure dynamics and the temporary absorption of large institutional block trades 13. To smooth out this intraday noise and reveal the true underlying trend, feature engineers rely heavily on rolling mathematical averages, predominantly the Simple Moving Average (SMA) and the Exponential Moving Average (EMA). While the SMA weights all historical data points equally within a specific window, the EMA applies an exponentially decaying weight, allowing the feature to react far more rapidly to sudden, contemporary price shifts 12.
Oscillators and Volatility Metrics
Beyond simple directional trends, algorithms require features that contextualize the speed and extremity of price movements. The Relative Strength Index (RSI) is a classic engineered feature used to measure the velocity of price changes, mathematically assessing whether an asset is in a technically overbought or oversold state by comparing the magnitude of recent gains against recent losses over a standardized period 14. By normalizing these movements onto a bounded scale from zero to one hundred, the RSI provides a stable input format that neural networks process with high efficiency.
Similarly, algorithms must dynamically adjust their risk-taking based on market turbulence, requiring robust volatility features. Features such as trailing standard deviations, Bollinger Bands, and the Average True Range (ATR) teach the model about the historical and expected dispersion of price movements 121415. Bollinger Bands, for instance, engineer a dynamic upper and lower volatility threshold around a moving average. When raw prices pierce these statistically engineered bands, it provides a powerful, mathematically normalized signal to the machine learning model that a breakout or exhaustion event is occurring 1214.
In highly advanced deep learning applications, such as Convolutional Neural Networks (CNNs), feature engineers occasionally abandon tabular data entirely. Instead, they reshape historical time series, technical indicators, and volatility metrics into multi-dimensional, image-like matrices 5. In this creative process, an asset's data over a fifty-day period might be transformed into a fifty-by-fifty pixel grid, where pixel intensity represents normalized indicator values. This allows the spatial pattern-recognition capabilities of CNNs - originally designed to identify faces and objects in photographs - to "see" complex, non-linear market structures that classical regression models cannot detect 56.
The Microstructure Frontier: Limit Order Books
While moving averages and momentum metrics serve medium-frequency equity and commodity strategies, high-frequency trading (HFT) and execution algorithms operate in an entirely different reality. These systems rarely ingest daily or even minute-by-minute closing prices. Instead, feature engineering at the microsecond level relies almost exclusively on the Limit Order Book (LOB) - the continuous, real-time ledger of all outstanding bids from buyers and asks from sellers 1617.
A Limit Order Book is a chaotic, rapidly updating stream of messages representing the true micro-level supply and demand of an exchange. To a machine learning model, the raw message queue is impossibly noisy. High-frequency quants must engineer features that compress this queue into actionable, predictive signals about short-term price direction 16.
Engineering Order Book Imbalance
The premier engineered feature in high-frequency trading is Order Book Imbalance (OBI). The OBI mathematically quantifies the disparity between buying interest and selling interest at the very top of the market. It is typically defined as the normalized difference between the resting volume at the best bid and the resting volume at the best ask 1718.
By dividing the difference in volume by the total volume at the best bid and ask, engineers create a mathematically elegant feature strictly bounded between negative one and positive one 18. If the OBI value approaches positive one, there is an overwhelming wall of buy orders relative to sell orders; if it approaches negative one, sellers dominate the queue.
This single feature allows algorithms to predict imminent, short-term price reversals caused by temporary liquidity voids 1920. Empirical academic studies consistently confirm that order flow imbalances display a strong linear relationship with subsequent tick-level price changes 17. A sophisticated market-making algorithm utilizes this engineered feature to adjust its quoting behavior dynamically. If a massive positive imbalance appears, signaling immense buying pressure, the algorithm can instantly skew its own quotes higher, capturing the spread before the broader market price physically moves 1920.
The Nuances of Market Making Features
High-frequency feature engineering extends far beyond simple imbalance. Market-making algorithms, which provide liquidity by simultaneously quoting both bids and asks to capture the spread, rely on intricate features rooted in inventory management and stochastic calculus. According to frameworks like the Avellaneda-Stoikov model, an algorithm must continuously engineer a "reservation price" - a theoretical fair value that dynamically adjusts away from the market mid-price based on the algorithm's current accumulated inventory and the market's real-time volatility 20.
If an algorithm has accumulated too much long inventory, the engineered reservation price immediately lowers, signaling the model to drop its asking price to offload the risk 20. Furthermore, features such as the Volume-Synchronized Probability of Informed Trading (VPIN) are engineered to warn the algorithm when order flow is likely driven by institutional players acting on non-public information, prompting the model to widen its spread to avoid adverse selection 20. In strict First-In-First-Out (FIFO) exchange environments, a predictive signal is utterly useless if the algorithm's order sits at the back of a massive queue. Therefore, modern microstructure features actively encode estimated queue position and latency metrics directly into the predictive state matrix 18.
The Rise of Alternative Data and Unstructured Features
The modern battlefield for quantitative advantage has expanded far beyond the highly structured confines of limit order books and price histories. The most significant growth in the industry over the last five years has been the institutional integration of "alternative data." This encompasses a vast, rapidly expanding universe of unstructured and semi-structured information that does not originate from traditional financial exchanges 2122.
The scale of alternative data is staggering. It includes real-time satellite imagery tracking the number of cars in retail parking lots or the shadows of oil storage tanks to estimate global supply 2324. It encompasses aggregated credit card transaction receipts, real-time social media sentiment feeds, global supply chain shipping logs, and the subtle linguistic shifts hidden deep within corporate earnings transcripts and regulatory filings 2224. By 2025, the global alternative data market was valued at over seven billion dollars, underscoring the massive capital deployment toward non-traditional feature extraction 24.
The fundamental challenge with alternative data is its unstructured nature. Algorithms rely on matrices of numbers, not photographs of container ships or thousands of pages of text. Therefore, quantitative researchers must utilize advanced feature engineering to quantify qualitative reality, translating the chaos of the physical and digital world into structured, tabular formats that predictive models can seamlessly ingest 1223.
For decades, transforming textual data into trading features was a brittle, labor-intensive process. Researchers relied on dictionary-based natural language processing (NLP) rules to extract "sentiment scores." They would meticulously curate lists of positive and negative financial terms, instructing a computer program to count the occurrences of these specific words within a document 2325. The ratio of positive to negative words became the engineered feature. While this rudimentary approach provided some marginal predictive edge, it was fundamentally flawed; it failed to grasp irony, context, negation, and complex financial causality.
The Large Language Model Revolution
The introduction and rapid proliferation of Large Language Models (LLMs) has initiated a paradigm shift in how quantitative funds engineer features from alternative data. Rather than relying on simple keyword frequencies, LLMs allow researchers to extract deeply contextual, semantically rich features from massive troves of unstructured text 2325.
State-of-the-art models like BloombergGPT and open-source alternatives like FinGPT are fine-tuned explicitly on billions of tokens of financial news, SEC filings, and corporate communications 25. These models do not merely read text; they comprehend financial reasoning. An LLM can analyze a real-time earnings call and output a mathematically robust feature vector that accurately represents the executive team's forward-looking confidence regarding specific supply chain bottlenecks, seamlessly accounting for the nuanced corporate speak that traditional NLP systems misinterpret 2223.
| Feature Extraction Methodology | Analytical Mechanism | Strengths | Critical Weaknesses |
|---|---|---|---|
| Traditional Rule-Based NLP | Counts predefined dictionary keywords (e.g., "growth", "loss") to calculate simple sentiment ratios. | Extremely fast execution; highly transparent and easily auditable logic. | Cannot understand context, sarcasm, or negation; requires manual updating of dictionaries 2325. |
| Deep Learning Word Embeddings | Maps words to dense vector spaces based on proximity in training data. | Captures basic semantic relationships; handles synonyms efficiently. | Struggles with complex paragraph-level reasoning and long-term document dependencies. |
| Financial Large Language Models (LLMs) | Utilizes transformer architectures pre-trained on massive financial corpuses for deep semantic comprehension. | Excels at complex, multi-step market reasoning; extracts nuanced causality from unstructured documents 253. | High computational cost; severe API latency (100-500ms) making it useless for HFT; prone to hallucinating facts 25. |
The application of LLMs in feature engineering has progressed rapidly from passive data processing to active factor discovery. Advanced academic frameworks now utilize LLMs as autonomous "Quant Agents." In systems like Alpha-GPT, the language model interacts dynamically with human researchers to hypothesize entirely novel trading features 4. The LLM can propose an economic theory, automatically write the Python code required to engineer the data into a mathematical signal, run a historical backtest, and refine its own logic based on the resulting performance metrics 254.
This agentic capability drastically compresses the research lifecycle. What previously required months of manual hypothesis testing by teams of quantitative analysts can now be prototyped and validated in a fraction of the time 25. However, the integration of LLMs is not without severe limitations. The most pressing constraint is operational latency. A typical API call to a massive model like GPT-4 requires hundreds of milliseconds to process, rendering it entirely useless for high-frequency trading applications where decisions are executed in microseconds 25. Furthermore, LLMs suffer from well-documented "hallucination" problems. Without rigorous guardrails, an LLM might engineer a feature based on a fabricated causal relationship or confidently invent non-existent financial metrics, necessitating strict human oversight and hard-coded data verification protocols 25.
The Curse of Dimensionality and the Trap of Overfitting
Given the virtually infinite amount of alternative data and the ease with which modern software can generate moving averages, technical indicators, and textual embeddings, a novice quantitative researcher might assume the optimal strategy is simply to engineer as many features as possible. The theoretical logic is tempting: feed an advanced neural network thousands of distinct features and rely on the algorithm's deep architecture to sort out the complex, non-linear relationships that drive alpha.
In reality, this "kitchen sink" approach leads directly to one of the most perilous traps in machine learning, a mathematical phenomenon known as the "curse of dimensionality" 28530. First described by mathematician Richard Bellman in 1961, the curse of dimensionality dictates that as the number of engineered features (dimensions) increases, the volume of the mathematical space holding that data expands exponentially 30.
To train a machine learning model effectively and prevent it from memorizing anomalies, the density of the training data must keep pace with the expanding dimensional space 530. However, financial history is strictly finite. There are only so many trading days, earnings reports, and tick movements available in recorded history. If a researcher engineers five hundred different features for an equity prediction model, the historical dataset rapidly becomes terrifyingly sparse within that vast, 500-dimensional space 530.
When faced with sparse, high-dimensional environments containing a low signal-to-noise ratio, highly parameterized machine learning models inevitably succumb to overfitting 2831. Instead of learning robust, repeatable economic rules, the algorithm utilizes its immense processing power to memorize the specific, random noise of the training data 3132. The model will effortlessly find highly complex, purely coincidental relationships between features and target returns. It might falsely "discover" that a specific stock always rises on the third Tuesday of the month when its 50-day moving average crosses its 200-day moving average and the CEO uses the word "synergy" on an earnings call 31. While this hyper-specific rule perfectly explains the historical training set, it possesses zero genuine predictive power for live, out-of-sample trading.
The Complexity Arms Race: Do Deep Models Actually Work?
This dynamic has sparked a fierce, ongoing debate within the quantitative finance community regarding the true value of algorithmic complexity versus simple, robust feature engineering. For decades, the quantitative orthodoxy adhered to a strict "simplicity bias." Practitioners argued that because financial data is relentlessly noisy, utilizing anything more complex than penalized linear regression or simple decision trees invited disastrous overfitting 133.
Recently, major institutions like AQR Capital Management have challenged this assumption, publishing research suggesting that highly complex, over-parameterized deep learning models can eventually push through the noise to capture rich, non-linear market relationships that classical models miss 33. This theory relies on the concept of "double descent," where increasing model complexity initially causes catastrophic overfitting, but pushing the complexity even further eventually allows the model to interpolate the data smoothly, resulting in a sudden drop in out-of-sample error 133.
Conversely, skepticism remains high. A comprehensive 2026 study published in The Journal of Financial Data Science explicitly tested this assumption on Asian equities. The researchers constructed a state-of-the-art predictive pipeline utilizing advanced feature engineering (Independent Component Analysis and Wavelet Coherence) fed into an attention-based Long Short-Term Memory (LSTM) neural network 6.
The results were a striking indictment of unchecked complexity. The sophisticated deep learning pipeline utterly failed to predict returns, collapsing to the unconditional mean and generating a dismal Sharpe ratio of 0.07. In stark contrast, a simple, parsimonious linear model utilizing basic, market-capitalization normalized flow features generated a stellar Sharpe ratio of 1.30 6. The study concluded unambiguously that in the low signal-to-noise environment of financial markets, applying deep domain expertise to engineer a small handful of highly relevant features yields substantially better results than relying on the brute force of algorithmic complexity 6.
Dimensionality Reduction and Feature Filtering
Because extraneous features dilute predictive power and invite overfitting, modern feature engineering places as much emphasis on the systematic destruction of weak features as it does on their creation 5. Quantitative researchers rely on a suite of sophisticated techniques to reduce dimensionality, filter noise, and isolate the true economic signal.
The most straightforward defense involves strict feature selection protocols. "Filter methods" utilize rigorous statistical tests to independently rank the predictive power of each feature, ruthlessly dropping those that exhibit low variance or are highly correlated with other inputs 3235. Feeding a model two features that describe the exact same market phenomenon - such as two different momentum indicators that move in near-perfect tandem - causes multicollinearity, which destabilizes regression models and destroys the interpretability of the results 3132.
More advanced techniques involve mathematical feature extraction. Principal Component Analysis (PCA) is widely utilized to systematically reduce hundreds of correlated financial features into a smaller, dense set of uncorrelated mathematical components that still retain the vast majority of the original dataset's variance 228.
To combat the inherent noise of time-series data prior to model ingestion, sophisticated quantitative teams frequently deploy Wavelet Transforms. Unlike traditional Fourier transforms, which only capture frequency over an entire dataset, wavelets can decompose highly volatile, non-stationary financial data into both time and frequency domains simultaneously 236. By passing raw price features through wavelets like Haar or Daubechies, engineers can cleanly strip away the high-frequency "static" of random market microstructure noise, leaving behind the smooth, underlying signal that represents the true directional trend 36. Empirical evidence indicates that integrating wavelet-denoised features into machine learning models dramatically improves predictive accuracy and generalization compared to models trained on raw, noisy indicators 36.
Catastrophic Pitfalls: Look-Ahead Bias and Data Leakage
Even the most mathematically rigorous and thoroughly denoised features will destroy a quantitative fund if they succumb to fundamental engineering errors during the backtesting phase. In the realm of feature engineering, the single most lethal error is known as look-ahead bias 13.
Look-ahead bias occurs when a feature is inadvertently calculated using information that was not realistically available to the trading algorithm at the specific historical moment the simulated trade occurred 1337. Financial databases are highly deceptive in this regard. A commercial database might record a company's exceptional fourth-quarter earnings report precisely on December 31st. A novice feature engineer will calculate a valuation signal assuming the algorithm knew those earnings on January 1st. In reality, the corporate accounting department did not publicly release that report until February 15th.
By feeding the model data from December 31st, the engineer has effectively given the algorithm a crystal ball. The resulting backtest will produce an impossibly perfect, upward-sloping equity curve, as the model "predicts" the future using data that was literally leaked from the future 13. When deployed in live trading without this unnatural advantage, the model collapses. Preventing look-ahead bias requires agonizing attention to detail and the maintenance of strictly "point-in-time" databases, ensuring every single data point is timestamped to the exact millisecond it crossed the public news wire, rather than the date it nominally represents 1323.
A subtler, equally dangerous iteration of this problem is feature leakage. This often occurs during the data normalization process. Machine learning models require features to be scaled, commonly through Z-scoring, which centers the data around a mean of zero 13. If a researcher calculates the mean and standard deviation of an asset's price using the entire ten-year dataset, and then uses those global statistics to normalize a feature value in year two, they have leaked future volatility data into the past 13. The correct engineering approach mandates the exclusive use of rolling or expanding windows, ensuring that a feature on any given day is normalized using only the historical data that preceded it 13.
The Red Queen Equilibrium and Alpha Decay
The ultimate, existential challenge facing feature engineering today is not the theoretical difficulty of discovering predictive signals, but the terrifying reality of surviving their inevitable degradation. In systematic investing, "alpha decay" refers to the relentless process by which a profitable, engineered trading feature loses its predictive power and profitability as more market participants discover it and allocate capital against it 2438.
The explosion of alternative data, the ubiquity of cloud computing infrastructure, and the massive deployment of LLM-assisted research workflows are fundamentally compressing the shelf life of "copyable alpha" 2438.
Historically, discovering a novel statistical anomaly or engineering a unique fundamental feature provided a quantitative fund with a proprietary edge that could last for years 38. Today, the window for alpha extraction is severely front-loaded. If a feature relies on standardized public data - such as basic earnings momentum metrics or standard industry classifications - and is built using conventional backtesting logic, thousands of independent algorithmic agents across global hedge funds will likely discover it simultaneously 38740.
When massive amounts of institutional capital converge on the exact same engineered feature, the resulting order flow immediately alters the market microstructure. The inefficiency the feature was designed to exploit is rapidly arbitraged away, and the expected returns associated with that signal compress toward zero 2438.
Recent empirical studies tracking the performance of classic quantitative factors have provided stark evidence of this decay. Research indicates that "mechanical" features - those driven by easily replicable, rules-based logic like price momentum - exhibit a severe "hyperbolic decay" curve over time 8. The predictive alpha of these features degrades rapidly as algorithmic crowding accelerates, effectively validating theoretical equilibrium models of market competition 8. Interestingly, features rooted in complex "judgment" - such as intricate value and quality assessments requiring deep contextual parsing - do not show the same systemic pattern of hyperbolic decay, suggesting that higher barriers to informational processing effectively insulate certain signals from rapid commoditization 78.
This dynamic creates what economists term a "Red Queen equilibrium." Quantitative funds must invest massive amounts of capital into AI infrastructure and feature engineering talent simply to maintain their current returns, running faster just to stay in the exact same place 40. If thousands of AI systems are trained on similar datasets and utilize similar optimization objectives, they risk implicit collusion, converging on correlated trading features without explicit coordination. This not only erodes individual alpha but radically increases systemic market fragility, as correlated models simultaneously attempt to liquidate identical positions during periods of unexpected stress 40.
To survive this era of accelerated alpha decay, elite quantitative institutions are drastically adapting their operational models. Rather than relying on static feature sets, the emphasis is shifting toward the speed of the research-to-production pipeline, allowing firms to rapidly deploy a signal, harvest the front-loaded returns, and ruthlessly discard the feature the moment statistical monitoring detects the onset of hyperbolic decay 38. Furthermore, true competitive advantage is retreating behind the walls of highly proprietary, un-scrapable alternative data and domain-specific feature engineering that off-the-shelf machine learning models cannot intuitively replicate 38.
Bottom line
Feature engineering is the indispensable translation layer of quantitative finance, mathematically converting the chaotic noise of global markets into structured signals that dictate the success or failure of algorithmic trading strategies. While advancements in deep learning and Large Language Models have automated the extraction of deep semantic meaning from previously unstructured alternative data, they have not eliminated the foundational requirements of statistical rigor, strict point-in-time validation, and the relentless fight against the curse of dimensionality. As democratized AI accelerates the decay of generic alpha, the future of quantitative dominance belongs not to those running the most complex, over-parameterized algorithms, but to those who can engineer the most proprietary, clean, and economically logical features.