Stripe IPO Valuation and Payment Processing Economics
Evolution of the Private Market Valuation
Stripe, Inc. has established itself as a foundational infrastructure layer for the global digital economy. As of February 2026, the company executed an employee tender offer valuing the private financial technology firm at approximately $159 billion 1123. This valuation reflects a dramatic 74% year-over-year increase from a $91.5 billion secondary transaction in early 2025, and decisively eclipses the company's prior peak valuation of $95 billion achieved during the 2021 technology bull market 5674.
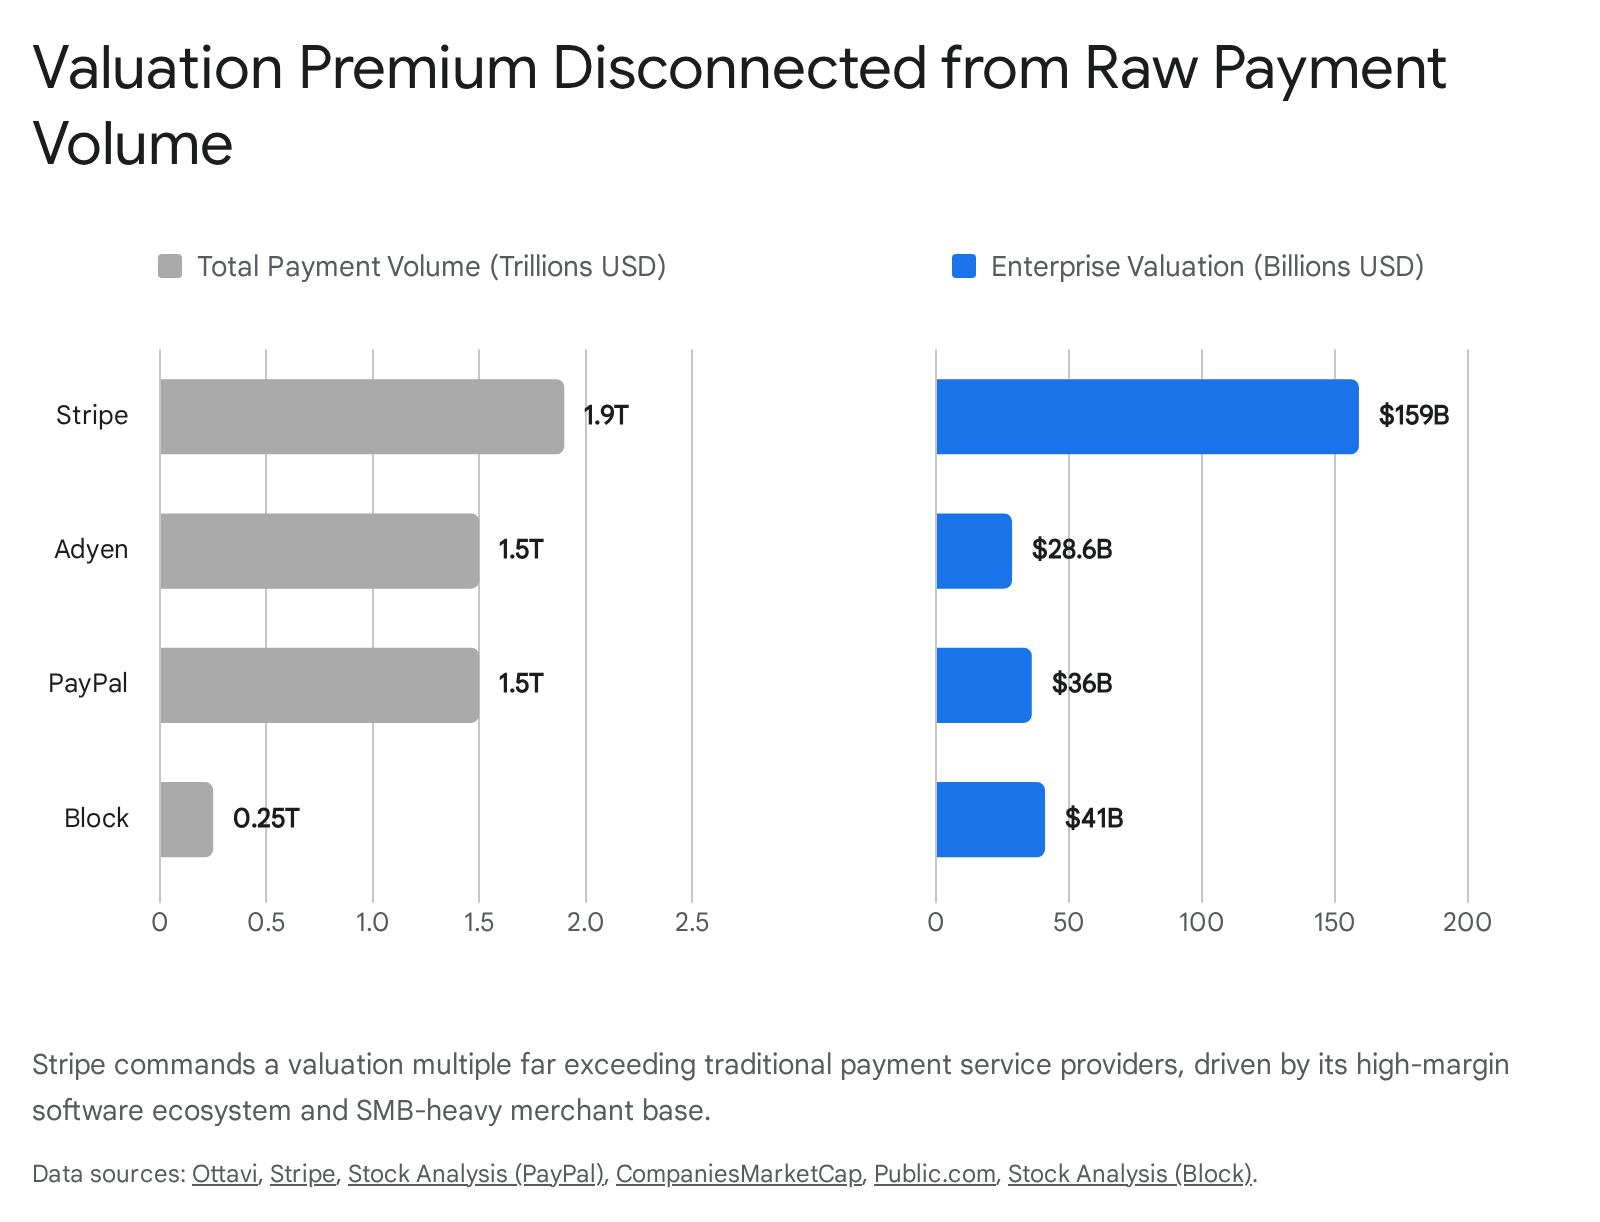
The $159 billion figure places Stripe in a unique strategic position, conferring upon it a market capitalization that significantly exceeds its closest publicly traded payment processing peers.
The most recent tender offer was backed by major institutional investors, including Thrive Capital, Coatue, and Andreessen Horowitz (a16z), while Stripe concurrently utilized a portion of its own substantial cash reserves to repurchase shares 24. By facilitating secondary liquidity events for employees and early investors, Stripe has effectively neutralized the primary internal pressures that typically force mature technology companies into the public equity markets.
Historical Valuation Trajectory
The progression of Stripe's private market valuation illustrates a severe correction followed by a rapid, fundamentals-driven recovery. After peaking at $95 billion in 2021, the company's internal 409A valuation and secondary market pricing contracted significantly amid the broader macroeconomic tightening of 2022 and 2023, falling to approximately $50 billion during its Series I funding round in March 2023 79.
By mid-2024, secondary market transactions and tender offers indicated a recovery to between $65 billion and $70 billion 91011. The subsequent leap to $91.5 billion in early 2025 and $159 billion in 2026 demonstrates a decoupling of Stripe's valuation from broader, commoditized payment processors 756. This premium is directly correlated with the company's transition to absolute profitability, its escalating scale, and the compounding growth of its high-margin software-as-a-service (SaaS) ecosystem.
Total Payment Volume and Processing Scale
The scale of Stripe's payment routing infrastructure has reached macroeconomic significance. In 2025, businesses utilizing the Stripe platform generated $1.9 trillion in total payment volume (TPV) 2567. This represents a 34% year-over-year growth rate from the $1.4 trillion processed in 2024 and equates to roughly 1.6% of global gross domestic product (GDP) 578. The platform now serves millions of businesses directly or via platform integrations, powering 90% of the Dow Jones Industrial Average, 80% of the Nasdaq 100, and 62% of the Fortune 500 567.
Geographic Distribution of Payment Volume
While Stripe maintains a dominant domestic market presence, its growth is increasingly driven by international expansion. In the United States, Stripe commands an estimated 45% of the online payment processing market, and North America has historically accounted for approximately 70.2% of the company's overall business 9.
However, the geographic composition of the platform is shifting. Europe represents the second-largest market at 15.8%, followed by the Asia-Pacific (APAC) region at 7.9%, Latin America at 1.5%, and Africa at 0.8% 9. In its 2025 annual letter, Stripe management highlighted that 57% of new corporate cohorts joining the platform were based outside of the United States, reflecting a broader trend of internet-native businesses treating the entire web as their domestic market from inception 257.
Cohort Growth and API Velocity
The velocity of transaction processing on the platform underscores its utility status. Stripe processes more than 500 million API requests daily 517. Furthermore, the 2025 cohort of new businesses launching on Stripe grew approximately 50% faster than the 2024 cohort, with twice as many companies reaching $10 million in annual recurring revenue within three months of their launch 257. This acceleration is heavily correlated with the proliferation of artificial intelligence startups, which deploy globally by default and rely on Stripe's developer-centric infrastructure to rapidly monetize user bases.
Core Revenue Generation and Profitability
Unlike many highly valued, growth-stage technology entities, Stripe's $159 billion valuation is underpinned by substantial free cash flow and absolute profitability. As a private company, Stripe does not publicly disclose audited financial statements, but institutional equity research and secondary market data provide reliable consensus estimates of its financial health.
Gross Revenue Versus Net Revenue Economics
For the fiscal year 2025, third-party equity research estimates place Stripe's net revenue between $5.84 billion and $6.93 billion, representing a year-over-year growth rate of approximately 36% 5518. This net revenue figure represents the actual top-line value captured by Stripe after deducting interchange fees, card network scheme assessments, and processing partner costs from an estimated gross revenue pool of nearly $19.4 billion 5619.
Cash Flow and Operational Profitability
Stripe achieved full operational profitability in 2024, generating an estimated $2.2 billion in free cash flow 69620. The company's cash and equivalents position entering 2026 was estimated to exceed $7 billion 20. This highly cash-generative profile provides Stripe with the internal liquidity necessary to fund aggressive research and development, execute strategic acquisitions, and underwrite employee liquidity events entirely independent of the public equity markets 677.
Take-Rate Economics and Pricing Architectures
The fundamental divergence in enterprise valuation between Stripe and its competitors can be traced directly to unit economics and merchant composition. The global payment processing industry operates on a pricing continuum between simple flat-rate models - which are highly favored by small-to-medium businesses (SMBs) - and transparent Interchange++ models, which are demanded by large-scale enterprise merchants seeking cost optimization.
The Blended Net Take Rate Model
Stripe's standard published pricing for domestic online card transactions in the United States is 2.9% plus $0.30 per successful charge 21222324. This flat-rate model is a "blended" rate; Stripe absorbs the variable underlying interchange and scheme fees, leaving the company with a variable margin. Because Stripe serves millions of small businesses, early-stage startups, and mid-market companies, a massive portion of its total volume is processed at or near this standard rate. Consequently, Stripe's net take rates for SMB clients frequently exceed 50 basis points (0.50%) 524.
While Stripe aggressively negotiates custom Interchange+ or discounted flat-rate pricing for its massive enterprise clients (resulting in enterprise take rates closer to 16 to 20 basis points), its heavy concentration of SMB volume pulls its consolidated corporate take rate up significantly. Industry analysts estimate Stripe's blended net take rate across its entire $1.9 trillion volume to be approximately 35 to 40 basis points 518.
Interchange++ Pricing Dynamics
In stark contrast, European competitor Adyen operates almost exclusively on an Interchange++ model designed for high-volume enterprise and multinational merchants 222425. In this architecture, the merchant pays the exact interchange fee and network scheme fee, plus a transparent, fixed processing markup to Adyen (typically a small percentage, such as 0.60%, plus a fixed per-transaction fee like $0.11 or $0.13) 22232425.
Because Adyen focuses heavily on massive retail and digital enterprises, its overall net take rate is structurally lower, generally estimated between 16 and 20 basis points, and reported at approximately 0.17% 526. Therefore, while Adyen processed €1.39 trillion (roughly $1.5 trillion) in 2025, it generated €2.36 billion in net revenue 510. By comparison, Stripe processed $1.9 trillion but generated nearly $6.9 billion in net revenue, demonstrating the massive multiplier effect of its SMB merchant base and the structural advantage of flat-rate arbitrage at scale 518.
Point-of-Sale and Micro-Merchant Pricing
Block, Inc., operating primarily through its Square ecosystem, relies heavily on in-person point-of-sale (POS) transactions. To combat broader margin compression and inflation, Square initiated significant price increases in early 2026. Free-tier online processing rates jumped from 2.9% + $0.30 to 3.3% + $0.30, representing a 14% increase on every digital sale 111230. Simultaneously, in-person card-present rates increased from 2.6% + $0.10 to 2.6% + $0.15 per transaction 1130. While these adjustments immediately pad gross margins, they expose Square to attrition risk among price-sensitive micro-merchants who may migrate to lower-cost alternatives.
Comparison of Core Payment Competitors
| Metric | Stripe (Est. 2025/2026) | Adyen (Reported 2025) | Block, Inc. (Reported 2025) | PayPal Holdings (Mid-2026) |
|---|---|---|---|---|
| Enterprise Valuation | ~$159 Billion | ~$25B - $32 Billion | ~$37B - $41 Billion | ~$36B - $43 Billion |
| Total Processed Volume | $1.9 Trillion | €1.39 Trillion (~$1.5T) | ~$247.9 Billion (GPV) | Unavailable / Fragmented |
| Net Revenue | ~$5.8B - $6.9 Billion | €2.36 Billion | ~$10.1 Billion (Gross Profit) | Unavailable |
| Primary Pricing Model | Flat-Rate (2.9% + $0.30) | Interchange++ | Flat-Rate (2.6% + $0.15 POS) | Flat-Rate & Custom |
| Target Merchant Profile | Developer-first, SMB to Ent. | Global Enterprise | Micro-merchant, Retail | Consumer Wallet, Online SMB |
| Blended Net Take Rate | ~35 - 40 bps | ~16 - 20 bps | >100 bps (varies heavily) | Varies |
(Data derived from aggregated financial reports, market capitalization trackers, and secondary market analyses as of mid-2026 518222426101113141516. Note: Block's figures represent Gross Payment Volume across Square and Cash App, reporting gross profit rather than standard net revenue.)
Public Market Comparables and Sector Positioning
To accurately contextualize Stripe's $159 billion valuation, it must be evaluated against the public equity performance of its closest structural peers.

The 2025 and 2026 market environments have severely penalized pure-play payment processors facing commoditization and slowing volume growth, while simultaneously rewarding entities that derive significant revenue from recurring, capital-light software services.
Adyen N.V.
Based in Amsterdam, Adyen represents the most direct enterprise-scale comparison to Stripe. In 2025, Adyen reported €2.36 billion in net revenue (an 18% year-over-year increase) and processed €1.39 trillion in total volume 10. Despite operating with highly impressive operational efficiency - generating an EBITDA margin of 53% - Adyen's market capitalization experienced significant contraction, fluctuating between $25 billion and $32 billion by June 2026 5101517.
Adyen's valuation compression stems largely from a deceleration in raw volume growth. Total processed volume grew only 8% year-over-year in 2025, significantly slower than the 33% growth reported in 2024 261018. Adyen's strict focus on enterprise clients renders it highly vulnerable to macro-level consumer spending slowdowns. Furthermore, the European payments landscape presents unique systemic risks; the proliferation of account-to-account (A2A) payment networks - such as SEPA Instant in Europe and Pix in Brazil - allows merchants to bypass traditional card interchange schemes entirely 2619. Because A2A transactions carry negligible interchange costs, they threaten to erode the core processing margins that processors like Adyen rely upon 26.
Additionally, market analysts note that Adyen's reported earnings per share (EPS) were significantly bolstered by interest income. Holding over €12 billion in cash, Adyen generated €314 million in interest and investment income in 2025; as central banks enter rate-cutting cycles, this non-operational income stream is expected to compress 26.
Block, Inc. (Square and Cash App)
Block, Inc. operates a bifurcated model, serving merchants through its Square ecosystem and consumers through Cash App. As of June 2026, Block's market capitalization stabilized around $41 billion 163820. The company's total Gross Payment Volume (GPV) across Square and Cash App reached $247.9 billion in the trailing twelve months leading into mid-2025, representing a steady but maturing growth profile 13.
To offset slowing merchant volume growth, Block has aggressively pivoted toward monetization via financial solutions. In Q4 2025, Cash App Consumer Lending origination volume reached $18.5 billion, representing a 69% year-over-year increase, driven primarily by Cash App Borrow and buy-now-pay-later (BNPL) integrations through Afterpay 2122. While this strategy successfully increases gross profit per active user, it shifts Block's risk profile away from capital-light software multiples toward balance-sheet-heavy lending multiples, which are traditionally valued at a steep discount by public markets 2343.
PayPal Holdings and Consolidation Rumors
PayPal Holdings has experienced one of the most severe market capitalization degradations in the fintech sector, falling from peak pandemic valuations to a net worth fluctuating between $36 billion and $43 billion in the first half of 2026 11444. PayPal has struggled to modernize its legacy merchant checkout infrastructure against technologically superior, developer-first architectures like those of Stripe and Adyen, while simultaneously ceding consumer digital wallet share to Apple Pay and Google Pay 1345.
In late February 2026, credible reporting from Bloomberg indicated that Stripe had expressed preliminary interest in acquiring all or parts of PayPal Holdings 1123464748. While neither company formally confirmed active, late-stage negotiations, the strategic logic underpinning the rumor reflects the shifting power dynamics in global fintech 49. A Stripe acquisition of PayPal would represent a generational consolidation event. Stripe would instantaneously acquire PayPal's vast global consumer network - specifically the peer-to-peer dominance of Venmo - and merge it with Stripe's superior backend merchant acquiring infrastructure 454748. With an enterprise valuation of $159 billion and generating over $2 billion in annual free cash flow, Stripe possesses the financial currency (either via private equity issuance or debt capacity) to theoretically execute a transaction of this magnitude 16.
High-Margin Software and Ecosystem Expansion
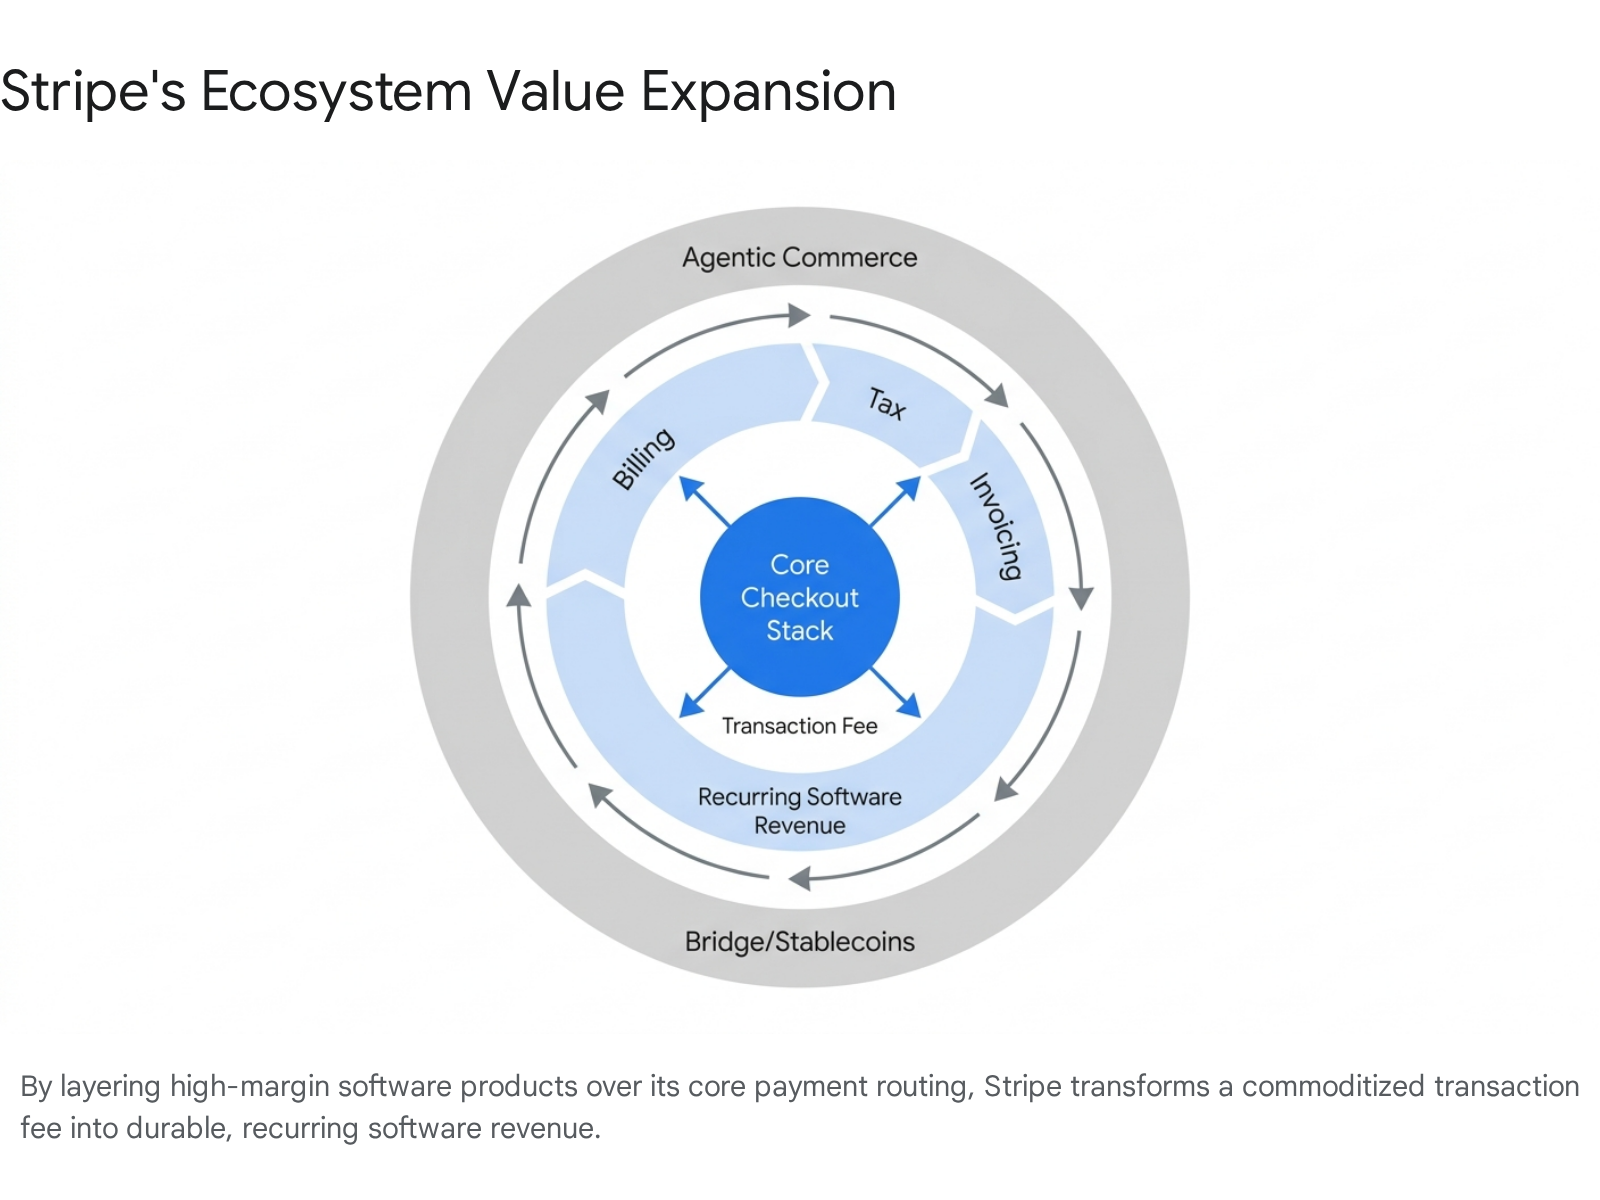
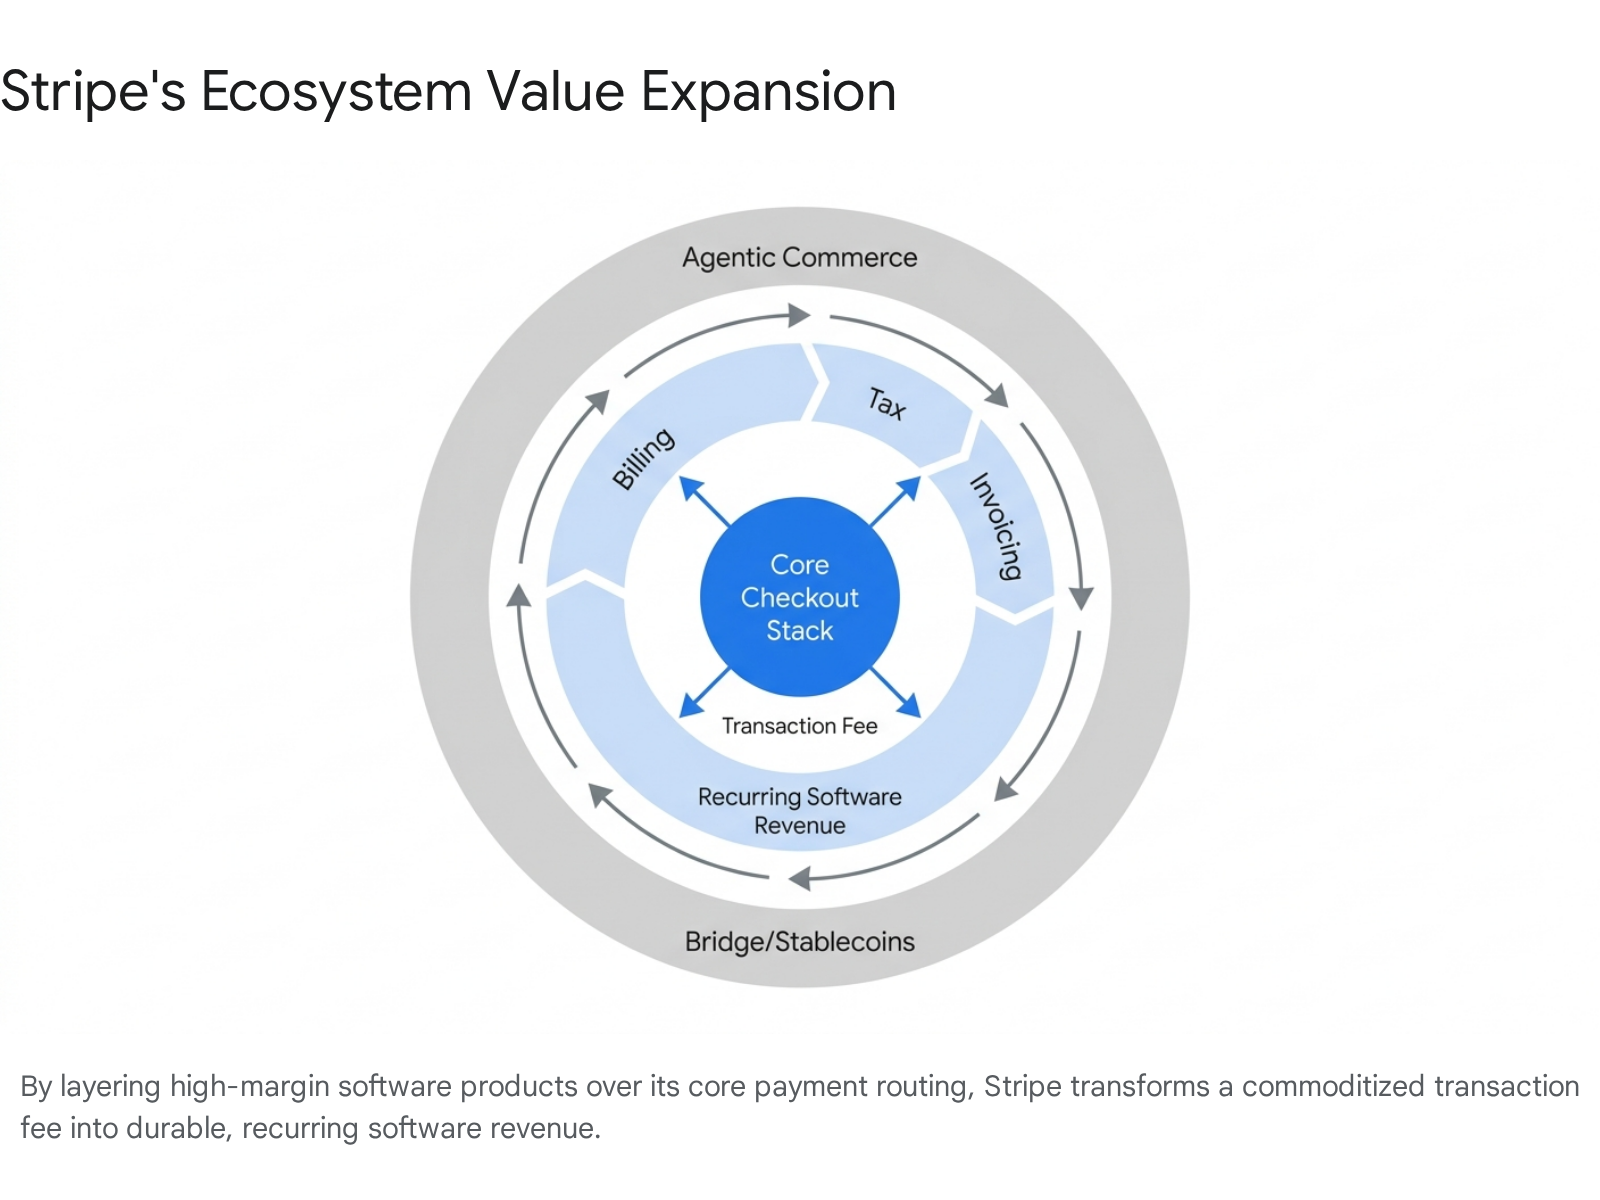
A central justification for Stripe's valuation premium - and its divergence from pure-play payment processors - is its aggressive, successful expansion into high-margin software-as-a-service (SaaS) verticals. Pure transaction processing is increasingly viewed by equity analysts as a commoditized utility, subject to intense margin compression 23. Stripe has mitigated this systemic risk by building a comprehensive, deeply embedded financial operating system.
Revenue and Finance Automation Suite
Stripe's proprietary software offerings - encompassing Stripe Billing, Stripe Invoicing, and Stripe Tax - have decoupled the company's revenue growth from raw payment volume.
This software suite is on track to achieve an annual recurring revenue (ARR) run rate of $1 billion in 2026, doubling from a $500 million run rate measured in early 2025 57818. Stripe Billing alone is utilized by over 300,000 companies managing nearly 200 million active subscriptions 18.
The company bolstered this segment with strategic acquisitions. In early 2026, Stripe acquired Metronome, an invoice management and usage-based billing solution 17719. Metronome powers the intricate, high-frequency billing models required by the world's leading artificial intelligence companies, including OpenAI, Anthropic, and NVIDIA 17. By embedding itself into the core revenue recognition and tax compliance workflows of enterprise clients, Stripe dramatically increases switching costs. Merchants are highly unlikely to migrate to a competing processor for a marginally lower transaction fee if doing so necessitates re-architecting their entire global subscription management and compliance logic 2024.
Artificial Intelligence and Agentic Commerce
Stripe is actively positioning its infrastructure to serve as the default financial routing layer for the artificial intelligence economy. In partnership with OpenAI, Stripe co-developed the Agentic Commerce Protocol (ACP) 2725. This open-source standard establishes a shared technical language that allows autonomous AI platforms to securely initiate transactions, negotiate purchases, and process checkouts across merchants without exposing raw credential data 7.
To facilitate this, Stripe introduced Shared Payment Tokens, a new cryptographic primitive enabling agents to execute payments on behalf of users seamlessly 7. As AI transitions from generative text assistance to autonomous, execution-oriented tasks, securing the underlying payment rails for "agentic commerce" represents a massive, largely untapped total addressable market.
Stablecoin Infrastructure and Cross-Border Settlements
Reversing early industry skepticism toward digital assets, Stripe has aggressively embraced stablecoins as a superior mechanism for cross-border money movement. In late 2024, Stripe acquired the stablecoin orchestration platform Bridge for $1.1 billion, representing one of the largest acquisitions in the company's history 11747.
The macroeconomic data supports this pivot. In 2025, global stablecoin payment volume doubled to approximately $400 billion, with an estimated 60% of that volume representing legitimate business-to-business (B2B) payments 752. Stablecoins achieved an extraordinary annual monetary velocity of roughly 110x, turning over once every 3.3 days, significantly outpacing traditional M2 money supply velocity 52. Following the acquisition, Bridge's transaction volume quadrupled, and the entity secured conditional approval from the Office of the Comptroller of the Currency (OCC) to operate as a federally chartered national bank 147. By integrating Bridge and supporting networks like the Tempo blockchain, Stripe is constructing an alternative settlement architecture designed to bypass expensive correspondent banking networks, drastically lowering the cost of international B2B settlements 725.
Fintech Valuation Multiples and Macroeconomic Environment
Valuing any private entity at $159 billion requires reconciling that price with broader market multiples and macroeconomic trends. The environment for technology and fintech valuations underwent a severe correction following the end of the zero-interest-rate policy (ZIRP) era. Between 2022 and 2024, median revenue multiples for the fintech sector compressed from peak levels of 7.7x down to roughly 4.2x to 4.7x 234353. In the B2B SaaS sector, revenue multiples similarly compressed, stabilizing around 5.9x in 2025 before facing further pressure in 2026 due to AI disruption fears 5455.
The Bifurcation of Fintech Valuation Multiples
Headline average multiples, however, obscure a deeply bifurcated market that heavily rewards specific business models. Industry data from Q1 2026 indicated that while the median fintech EV/Revenue multiple was 7.6x, the arithmetic average was dragged upward to 14.5x by a small subset of highly valued outlier firms 56.
Valuation is currently dictated by capital efficiency and software economics. Balance-sheet-heavy lending businesses, which require vast amounts of capital to grow, trade at deeply depressed multiples of roughly 2.5x to 2.6x revenue 234353. Conversely, capital-light platforms operating with software economics - such as wealth-tech and AI-enabled blockchain infrastructure companies - command premium multiples ranging from 15x to 26x 23435356.
The Rule of 40 and Growth Efficiency
In both the SaaS and fintech sectors, the "Rule of 40" - calculated as the sum of a company's year-over-year revenue growth rate and its EBITDA margin - serves as the preeminent metric for predicting valuation premiums 23435557. In 2026, an estimated 10% to 15% of public fintech companies met this threshold 2343. Those that do meet or exceed the Rule of 40 routinely command valuation premiums of 50% to 100% over their peers 2343.
Stripe's financial profile far exceeds this benchmark. With a reported 34% to 36% top-line revenue growth rate and massive absolute profitability yielding $2.2 billion in free cash flow, Stripe's internal metrics justify a top-tier software multiple rather than a commoditized utility payments multiple 56718. At a $159 billion valuation, assuming 2025 net revenue of roughly $6.9 billion, Stripe is valued at approximately 23x trailing net revenue 1118. While this multiple is exceptionally high relative to the broader public indices, it aligns precisely with the premiums awarded to highly defensible, high-growth, capital-light infrastructure monopolies operating at the top quartile of the private markets 43565726.
Initial Public Offering Considerations and Likelihood
Despite generating consistent industry speculation as the most anticipated IPO of the decade, Stripe has demonstrated no operational urgency to enter the public equity markets 6827. The primary catalysts that typically force mature, late-stage private companies to file an S-1 registration statement are the necessity to provide liquidity to early-stage investors and employees, or the need to raise primary capital to fund operations and expansion.
Strategic Rationale for Remaining Private
Stripe has systematically neutralized these traditional IPO pressures. The company has utilized its robust, self-sustaining free cash flow and backing from major institutional investors to execute periodic, large-scale secondary tender offers 12428. The February 2026 tender offer at the $159 billion valuation successfully provided comprehensive employee liquidity without subjecting the company to the rigorous regulatory burdens, short-term quarterly earnings pressures, and macroeconomic volatility inherent to the public markets 628.
Stripe President John Collison explicitly reinforced this stance in early 2026, stating that an IPO would be "a solution in search of a problem" and confirming that going public is not among the company's top priorities 28.
Prediction Market Consensus on Listing Timeline
Financial prediction markets, which aggregate trader sentiment regarding corporate events, heavily discount the likelihood of a near-term Stripe IPO. By April and May 2026, derivative contracts tied to a Stripe IPO occurring before mid-2026 or year-end 2026 traded at a 97% to 99.8% probability of resolving as "No" 286162. Furthermore, as of mid-2026, the company had not filed a confidential S-1 registration statement with the SEC, which is a mandatory regulatory precursor requiring months of review prior to a public offering 102761. Consequently, market consensus anticipates that Stripe will remain a private entity for the foreseeable future, utilizing its status to aggressively pursue research, development, and strategic acquisitions unencumbered by public market scrutiny.