Should Swing Traders Rely on Price Action or Indicators
The empirical consensus within quantitative finance reveals that technical indicators do not predict future market movements, but rather mathematically transform past data, inherently introducing temporal lag. Conversely, "naked" price action relies on human pattern recognition shaped by behavioral biases, rendering it far from the perfectly objective methodology its proponents claim. The most mathematically sound approach abandons the quest for predictive certainty, utilizing pure price action to identify structural boundaries while deploying specifically calibrated indicators solely to filter noise and confirm momentum.
For anyone navigating modern financial markets, the visual representation of price data presents an immediate and classic trader dilemma: the pristine, unadorned candlestick chart versus the mathematically dense, indicator-heavy terminal resulting in total analysis paralysis. A general reader must care about this distinction because it defines the boundary between objective execution and emotional bias, and ultimately dictates the survivability of invested capital. Relying solely on raw price action is akin to "watching the road" through a windshield; it offers immediate, real-time feedback regarding the terrain - such as market structure, support, and resistance - but it requires the driver to possess immense experiential intuition to accurately gauge speed and momentum. Conversely, deploying technical indicators is like "checking the dashboard"; it provides processed, mathematical readouts of the vehicle's state, including momentum, volatility, and trend strength. However, constantly staring at the dashboard guarantees the driver will miss the sudden, uncalculated curve in the road.
Retail trading lore is plagued by the persistent myth that technical indicators possess inherent, magical predictive power, capable of divining where an asset will move next. In reality, indicators are entirely derivative. They do not forecast the future; they merely process historical price and volume data through predefined algorithms to contextualize the present state of the market 12. Simultaneously, proponents of "naked" price action frequently champion their methodology as a perfectly objective reflection of pure supply and demand. This, too, is a deep fallacy. Stripping a chart of moving averages and oscillators does not eliminate subjectivity; it simply transfers the burden of interpretation entirely to the human brain, which is inherently flawed, prone to confirmation bias, and highly susceptible to seeing patterns where only random noise exists 345. Understanding the mechanics, limitations, and empirical realities of both approaches is the only way to synthesize a robust, mathematically verifiable trading framework.
What is indicator lag?
Indicator lag is the fundamental mathematical delay introduced when historical price data is subjected to smoothing functions, derivative calculations, or statistical averaging. To understand this concept, one must view financial data through the lens of Digital Signal Processing (DSP), a discipline heavily adapted for financial engineering by quantitative pioneers like John Ehlers 6. From a DSP perspective, financial market data is an amalgamation of a low-frequency underlying trend, evanescent cyclical components, and a massive volume of high-frequency noise 67. Technical indicators act as mathematical filters designed to isolate specific components of this data, but this filtration comes at a strict, unavoidable temporal cost.
When a trader applies a standard Simple Moving Average (SMA) to a chart, they are essentially applying a low-pass filter. The mathematical smoothing removes high-frequency price spikes to reveal the underlying trend. However, in signal processing theory, smoothing data over a specific lookback period necessarily introduces a phase delay. For an SMA of length N, the position of the average is conceptually at the center of the data block. This means the indicator inherently lags behind the current price change by approximately half the data length 7.
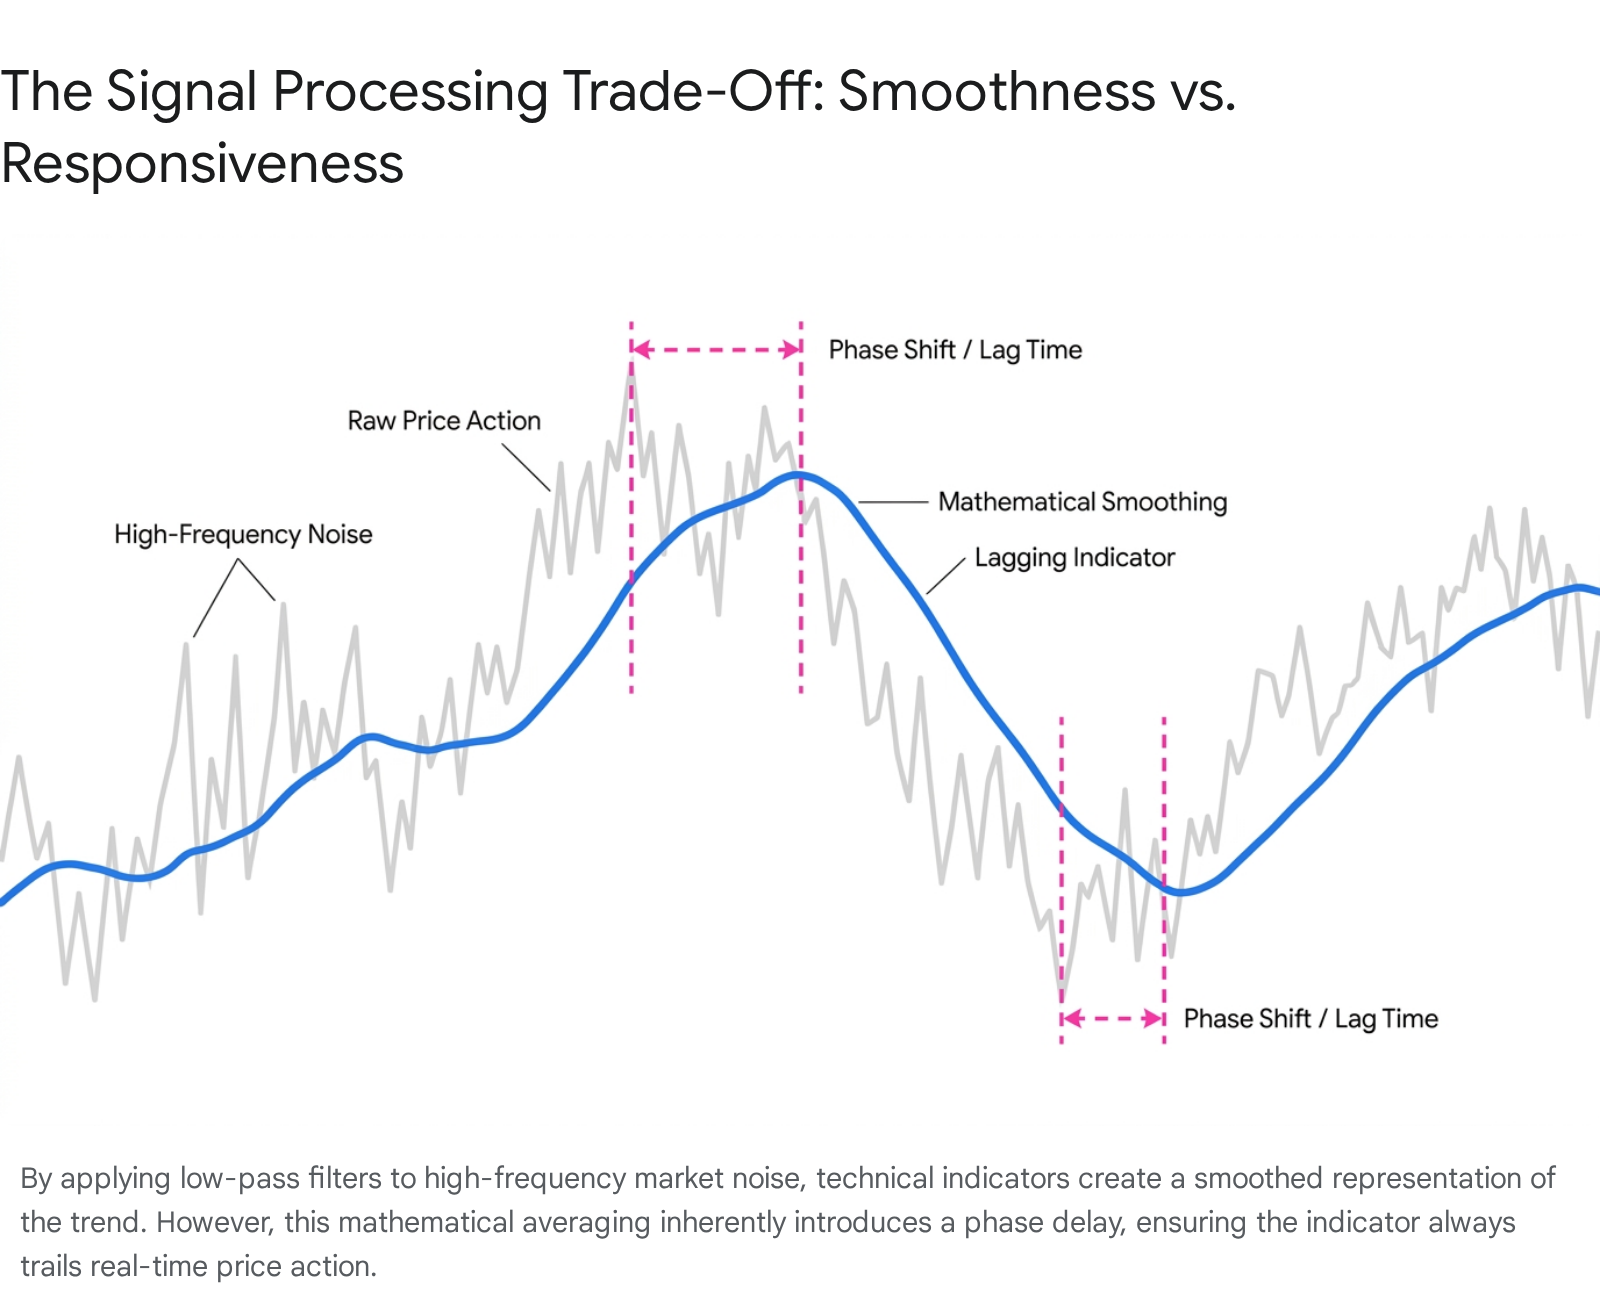
The longer the lookback period, the smoother the signal, but the more severe the lag. By the time a 50-period moving average curves upward to signal a trend reversal, a statistically significant portion of the price move has already occurred and is gone forever 6. This delay is particularly detrimental in short-term trading environments, such as high-frequency trading (HFT) and scalping, where microscopic delays compress profit margins and exponentially increase execution risk and slippage 8.
To mitigate this mathematical reality, financial engineers have developed complex alternatives. The Exponential Moving Average (EMA) attempts to solve this by weighting recent data more heavily than older data. Patrick Mulloy's Triple Exponential Moving Average (TEMA) drastically reduces phase delay by applying multiple levels of exponential smoothing and subtracting the redundant lag, providing a much faster response time 9. Furthermore, advanced DSP techniques utilizing Laguerre polynomials and bandpass filters attempt to achieve near "zero-lag" responses by measuring the difference between high-pass filters and scaling them by their root mean square 7. Other sophisticated models use rank-ordered Kendall correlations to strip out noise components non-linearly without introducing the lag typical of standard smoothing functions 10.
Despite these advanced engineering feats, an inescapable mathematical axiom remains: decreasing lag exponentially increases sensitivity to market noise. A zero-lag indicator is highly responsive to real price action but becomes highly prone to generating false signals, known as "whipsaws," during periods of market consolidation or low liquidity 911. The fundamental issue is that fixed lookback periods - such as the default 14-period setting on the Relative Strength Index (RSI) - assume the market operates on a static cyclical rhythm, which it does not. Applying cycle analytics using Maximum Entropy Spectrum Analysis (MESA) reveals that market cycles are evanescent; a 20-day cycle today might compress into a 15-day cycle next month 67. Using static indicators across dynamic market regimes guarantees that the mathematical output will frequently be misaligned with the actual price structure.
To translate this abstract mathematical lag into actionable steps, market participants must strictly delineate the roles of their tools. Because lag is an unchangeable reality of historical averaging, a trader must never use a lagging indicator as a primary entry trigger. Waiting for a slow moving average crossover or an oscillator to register a perfectly smoothed signal guarantees entering the market at a sub-optimal price point. Instead, the actionable workflow requires using raw, real-time price action to pinpoint the exact moment of execution, utilizing the lagging indicators purely as secondary environmental filters to confirm the broader, macro-level momentum and structural state 812.
Do technical indicators actually work in backtests?
The chasm between retail trading lore and empirical academic consensus is remarkably vast when evaluating the actual efficacy of technical indicators. Retail brokerage marketing and online forums frequently present technical indicators as standalone predictive engines capable of generating consistent alpha. However, rigorous quantitative backtesting, deeply documented within empirical finance literature and peer-reviewed journals, reveals a much more complex, and often heavily contradictory, reality.
The Illusion of Prediction in Deep Learning and Algorithmic Models
In modern quantitative finance, researchers have utilized advanced machine learning to determine whether the mathematical transformations provided by technical indicators offer any true predictive edge over raw price data. A massive, large-scale ablation study evaluated this precisely, conducting 500 controlled experiments involving 10 different assets across five classes - including commodities, cryptocurrencies, equities, foreign exchange, and indices - using daily data from 2010 to 2025 13.
The researchers tested deep recurrent neural network architectures, specifically Long Short-Term Memory (LSTM) and Gated Recurrent Unit (GRU) models. The study compared a baseline model fed exclusively with raw Open-High-Low-Close-Volume (OHLCV) data against variants augmented with momentum indicators (like the RSI and Stochastic Oscillator), trend indicators (like the SMA, EMA, and MACD), and volatility indicators (like Average True Range and Bollinger Bands).
The empirical results stand as a fundamental rebuke to retail technical analysis. The study proved that technical indicators did not improve forecasting performance; in fact, they frequently degraded it. The baseline OHLCV model achieved the lowest Root Mean Squared Error (RMSE) and the highest directional accuracy at 55.7% 13. Conversely, introducing all indicator categories simultaneously caused a statistically significant 34.6% increase in RMSE 13.
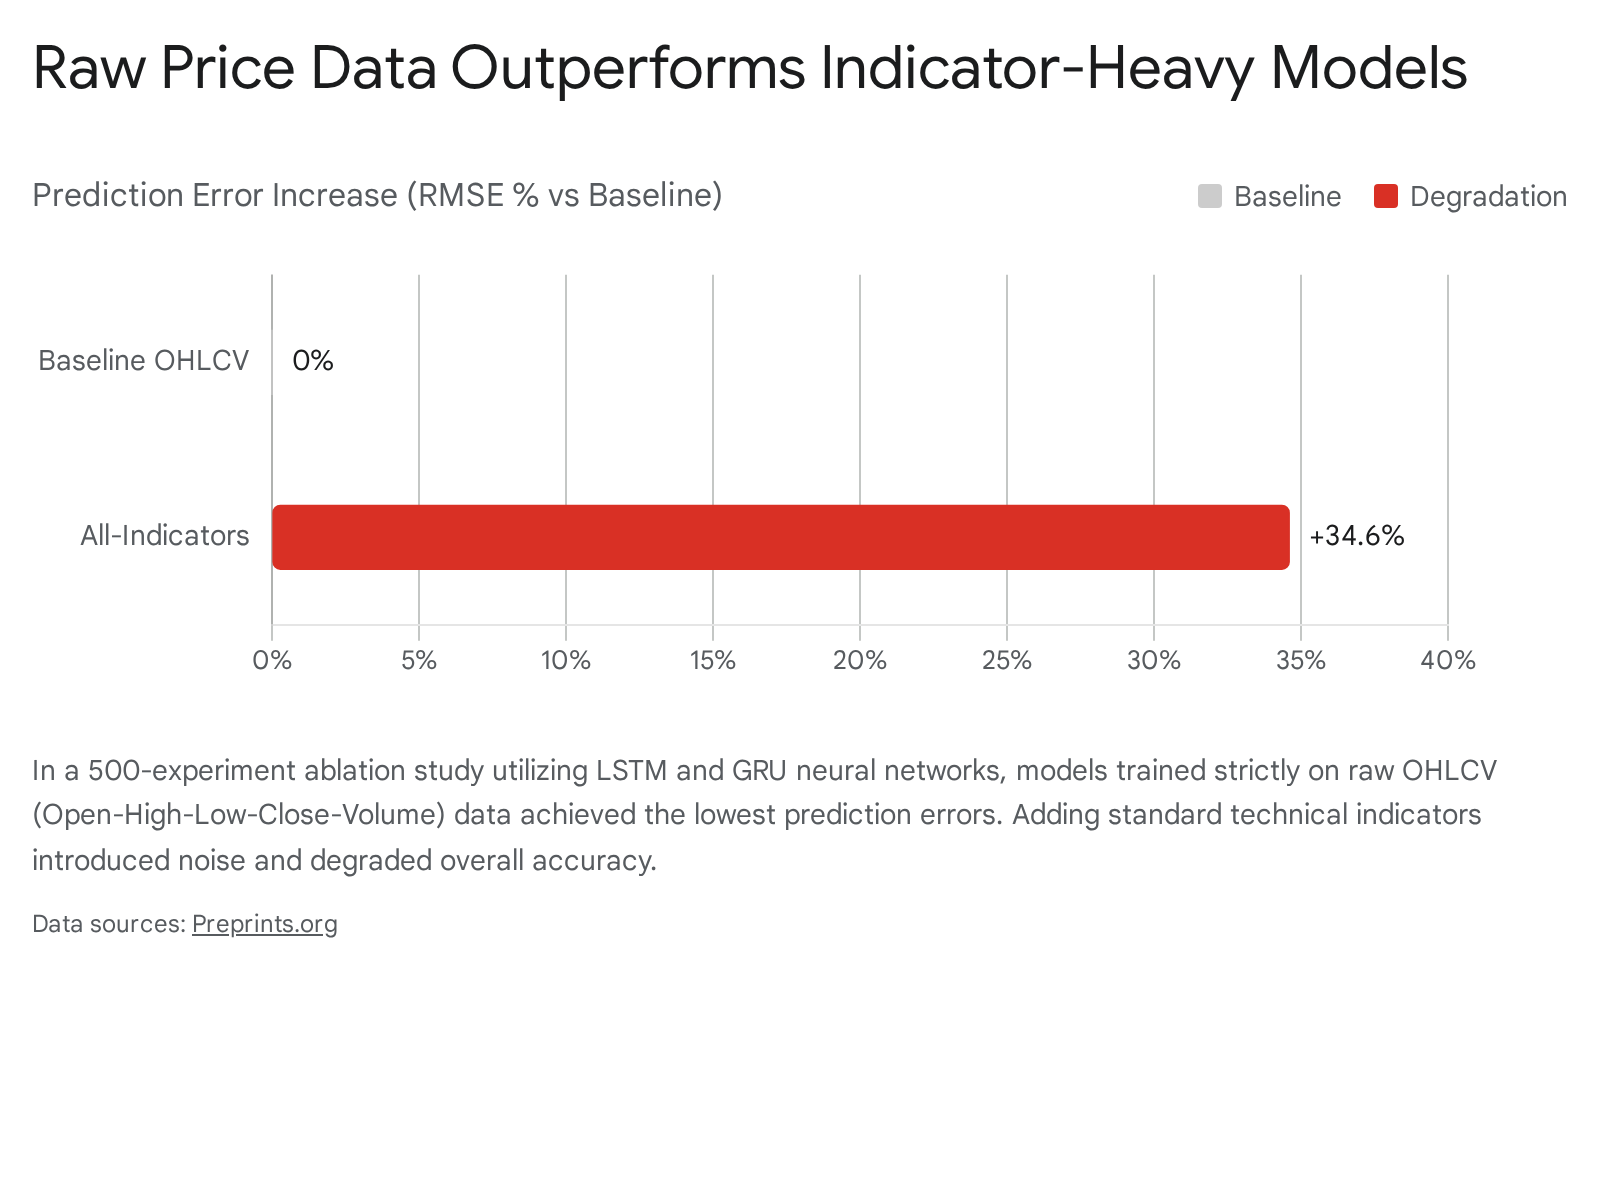
The conclusion drawn from this massive dataset is profound: deep learning architectures implicitly learn the mathematical relationships and structural features that manual indicators attempt to summarize. Because indicators are merely derivatives of price, explicitly feeding them into a model introduces severe feature redundancy and noise, ultimately harming the system's predictive representational capacity 13. The only notable exception identified in the literature was within the foreign exchange market, where volatility indicators provided a marginal 4.2% reduction in error 13.
The Epidemic of Overfitting
When backtests circulated on retail forums do display astronomical historical returns for complex, multi-indicator strategies, academic researchers and institutional quants universally point to a singular, fatal flaw: overfitting. The overfitting phenomenon occurs when a mathematical model is excessively tuned to memorize the systematic noise and random fluctuations of historical data rather than capturing an underlying, generalizable market signal 14116.
A retail trader operating without quantitative discipline will endlessly tweak an indicator's parameters - adjusting an RSI lookback period from 14 to 11, or altering an EMA from 50 to 48 - until the historical equity curve appears flawlessly profitable. This practice, known in academia as data snooping or the multiple testing problem, guarantees failure. Researchers at the Oxford Man Institute formally demonstrated that strategies born of this extreme data mining are mathematically doomed to fail in live, out-of-sample trading 2. When an overfitted strategy encounters new, unseen market regimes, the highly specific conditions it memorized no longer exist, leading to catastrophic drawdowns. For example, research from AQR Capital Management highlighted a scenario where a heavily optimized moving average strategy boasted a Sharpe ratio of 1.2 in-sample, which violently plummeted to a negative 0.2 when exposed to fresh out-of-sample data 18.
To mitigate this, sophisticated quants utilize advanced statistical frameworks such as the Deflated Sharpe Ratio (DSR) or the Probability of Backtest Overfitting (PBO) models, which explicitly correct for the inflation caused by selection bias 3. Rather than hunting for the single highest-performing parameter, rigorous backtesting mandates searching for a "parameter plateau." A plateau represents a wide, stable region of parameter configurations that all yield robust positive returns, proving that the edge relies on a genuine, persistent market anomaly rather than a hyper-optimized, brittle coincidence 142.
Academic Consensus vs. Retail Lore
Despite the limitations exposed by machine learning and the dangers of overfitting, specific indicators applied to specific market regimes maintain statistical validity. However, the way these indicators actually function empirically often directly contradicts the lore taught to retail traders.
| Technical Concept | Retail Trading Lore | Academic & Empirical Reality |
|---|---|---|
| Moving Average Crossovers (Golden Cross) | Universally taught as a highly predictive, standalone "buy" signal that guarantees future upward momentum 20. | Studies show success rates hovering only between 61% and 64%. Rigorous T-tests prove that while they successfully identify long-term trends, crossovers do not significantly outperform a passive buy-and-hold strategy on a risk-adjusted basis due to excessive lag and whipsaws during ranging markets 2045. |
| The RSI "Overbought" Level (>70) | Asserts that a market above 70 is stretched too far, exhausted, and mathematically guaranteed to reverse downwards 2324. | An RSI above 70 is simply a measure of immense relative momentum, indicating that recent bullish closes vastly outnumber bearish closes. In strong institutional trends, assets can remain "overbought" for weeks. Selling an asset purely because it hits 70 is statistically disastrous 242526. |
| Volume-Based Institutional Flow Indicators | Indicators like On-Balance Volume (OBV) and Chaikin Money Flow (CMF) are marketed as tools that detect hidden institutional buying or "smart money" accumulation 27. | Academic literature confirms volume-based indicators do not detect institutional flows. They merely measure total volume weighted by price location within the bar. Correlating these indicators against 13F institutional filings reveals absolutely no predictive relationship or agreement 27. |
| Gap Fills | The absolute certainty that "all market gaps must eventually be filled," leading traders to aggressively fade large overnight jumps 28. | Large-scale backtesting on futures like the MNQ shows the fill rate inversely scales with gap magnitude. While tiny gaps fill at an 81% rate (unprofitable after transaction costs), massive gaps (>1.5 standard deviations) have a near 0% fill rate. Large gaps represent fundamental regime shifts and tend to continue, not revert 28. |
The Behavioral Reality of "Naked" Price Action
In direct response to the lagging, noisy, and often overfitted nature of technical indicators, a massive subset of market purists advocate for "naked" price action. This methodology involves the exclusive study of raw market data - the open, high, low, and close values - translated into candlestick patterns, support and resistance zones, and broader market structure, entirely devoid of mathematical overlays 429. The inherent and unassailable advantage of price action is its immediacy. Because there are no derivative formulas to process or lookback periods to average, there is absolutely zero mathematical lag between market execution and visual representation. The trader is reacting to live, unfolding market psychology in real-time 2930.
However, the assertion that naked charting provides a perfectly objective view of the market is entirely false. Price action analysis is essentially applied behavioral finance made visible on a chart 331. The structural patterns that form - double bottoms, engulfing candles, head-and-shoulders, and break-retest setups - are not magical geometries; they are the visual signatures of human psychology, specifically cognitive bias, herd behavior, and neurobiological feedback loops operating en masse 3.
When a trader reads a chart, they are analyzing the fractal nature of fear and greed. For example, during a volatile breakout above a key resistance level, market participants experience a collective dopamine spike tied to potential financial reward, which fuels a violent momentum surge. However, the moment that price stalls, the amygdala's fear circuitry activates across the market, triggering risk aversion, panic selling, and a sharp reversal 331. George Soros's concept of reflexivity captures this recursive nature perfectly: trader beliefs influence their buying behavior, which physically moves the price, which in turn reinforces the original belief in a self-fulfilling prophecy until the fundamental reality breaks the loop 23.
Because "naked" price action relies exclusively on human visual processing to identify these behavioral footprints, it introduces extreme subjectivity. A novice trader and a quantitative veteran may look at the exact same sequence of candlesticks; the novice sees random, chaotic noise, while the veteran instantly recognizes a high-probability "Swing Failure Pattern" where price temporarily breached a previous low to sweep liquidity before immediately reclaiming the structural level 43032. This subjectivity leaves discretionary traders highly vulnerable to severe cognitive biases. The most dangerous is the "illusion of control" - the deeply held belief that drawing geometric lines on a chart or identifying symmetrical patterns confers mastery over a fundamentally chaotic, non-stationary system 3. Without the cold, mathematical grounding of an indicator, a price action trader is highly susceptible to confirmation bias, finding imaginary patterns that justify their pre-existing emotional desire to take a trade 34.
Despite the immense risks of human subjectivity, academic research does validate the predictive power of certain raw price patterns when tested rigorously. A landmark study published by the Federal Reserve Bank of New York utilized an objective, computer-implemented algorithm to remove human subjectivity from chart reading. The researchers confirmed that the classic Head and Shoulders pattern possessed statistically and economically significant predictive power in currency markets, proving that visual, non-linear chart patterns can capture persistent market inefficiencies 336. Separate independent studies published in the Journal of Financial Econometrics corroborated this, confirming that risk-adjusted excess returns for trading strategies conditioned strictly on the Head and Shoulders pattern yielded 5% to 7% per year 7368.
Furthermore, comprehensive analyses published in the Journal of Finance and the Journal of Financial Markets evaluated traditional Japanese candlestick patterns using vast sets of out-of-sample data. The academic findings demonstrated that specific patterns, when combined with structural context, hold genuine predictive weight. For example, the "Morning Star" pattern and the "Bullish Engulfing" formation demonstrated empirical success rates between 64% and 68% in predicting short-term directional reversals when they occurred at established levels of historical support 383940.
Contrasting Price Action and Technical Indicators
To construct a viable, professional quantitative framework, market participants must objectively categorize the operational differences, strengths, and inherent vulnerabilities of both methodologies.
| Feature Dimension | "Naked" Price Action | Technical Indicators |
|---|---|---|
| Data Processing & Lag Time | Zero Lag: Offers a real-time, immediate reflection of executed volume and price ticks without mathematical distortion 2930. | Inherent Lag: Always delayed by the specific length of the mathematical lookback period and the smoothing filter applied 641. |
| Objectivity vs. Subjectivity | Highly Subjective: Relies entirely on human visual pattern recognition, experiential intuition, and screen time 442. | Highly Objective: Delivers strict, rule-based mathematical outputs, devoid of human emotional bias or interpretation 443. |
| Primary Risk of System Failure | Confirmation Bias: Traders fall victim to seeing patterns that do not exist merely to validate their existing emotional bias 333. | Over-fitting: Strategies are hyper-optimized to memorize past noise, failing catastrophically when live market regimes shift 1418. |
| Learning Curve | Steep & Experiential: Requires thousands of hours of active screen time to intuitively recognize complex structural context 444. | Moderate but Deceptive: Mathematical signals are easy to read initially, but require deep statistical knowledge to optimize correctly without data-mining 445. |
How do you combine price action with indicators?
The tension between the academic reality of indicator lag and the behavioral vulnerabilities of naked price action is resolved through synthesis. Empirical evidence and institutional best practices suggest that relying exclusively on naked charts exposes the trader to psychological failure and subjective error, while relying entirely on indicators invites algorithmic over-fitting and devastating execution delays. The most robust trading framework utilizes a hybrid methodology. This approach mandates deploying pure price action to define the primary market structure - the "what" and the "where" - while utilizing a strictly constrained set of technical indicators to validate the statistical environment and manage risk - the "how" and the "when".
To translate this abstract mathematical and behavioral integration into actionable steps:
Step 1: Define the Structural Boundary Using Price Action Begin analysis with a completely clean, unadorned chart. The objective is to identify horizontal support and resistance zones based purely on historical supply and demand reactions. Because price action has zero lag, these zones serve as the absolute, immovable boundaries of the trade setup. The trader must wait patiently for the price to approach these predetermined zones. If a clear behavioral footprint emerges at this boundary - such as an Engulfing Candle, a Morning Star, or a liquidity-sweeping Swing Failure Pattern - the trader has identified a potential, high-probability entry trigger anchored in real-time market psychology 293239.
Step 2: Consult the Environmental Filter Using Indicators Before executing the trade triggered by the price action, the trader must consult the "dashboard." In this hybrid system, a technical indicator is never used as an entry signal; it is used strictly as an objective filter to ensure the broader mathematical momentum aligns with the discretionary thesis. For example, if the price action forms a bullish pin bar at a major support level, the trader should look at a momentum oscillator like the RSI. The goal is not to blindly buy because the RSI is "oversold." Instead, the trader looks for bullish divergence - a scenario where the raw price action makes a lower low (sweeping liquidity), but the RSI mathematically prints a higher low. This statistical discrepancy confirms that the underlying downward momentum is physically exhausting on a volumetric level, objectively validating the psychological footprint seen in the naked candlestick 234647. If the indicator contradicts the price action, the trade is vetoed 9.
Step 3: Define the Volatility Constraint for Risk Management Finally, the trader must utilize an indicator to manage risk objectively and mathematically. Using a tool like the Average True Range (ATR), the trader measures the current, dynamic volatility of the asset. By setting stop-loss orders based on a multiple of the ATR (e.g., placing the stop 1.5x the ATR below the entry point) rather than choosing a random visual point on the chart, the trader neutralizes their own emotional subjectivity. This ensures their risk parameters adapt dynamically to the current market regime, preventing them from being "whipsawed" out of a structurally sound trade due to normal mathematical noise 1050.
Bottom line
The perpetual debate between proponents of pure price action and advocates of technical indicators is ultimately a false dichotomy. Deep academic literature, machine learning ablation studies, and rigorous quantitative backtesting conclusively prove that technical indicators possess no independent predictive power. Furthermore, they inherently suffer from severe mathematical lag and expose systemic traders to the catastrophic dangers of backtest over-fitting. Simultaneously, pure naked price action, while offering a vital, zero-lag reflection of live market psychology, exposes the discretionary trader to severe cognitive biases and the illusion of control. The only mathematically defensible, psychologically sound, and empirically robust approach to the markets is a synthesized hybrid methodology. By utilizing the real-time nature of price action to identify structural trading opportunities and pinpoint entries, while deploying technical indicators strictly as objective, secondary filters to validate momentum and enforce dynamic risk management, a market participant can successfully navigate the chaos of financial data.