
Performance of Solo Founders versus Startup Founding Teams
Introduction
The decision to launch a startup as a solo founder or to assemble a multi-founder team is a foundational strategic choice that dictates a company's capitalization structure, operational resilience, and ultimate probability of success. Historically, the venture capital paradigm has heavily favored multi-founder teams, operating on the assumption that a diverse distribution of skills - typically divided between technical product development and commercial execution - mitigates early-stage operational risks. However, recent empirical data, accelerated by macroeconomic shifts and advancements in artificial intelligence, challenges this conventional wisdom.
Evaluating whether it is objectively advantageous to be a solo founder or to join a team requires a nuanced analysis of contested datasets, contrasting the outcomes of venture-backed portfolios against broader market survival rates. The research indicates that while multi-founder teams reliably secure more institutional capital and dominate the highest-revenue tiers of technology unicorns, solo founders experience significantly lower rates of internal organizational friction, retain vastly superior equity positions at exit, and, in non-venture-backed environments, demonstrate higher baseline survival rates. This report provides an exhaustive analysis of founding team structures, examining shifting demographics, venture capital bias, equity dilution mechanics, sector-specific requirements, and regional variations across the global startup ecosystem.
Demographic Shifts in Startup Formation
The structural composition of startup founding teams has undergone a measurable transformation over the past decade. The barriers to entry for software development, product distribution, and operational scaling have systematically lowered, enabling individuals to execute business functions that previously required a dedicated founding team.
Rising Prevalence of Solo Founders
Longitudinal data indicates a sharp, continuous rise in the proportion of startups launched by a single individual. The share of new startups with a solo founder rose from 17% in 2017 to 23.7% in 2019, reaching 35% in 2024 and accelerating to 36.3% by the first half of 2025 113. This 53% relative increase since 2019 marks a fundamental shift in the entrepreneurial ecosystem 3.
The proliferation of artificial intelligence, particularly generative AI and workflow automation, functions as a massive operational force multiplier 1. These technologies allow solo operators to rapidly prototype, deploy, and scale products without requiring an immediate technical co-founder. Consequently, solo founders are reaching market validation and operational maturity faster than historical benchmarks. Data demonstrates that solo-led startups hire their first employee earlier than multi-founder teams, with a median of 399 days from incorporation to the first hire, compared to 480 days for multi-founder companies 1.
Contraction of Large Founding Teams
Conversely, startups with large founding teams are becoming statistically rare. As of 2024, only 16% of all newly incorporated startups had three founders, 7% had four founders, and a mere 4% had five founders 1. Each of these figures represents the lowest level recorded in the past ten years 1. Historically, two-person teams have been the most common configuration, representing roughly 45.9% of the ecosystem 4. Within these two-person teams, equal equity splits (50/50) are becoming the standard, rising from 31.5% in 2015 to 45.9% in 2024 1. The decline of larger teams suggests that the administrative coordination costs, early equity dilution, and higher probability of interpersonal conflict outweigh the theoretical benefits of hyper-specialized early leadership.
Founder Demographics and Experience
The demographic profile of successful founders also challenges prevailing industry narratives. While popular culture often associates tech startups with young entrepreneurs, data indicates that the average age of a successful technology founder is 45 52. Furthermore, a 60-year-old entrepreneur is three times more likely to build a successful startup than a 30-year-old, reflecting the immense value of accumulated industry experience and professional networks 38.
Past entrepreneurial experience directly correlates with future success. First-time founders face a baseline success rate of approximately 18% 389. Founders who have previously launched a failed venture see a slight improvement to a 20% success rate, while entrepreneurs who have previously built a successful business enjoy a 30% probability of success in subsequent ventures 38. Gender diversity remains a persistent challenge in startup formation. In the United States, women now make up 41.5% of entrepreneurs, yet all-female founding teams receive only 1% to 2.3% of total venture capital funding 410. Globally, all-male teams captured 83.6% of the $289 billion in venture capital deployed in 2024 4.
Comparative Survival Rates and Failure Mechanisms
Evaluating whether a solo or team structure is superior requires parsing baseline failure rates against specific vulnerabilities inherent to different team sizes. Startup survival is brutally difficult across all configurations, but the mechanisms of failure diverge significantly between solo operators and co-founding teams.
Baseline Business Survival Statistics
The baseline failure rate for startups is widely cited at 90%, with approximately 10% failing within the first year of operation 23910. The most critical period of vulnerability lies between years two and five, a window during which 70% of all startup failures occur 310. Broader data from the U.S. Bureau of Labor Statistics (BLS) tracking all private-sector establishments paints a similarly challenging long-term picture: 20.4% of businesses fail in their first year, 49.8% fail within five years, and 65.3% fail within ten years 84.
Survival rates exhibit massive variance by industry. The technology sector features the highest failure rate, with 63% of technology startups failing within five years 3. In contrast, the real estate, finance, and insurance sectors demonstrate greater stability, with the lowest overall startup failure rate at 42% 5.
| Industry Sector | 1-Year Failure Rate | 5-Year Failure Rate | 10-Year Failure Rate |
|---|---|---|---|
| All Private Sector Businesses | 20.4% | 49.8% | 65.3% |
| Mining, Quarrying, Oil & Gas | 30.8% | 59.8% | 75.5% |
| Information / Technology | ~20% | 53.2% - 63.0% | 70.0% |
| Construction | 16.7% | 42.5% - 53.0% | 57.4% |
| Agriculture & Forestry | 6.9% | 29.4% | 47.0% |
Data aggregated from the U.S. Bureau of Labor Statistics and industry-specific analyses for the 2013-2024 cohorts 4534.
Primary Drivers of Startup Failure
Understanding why startups fail provides critical insight into the structural weaknesses of different founding models. The primary causes of startup failure remain highly consistent across empirical studies.
| Primary Cause of Failure | Percentage of Failed Startups | Underlying Mechanism |
|---|---|---|
| Lack of Market Need | 35% - 42% | Developing products that do not solve validated customer problems; poor product-market fit 2310. |
| Insufficient Capital | 29% - 38% | Inability to secure adequate financing, poor cash flow management, or high burn rates 2310. |
| Team and Co-Founder Issues | 14% - 23% | Co-founder conflict, missing complementary skills, lack of strategic alignment, or poor hiring 2310. |
| Strong Competition | 19% - 20% | Being outpaced by incumbents or better-funded competitors, often occurring in years 3-5 2310. |
| Inadequate Business Model | 18% - 19% | Unsustainable pricing, broken unit economics, or high customer acquisition costs 210. |
Crucially, team dynamics and co-founder conflicts are the third most prevalent killer of startups, responsible for up to 23% of all enterprise failures 310. Disputes regarding strategic direction, unequal labor contributions, equity imbalances, or mismatched risk tolerances frequently lead to corporate paralysis or legal battles that destroy enterprise value 3.
Survival Metrics by Founding Team Size
Solo founders are entirely immune to co-founder conflict, which partially explains their superior survival rates in certain environments 35. However, solo founding introduces a different set of psychological and operational risks. Solo operators represent a single point of failure; if the founder experiences severe burnout, illness, or possesses a blind spot in their skillset, the entire enterprise stalls 3.
Despite these individual risks, rigorous academic research challenges the venture capital consensus that teams are inherently safer. A study by researchers Jason Greenberg and Ethan Mollick analyzed thousands of companies that were initially crowdfunded (via platforms like Kickstarter) and subsequently established as formal entities. By analyzing crowdfunded companies, the researchers deliberately removed the institutional venture capital bias from the dataset 5.
The findings were striking: solo founders were 54% to 55% less likely to dissolve their businesses than teams of three, and roughly 41% less likely to fail than two-person teams 56. For-profit ventures founded by solo entrepreneurs were approximately 2.5 to 2.6 times more likely to survive as ongoing entities than those founded by teams 56. Interestingly, Greenberg and Mollick found the exact inverse to be true for nonprofit organizations, where teams were twice as likely to survive as solo ventures 56. This dichotomy indicates that in highly commercial, fast-moving environments, the agility and unified decision-making of a solo founder provide a tangible survival advantage, bypassing the coordination drag and compromises inherent to team leadership 5.
Venture Capital Allocation and Team Size Bias
While solo founders represent over a third of all new business incorporations and demonstrate high baseline survival rates, their representation within venture-backed portfolios remains disproportionately low. The ecosystem exhibits a well-documented funding divide, highlighting systemic preferences among capital allocators.
Institutional Capital Distribution
In 2024, solo-led companies represented 35% of all new startups but accounted for only 17% of startups that successfully closed a venture capital round 1. Furthermore, solo founders received only 14.7% of the total cash raised in priced equity rounds globally 1.
This disparity highlights a systemic preference among early-stage investors for multi-founder teams. At the Pre-Seed and Seed stages, where product-market fit is unproven and financial metrics are sparse, investors primarily underwrite the team 3. Institutional investors systematically view co-founders as a risk-mitigation mechanism, providing a psychological safety net and complementary skill sets 1. A widely cited study by First Round Capital analyzing their proprietary portfolio found that teams with more than one founder outperformed solo founders by 163% 14. Similarly, data from Startup Genome indicates that startups with two co-founders raise 30% more capital than solo-founder ventures, all else being equal 8.
Valuation Disparities at the Seed Stage
The bias toward multi-founder teams mathematically penalizes solo entrepreneurs during early capitalization events. The First Round Capital study noted that solo founders received seed valuations that were 25% lower than their multi-founder peers 14. Solo-founded companies are also measurably less likely to raise a pre-seed round via Simple Agreements for Future Equity (SAFEs) or convertible notes within their first year, often relying on bootstrapping or personal savings to reach initial milestones 38.
The stark contrast between the high prevalence of solo founders and their low capture of VC funding suggests a self-fulfilling prophecy in venture capital. If investors inherently favor two-person teams, those specific configurations will invariably find fundraising easier, secure higher valuations, and possess more operating runway 14. This capital advantage artificially inflates the subsequent success metrics of multi-founder teams, reinforcing the initial bias in future investment cycles 14.
Capital Normalization in Later Funding Rounds
However, when solo founders do secure institutional backing and survive the early stages, their capitalization trajectories normalize. By Series A - when the investment thesis shifts from subjective team-evaluation to empirical business metrics, revenue growth, and unit economics - the funding round sizes and valuations for solo-founded companies become nearly identical to those of multi-founder companies 3. The primary hurdle for solo founders is clearing the initial Seed-stage bias; once product-market fit is established, the structural configuration of the founding team becomes a secondary consideration to investors 3.
Equity Dilution and Founder Capitalization
The most profound, mathematically certain difference between a solo founder and a multi-founder team lies in capitalization and equity retention. Building a venture-backed startup is an exercise in managed dilution; founders trade absolute ownership for the capital required to increase the aggregate value of the enterprise.
Mechanics of Startup Equity Dilution
Every time a startup issues new shares to investors or expands its employee stock option pool (ESOP), the relative ownership of all existing shareholders decreases 15. Priced equity rounds are the most visible source of dilution. For example, if a founding team holds 8,000,000 shares out of 10,000,000 total (80% ownership) and the company issues 2,500,000 new Series A shares to investors, the founders still hold 8,000,000 shares, but the denominator expands to 12,500,000. Their ownership drops instantly from 80% to 64% 16.
Furthermore, investors frequently mandate the expansion of an unallocated employee option pool prior to closing the round. Most startups reserve between 10% and 20% of equity for their option pools to attract and retain key talent 78. Because this pool is typically carved out of the pre-money valuation, the founders absorb the entirety of that dilution rather than sharing it with the new incoming investors 16.
Standard Dilution Benchmarks by Funding Stage
An analysis of Carta's cap table database, which tracks tens of thousands of U.S. companies, reveals standard median dilution metrics across the modern funding lifecycle. Over the past five years, the venture market has seen a slight decline in overall dilution percentages per round, favoring founders, though the cumulative impact remains severe 9.
| Funding Stage | Typical Round Dilution | Carta Median Dilution (Q1 2024) | Cumulative Founder Team Ownership |
|---|---|---|---|
| Formation | 0% | 0% | 100% |
| Seed Round | 15% - 25% | 20.1% | ~56.2% |
| Series A | 15% - 30% | 17.9% | ~36.1% |
| Series B | 15% - 25% | 16.7% | ~23.0% |
Data aggregated from Carta Q1 2024/2025 Dilution Reports and Lighter Capital analyses 16910. Cumulative ownership accounts for standard pre-money option pool expansions at each stage.
Individual Equity Retention Disparities
Because venture capitalists target fixed ownership ranges for their funds (e.g., a lead investor demanding 20% for a Series A check), solo-founded companies and multi-founder companies experience nearly identical dilution at the corporate entity level during each funding round 3.
However, at the individual level, the solo founder holds a massive mathematical advantage. Because solo founders do not fracture the initial 100% equity block among peers at incorporation, their personal equity stake remains intact. Between 2019 and 2025, the median ownership at exit was 75% greater for a solo founder than for the lead founder (the individual with the largest initial stake, typically the CEO) in a multi-founder team 3.
By Series B, a highly successful two-person team might retain 23% of the company collectively, leaving each individual co-founder with roughly 11.5%. A solo founder at the exact same stage retains the full 23% 116.
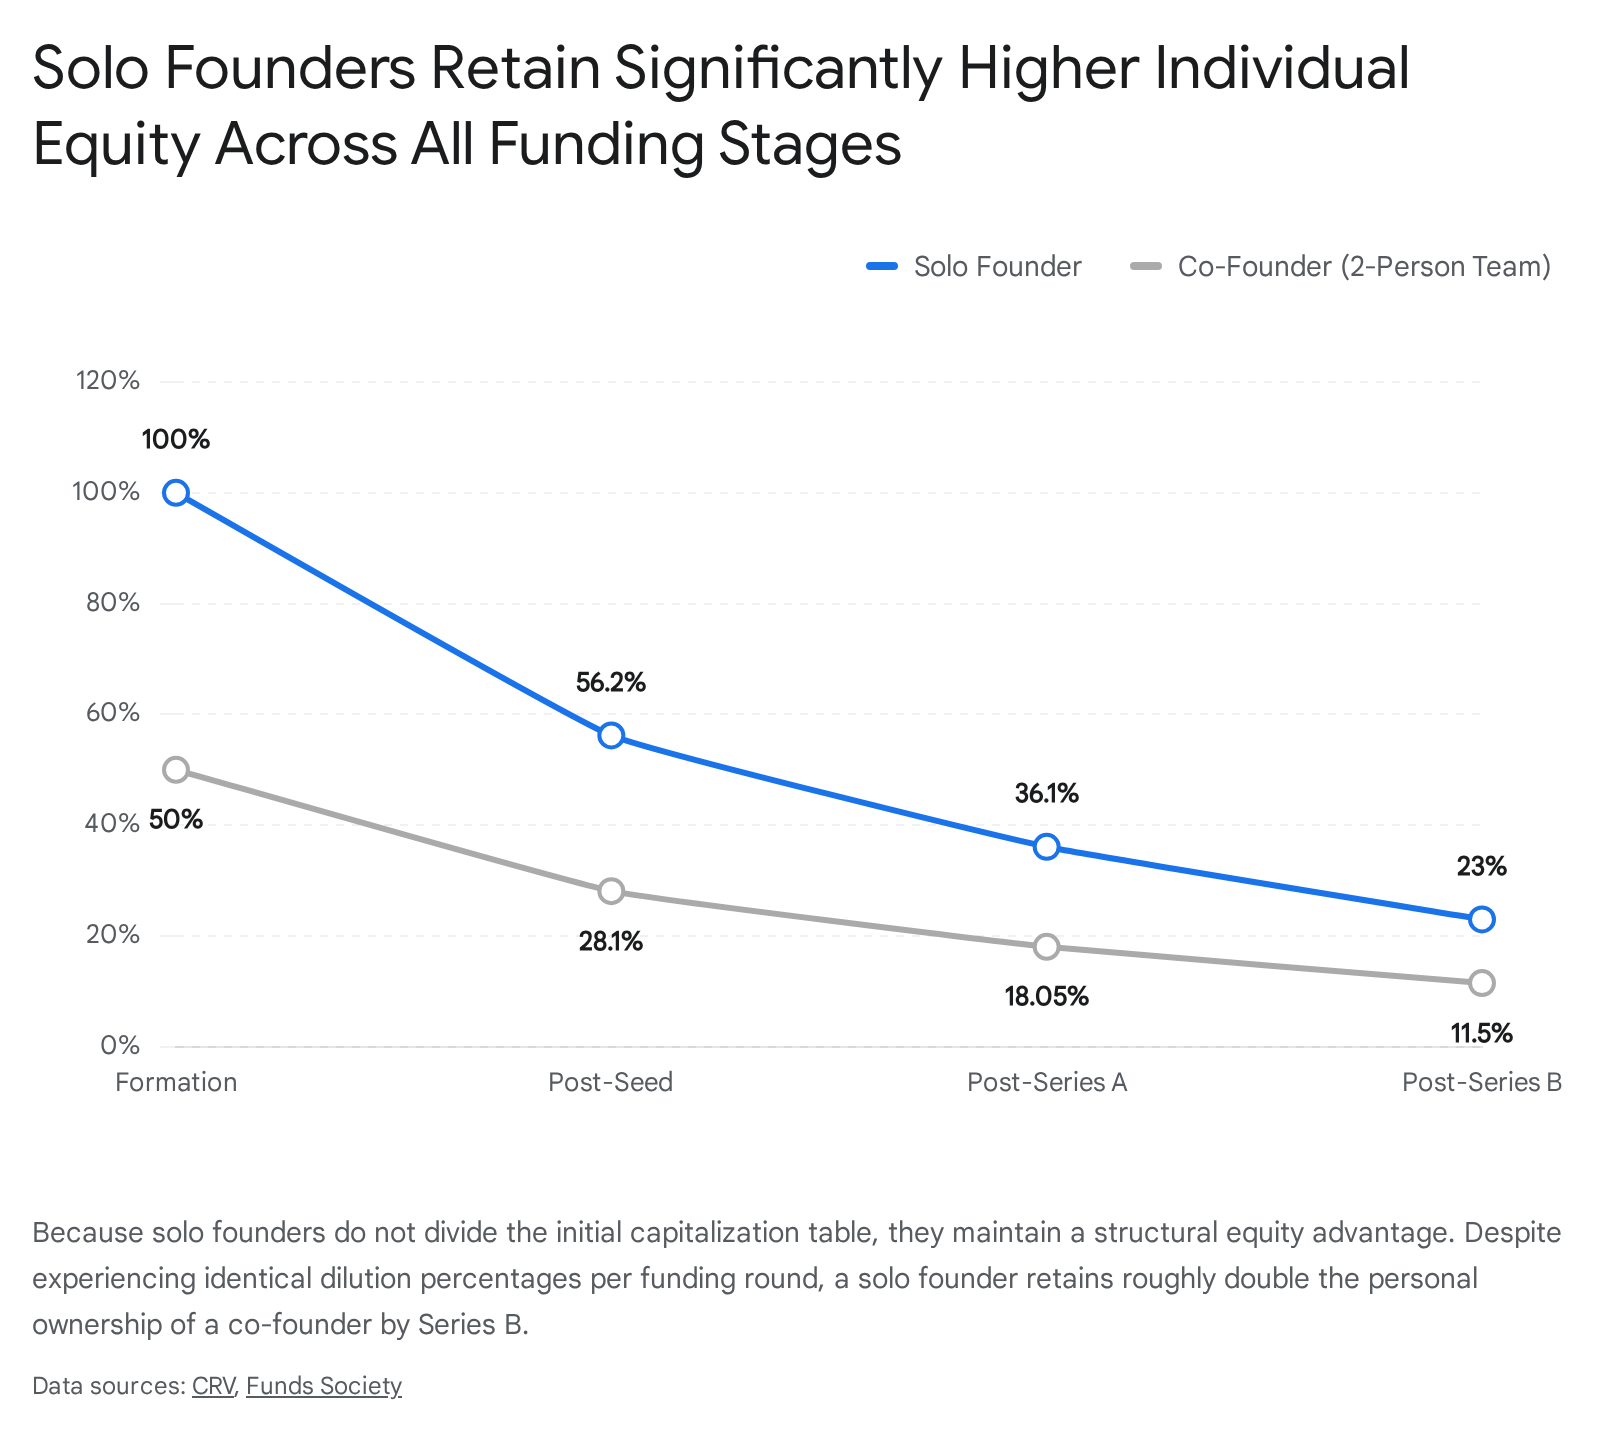
This outsized ownership grants the solo founder significant operational and financial leverage. They can afford to issue larger equity grants to attract premium executive talent without dropping below critical control thresholds. Furthermore, solo founders enjoy unilateral flexibility in accepting acquisition offers, as they do not need to negotiate exit timing, valuation floors, or post-acquisition employment terms with co-founders 3.
Exit Outcomes and Enterprise Valuations
While solo founders maintain tighter control and superior equity positions, multi-founder teams are disproportionately represented in the highest echelons of enterprise valuation. Examining exit data reveals a bifurcation in market outcomes based on team size.
Overall Market Exits and Revenue Generation
In the broader tier of successful mid-market exits, solo founders are highly competitive and arguably dominant. An analysis of Crunchbase data tracking successful startup exits found that 52.3% of successfully exited startups had a single founder 14.
When evaluating companies based on fundamental business metrics rather than venture capital raised, solo founders also perform exceptionally well. Among companies generating $1 million or more in annual revenue, 42% are run by a single founder, compared to 33% by two-founder teams and 15% by three-founder teams 14. However, this narrative shifts when looking at capital-intensive ventures; among startups that have raised over $10 million in total funding, only 45.9% were solo-founded, again reflecting the structural bias of late-stage capital allocators toward teams 14.
The Unicorn Tier and Hyper-Growth Startups
At the extreme upper tail of financial outcomes - startups achieving a private valuation of over $1 billion, known as "unicorns" - multi-founder teams are unequivocally dominant. As of early 2026, there are approximately 1,619 to 1,705 active unicorns globally, representing a combined valuation of roughly $5.2 trillion to $6.8 trillion 81021.
Achieving this rare scale requires hyper-growth, rapid departmental expansion, internationalization, and the ability to manage vast operational complexities. In these environments, a division of labor among co-founders is highly advantageous. A 2024 analysis of unicorn founder DNA by Defiance Capital, alongside regional reports from India, confirms this trend. Over the past decade, 78% of Indian unicorns had two or more co-founders, while solo entrepreneurs founded only 22% (with a heavy concentration in the fintech sector) 22. Furthermore, co-founded unicorns in India generated 32% higher average revenue (₹2,909 crore) compared to their solo-founded counterparts (₹2,196 crore) 2211.
Sector-Specific Operational Dynamics
The efficacy of a founding team configuration is heavily dependent on the specific industry. The technological complexity, regulatory environment, and capital intensity of a sector dictate the optimal team size.
Software as a Service Requirements
Business-to-Business (B2B) Software as a Service (SaaS) represents a massive segment of the startup ecosystem. The median annual revenue growth rate for private B2B SaaS startups is approximately 47.25%, with top-quartile performers exceeding 87% annual growth 24. Because SaaS benefits from zero marginal distribution costs, rapid product iterations, and high gross margins, execution speed and customer acquisition are paramount.
SaaS ventures typically exhibit gradual, linear, or exponential revenue scaling mechanisms 25. In this environment, a multi-founder team featuring a technical product builder and a dedicated go-to-market specialist is highly effective, allowing the company to simultaneously build the platform and aggressively acquire customers. Solo founders also thrive in SaaS due to the availability of cloud infrastructure and AI coding assistants, but they must possess a rare hybrid of engineering and sales acumen.
Deep Technology and Life Sciences
Conversely, "Deep Tech" startups - ventures based on significant scientific or engineering advances, such as robotics, biotechnology, quantum computing, or novel materials - operate on entirely different timelines 25. Deep tech companies experience a prolonged, binary trajectory: they go from zero revenue during years of intense R&D directly to massive enterprise contracts, regulatory approval, or strategic acquisitions 25.
The financial upside in deep tech is substantial; hardware-focused deep tech startups currently deliver a superior gross internal rate of return (IRR) of 27%, compared to 13% for traditional software startups 26. However, because the technical and regulatory barriers are immense, deep tech heavily favors specialized, multi-founder teams. These teams typically require PhD-level domain experts alongside individuals capable of navigating complex federal regulations, clinical trials, and hardware supply chains 1213. Applying standard SaaS advice to a deep tech company is often fatal; deep tech founders must plan for massive capital requirements and multi-year delays before reaching market commercialization 13.
Regional Ecosystem Variations
Global capital markets apply different pressures to team formation based on regional maturity, domestic capital availability, and local regulatory frameworks.
The United States Market
The United States leads the global startup ecosystem with approximately 1.56 million startups and a record 5.5 million business applications filed in 2023 8. With $209 billion in venture capital deployed in 2024, the U.S. market is highly liquid but increasingly concentrated 4. Artificial intelligence startups captured nearly one-third of all U.S. venture capital in 2024, with just four firms (xAI, Databricks, Anthropic, and OpenAI) taking roughly $40 billion 4. In this highly competitive, capital-dense environment, the median time between funding rounds has stretched to over 700 days, forcing both solo and team founders to maintain longer financial runways than during previous economic booms 4.
The Indian Startup Ecosystem
India has emerged as the third-largest startup hub globally, with over 157,000 recognized startups generating more than 1.6 million jobs as of late 2024 14. The Indian market is fiercely competitive and has undergone a severe shift toward operational discipline.
Following a global funding contraction, Indian VC funding rebounded to $13.7 billion in 2024, accompanied by a record 13 startup IPOs raising $3.5 billion 31. However, investors in India now demand clear paths to profitability and sustainable unit economics over pure user growth . Domestic institutional investors are increasingly replacing foreign capital, driving a preference for mature businesses 15. In this disciplined environment, co-founding teams who can divide complex operational tasks to achieve rapid break-even metrics are slightly advantaged, as evidenced by the 78% dominance of multi-founder teams among Indian unicorns 22.
Latin America and Southeast Asia
Emerging markets present unique challenges that influence team formation.
- Latin America: The Latin American ecosystem remains underinvested but is scaling rapidly, with $3.9 billion in venture capital invested in 2023 33. The ecosystem is heavily centralized; 43% of founders in the top 100 LatAm startups are Brazilian, and demographic diversity remains a challenge, with women representing only 5% of top founders 16. Similar to early Silicon Valley dynamics, LatAm currently relies on dense networks and "mafias" (e.g., former employees of successful unicorns like Rappi) to launch new ventures, which natively encourages multi-founder configurations built on existing professional relationships 33.
- Southeast Asia (SEA): The SEA market has experienced a stark valuation reset. Exits and Initial Public Offerings (IPOs) have historically been challenging in the region, leading to a reliance on strategic acquisitions and secondary transactions, which drove a 1.8x increase in exit value in 2024 17. Consequently, SEA investors have become highly cautious, prioritizing long-term value and capital efficiency over rapid scaling 3637. Founders in SEA must build sustainable businesses that do not rely on endless cycles of venture funding, an environment where cohesive, resilient teams are critical to surviving long periods without external capital injection 36.
Conclusion
The debate between solo founding and assembling a team cannot be definitively settled with a universal binary; rather, it represents a strategic trade-off between baseline survival, institutional capital access, and ultimate wealth capture.
For founders optimizing for raw survival, maintaining absolute executive control, and maximizing personal financial return at exit, the solo path is structurally superior. Solo founders bypass the profound friction of co-founder disputes - a leading cause of early-stage mortality - and preserve an un-fractured capitalization table that compounds favorably through successive funding rounds. The rapid advancement of AI tools continues to erode the technical and operational execution barriers that historically necessitated early co-founders, making solo entrepreneurship more viable than at any point in history.
Conversely, for founders targeting hyper-scale, venture-backed "unicorn" outcomes, or operating in highly complex scientific and deep tech domains, a multi-founder team remains the optimal vehicle. Institutional venture capital fundamentally biases toward the risk-mitigation provided by teams, granting co-founded ventures significantly more capital at higher valuations. A cohesive team distributes the immense psychological burden of entrepreneurship and provides the necessary bandwidth to simultaneously manage product architecture, enterprise sales, and organizational scaling. Ultimately, the decision relies heavily on the specific industry, the macroeconomic environment, and the founder's personal tolerance for extreme accountability versus shared equity.