Performance Comparison of Solo Founders and Startup Teams
The structure of a startup's founding team represents one of the earliest and most consequential decisions in the entrepreneurial lifecycle. Historically, conventional wisdom and venture capital investment patterns have overwhelmingly favored multi-founder teams. This consensus operates on the assumption that a diverse portfolio of skills, increased network access, and distributed psychological burdens are fundamental prerequisites for high-growth success. However, recent empirical research - catalyzed by advancements in artificial intelligence, shifting macroeconomic conditions post-2022, and extensive longitudinal datasets - has fractured this established paradigm.
A comprehensive examination of team composition literature reveals that the optimal structure is highly contingent on the chosen metrics of success. While multi-founder teams historically attract more venture capital and achieve higher peak valuations, solo founders exhibit higher baseline survival rates and faster execution speeds. This report analyzes the quantitative research regarding startup team composition, evaluating the performance disparities between solo founders and co-founding teams, the variables determining optimal team size, the impact of personality frameworks and human capital, and the mechanics of equity distribution.
Venture Capital Funding and Valuation Metrics
For decades, the venture capital ecosystem has functioned on the premise that co-founding teams are inherently superior to solo endeavors. This preference is deeply embedded in the funding behaviors of institutional investors and major accelerators, shaping the profile of companies that reach exit velocity.
Historical Baseline for Co-Founding Teams
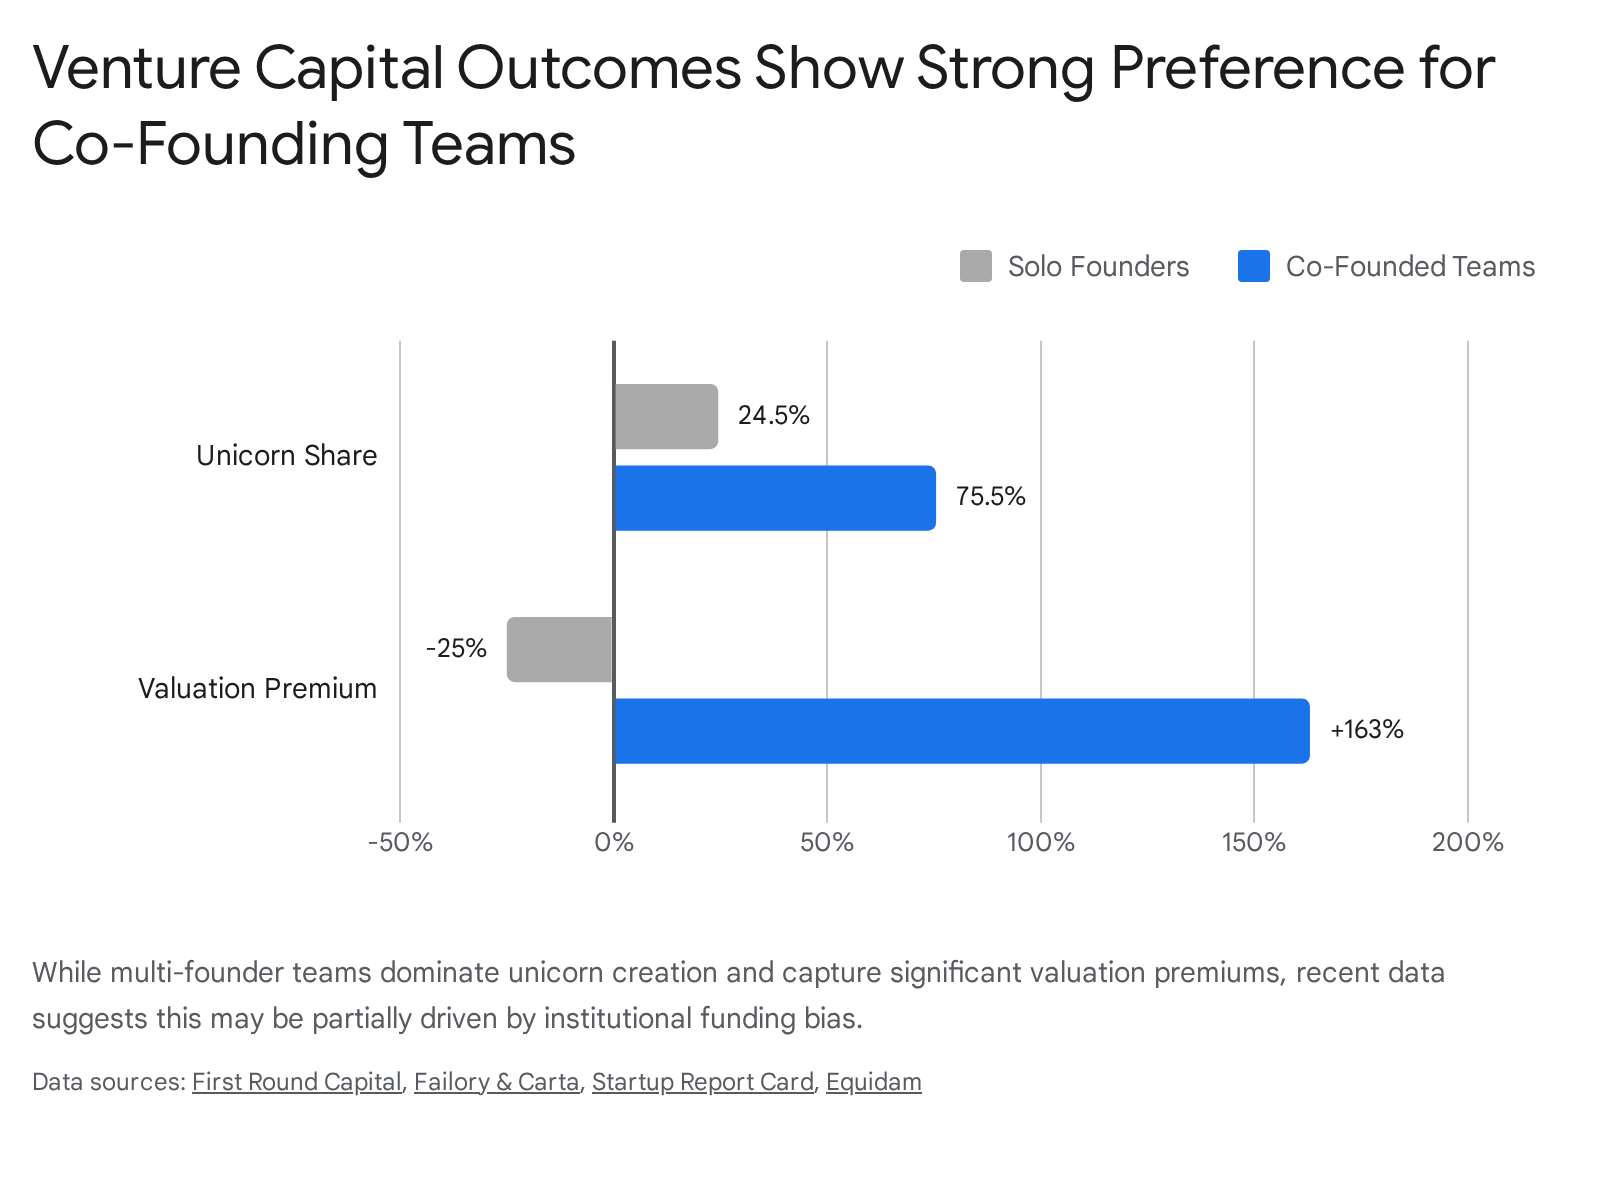
Data tracking venture-backed startups has historically validated the preference for co-founders. First Round Capital's seminal 10-Year Project, which analyzed hundreds of early-stage investments, demonstrated that multi-founder teams outperformed solo founders by 163% in valuation growth 1234. Furthermore, solo founders consistently received seed valuations that were 25% lower than those of their team-based counterparts 134.
This dynamic is heavily reflected in unicorn creation (startups valued at over $1 billion). Research indicates that 75.5% of all unicorns were built by co-founding teams 3.
Institutional investors generally view founding teams as a risk-mitigation strategy, assuming that a team reduces the "bus factor" (the existential risk associated with a single point of failure) while providing a broader array of complementary technical and commercial skills 5. Accelerators like Y Combinator echo this preference; historically, solo founders comprise only about 10% of accepted startups in a given batch, suggesting a significantly higher bar for solo applicants regarding early traction and technical competence 67.
However, researchers and industry analysts caution that these performance metrics may be heavily influenced by selection bias. Because venture capitalists explicitly favor multi-founder teams - creating easier pathways to initial funding, mentorship, and resources - these teams are structurally positioned to appear more successful, creating a self-fulfilling prophecy in venture capital returns 4.
Post-2022 Macroeconomic Shifts in Fundraising
The funding landscape has evolved dramatically following the macroeconomic corrections of 2022. The extended duration required to secure capital directly impacts optimal team strategy. The median time between funding rounds increased from 451 days in 2021 to 744 days by the end of 2024, reflecting tougher fundraising conditions and longer required runways 6.
Furthermore, the "Series A Crunch" has severely restricted early-stage scaling. Only 15.4% of startups that raised a seed round in early 2022 were able to raise a Series A within two years, a 50% drop from the 30.6% success rate recorded in 2018 9. Raising a pre-seed round currently requires three to six months of dedicated outreach, while seed rounds stretch from six to twelve months 10712. Consequently, founding teams with multiple members maintain a distinct operational advantage during capital crunches: a dedicated chief executive can manage the six-month fundraising circuit while a technical co-founder maintains product development velocity 312.
Solo Founder Incorporation and Survival Trends
In contrast to the venture-backed consensus, a growing body of academic research and incorporation data suggests that solo founders not only survive longer under certain conditions but are actively becoming a dominant force in modern company creation.
Demographic Shifts in Incorporation
Global incorporation data indicates a massive shift toward solo entrepreneurship. According to Carta's 2025 Founder Ownership Report, the share of startups launched by a solo founder has surged dramatically over the past decade. In 2017, solo founders accounted for 17% of new startups; by 2023, this figure rose to 29%, and by the first half of 2025, solo founders constituted 36.3% of all new companies 5138.
Despite this incorporation surge, institutional capital remains heavily skewed. While solo founders represented over 35% of all startups launched in 2024, they accounted for only 14.7% to 17% of the ventures that successfully closed a venture capital round, exposing a persistent gap between founder behavior and investor preference 5689.
Technological Accelerants and Execution Velocity
The proliferation of solo founders is directly correlated with technological advancements that reduce operational overhead. Generative artificial intelligence (AI), workflow automation, and no-code platforms serve as massive force multipliers, allowing single individuals to prototype, build, and deploy products that previously required specialized engineering and design teams 13816.
By operating without a team, solo founders maintain complete strategic autonomy and execute decisions rapidly. Data analyzing time-to-milestone metrics reveals that solo founders reach early revenue milestones (e.g., $10K MRR) 12% faster than teams on average 17. Furthermore, solo founders exhibit faster initial hiring velocities, recruiting their first employee at a median of 399 days from incorporation, compared to 480 days for multi-founder teams 8.
For-Profit Survival and Baseline Resilience
Groundbreaking academic research fundamentally challenges the assumption that larger teams are strictly safer investments. A study by Jason Greenberg (NYU Stern) and Ethan Mollick (Wharton) analyzed thousands of ventures funded through crowdfunding platforms - a mechanism that bypasses traditional venture capital gatekeepers and their inherent biases. The researchers found that solo-founded companies survive longer and generate more revenue than team-founded ventures 41011.
The "Sole Survivors" study demonstrated that for-profit ventures launched by lone entrepreneurs were 2.5 times more likely to survive as ongoing businesses than those started by teams 1011. Solo founders were also 55% less likely to dissolve their businesses than teams of three 1011. The researchers theorized that solo founders who achieve early success possess a sufficiently broad array of skills to navigate early hurdles, entirely avoiding the frictional drag, equity disputes, and strategic gridlock that frequently cripple co-founding teams 10.
| Startup Performance Metric | Solo Founders | Co-Founding Teams (2-3+) |
|---|---|---|
| Share of New Incorporations (2024-2025) | 35.0% - 36.3% 138 | 63.7% - 65.0% 138 |
| Share of VC Funding Secured | 14.7% - 17.0% 89 | 83.0% - 85.3% 89 |
| For-Profit Survival Advantage (Non-VC) | 2.5x more likely to survive 1011 | Higher relative risk of dissolution 1011 |
| Execution Velocity (Time to First Hire) | Faster (Median 399 days) 8 | Slower (Median 480 days) 8 |
| Primary Cause of Failure | Capital constraints, resource bottlenecks 20 | Co-founder conflict (65% of failures) 312 |
Variables Determining Optimal Team Size
When entrepreneurs choose to build a team rather than operate solo, determining the precise number of co-founders becomes a critical optimization problem. The data highlights a distinct curve where the benefits of human capital eventually give way to operational complexities.
Coordination Costs and Diminishing Returns
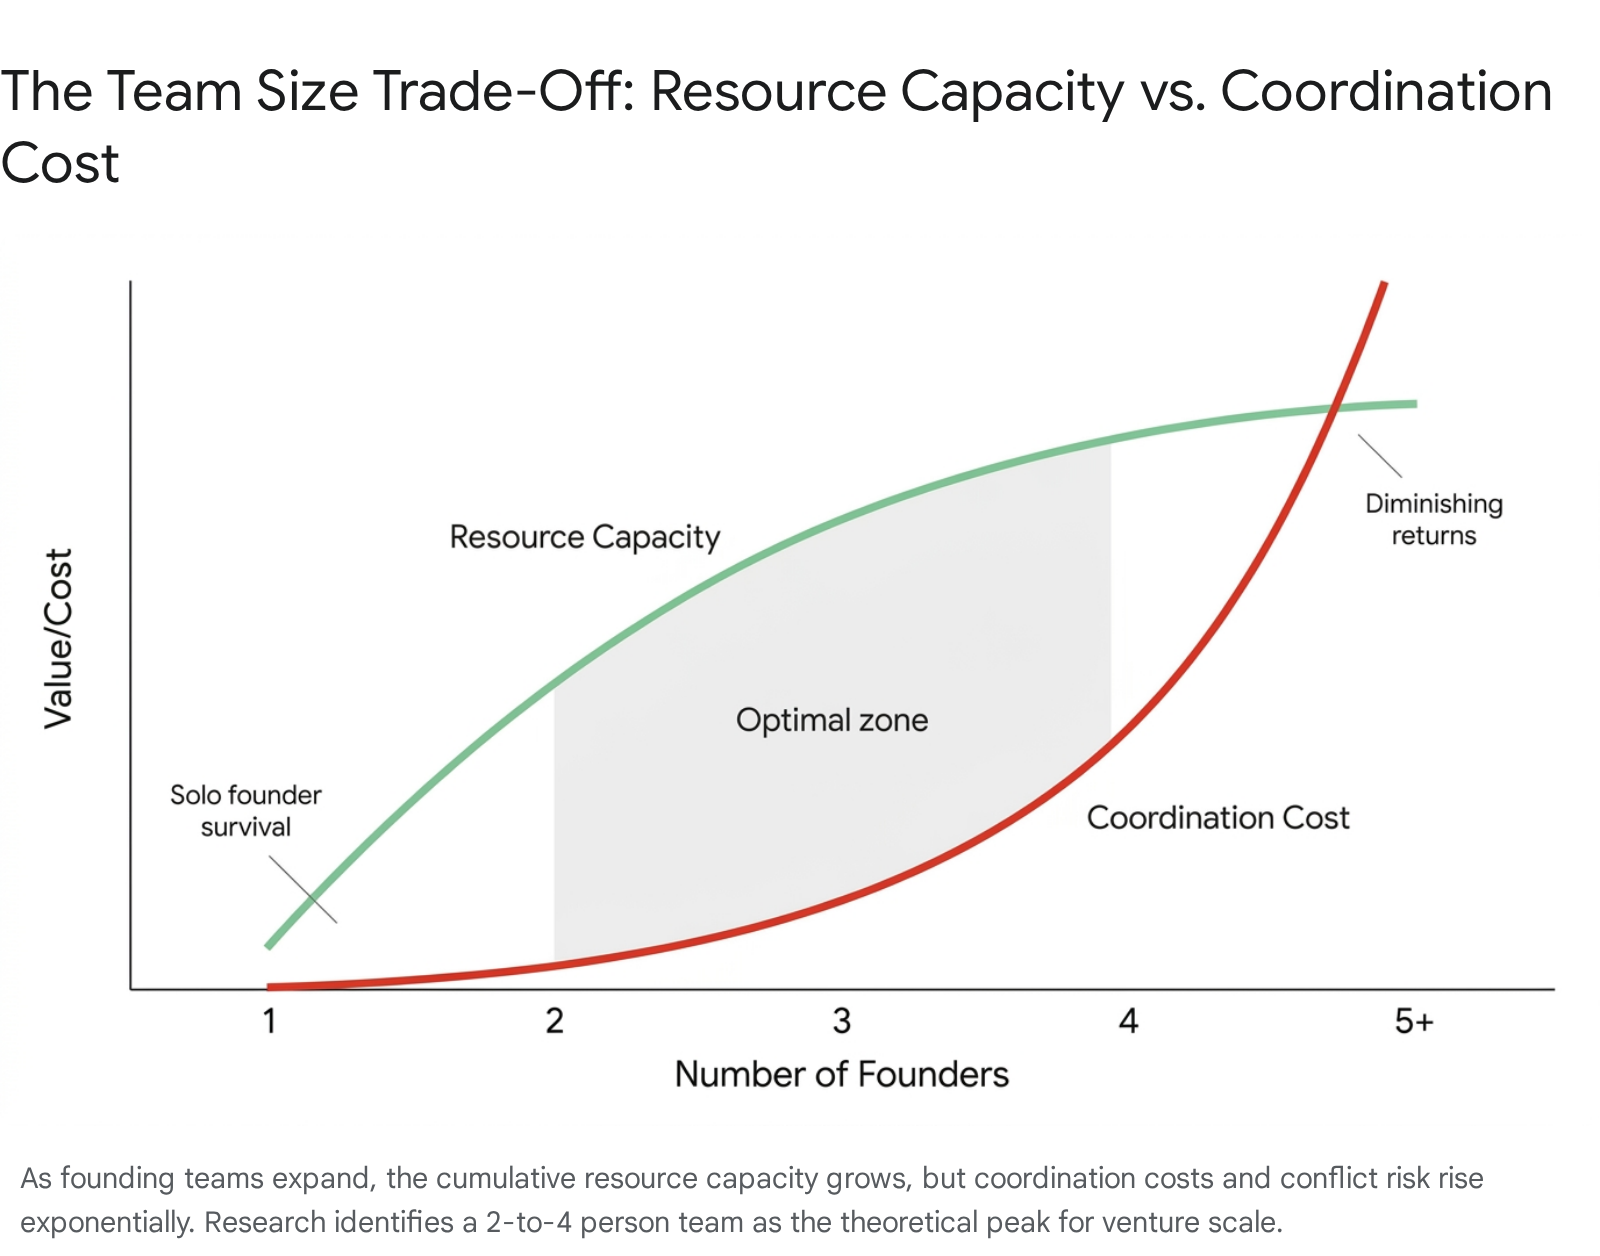
While academic models drawn from the Strategic Management Journal note that larger teams can access more external resources and manage environmental complexity, they inevitably suffer from heightened cognitive conflict, bureaucratic drag, and divided priorities 1314. The friction generated by misaligned visions and unequal effort introduces massive operational drag. Every additional founder increases coordination costs and the risk of power struggles 1113.
Research by Harvard Business School indicates that 65% of high-technology startup failures trace back to co-founder conflicts rather than product deficiencies or market fit 3121516. Therefore, while teams possess higher theoretical resource capacity, their practical execution is frequently derailed by interpersonal instability.
Performance Disparities Between Two- and Four-Person Teams
In the United States, the two-person founding team remains the most frequent arrangement. Within venture-backed cohorts, 37% to 47% of startups have exactly two founders 417. Research indicates that moving from a solo venture to a two-founder team significantly increases investment odds, resulting in 30% more capital raised and three times the customer growth rate 18.
However, when examining peak fundraising outcomes, European data points to a different optimal size. A 2024 analysis by NGP Capital covering 17,836 European tech startups revealed that teams with exactly four co-founders achieved the highest financing rounds, securing 244% more capital than the baseline 192021. This suggests that for highly complex, deep-tech, or enterprise-scale startups, a four-person team provides the optimal coverage of technical, operational, sales, and executive competencies necessary to attract massive institutional capital 1921. Regardless of region, the data shows that once team sizes expand to five or more founders, funding success and operational efficiency sharply decline, with such teams comprising only 4% to 6% of startups 4517.
Human Capital and Founding Team Heterogeneity
Beyond the mere headcount of a team, the internal composition - ranging from personality types to professional backgrounds and demographic diversity - acts as a primary determinant of success.
Founder Personality Traits and Typologies
A comprehensive study conducted by Oxford University and the University of New South Wales analyzed the personalities of over 21,000 startup founders using machine learning classifiers. The research determined that founder personality is a stronger predictor of success than the founder's age or chosen industry 2223. The researchers developed the "FOALED" framework, identifying six distinct founder personality types: Fighters, Operators, Accomplishers, Leaders, Engineers, and Developers 23242526.
The study found that startups succeed not by seeking a single "ideal" personality, but through the synthesis of diverse traits. Ventures possessing a combination of a "Hipster" (Engineer/subject matter expert), a "Hacker" (Fighter/Operator/Developer), and a "Hustler" (Accomplisher/Leader) are twice as likely to succeed as those with homogeneous personality profiles 2326. This aligns with entrepreneurial cognition theory, which posits that a founding team's diverse cognitive structures allow for superior opportunity evaluation, resilience, and venture growth 2227.
Academic and Professional Pedigree
Particularly in regional ecosystems like Europe, academic and professional pedigrees serve as massive signals to investors. The NGP Capital report highlighted that founding teams with advanced degrees, particularly PhDs, secure 66% more funding within the top decile of startups compared to peers without such credentials 192028.
Prior industry experience also yields tangible premiums. European founders transitioning from elite consulting firms (e.g., McKinsey, Bain, BCG) dominate fundraising, collectively securing over $14.3 billion, heavily outperforming purely technical founders 192028. Furthermore, serial entrepreneurs - those with previous startup experience - raise 45% more capital than first-time founders, benefiting from established networks, validated market intuition, and proven operational resilience 182028. First-time founders generally face an 18% overall success rate, whereas entrepreneurs with prior success improve their odds to 30% 1829.
Regional Disparities and Ecosystem Factors
The composition of successful teams also varies by global region, influenced by local market maturity and economic policies.
| Regional Ecosystem | Key Characteristics and Team Trends |
|---|---|
| United States | High concentration of solo founders (36.3%); AI dominance in new ventures (44% of new unicorns); strong preference for 2-person teams in VC 413830. |
| Europe | Strong reliance on academic pedigree (PhDs) and professional services backgrounds (consulting); optimal fundraising occurs with 4-person teams 192128. |
| Southeast Asia & India | Rapid maturation; high focus on profitability (98% of startups); cross-border regional hiring highly prioritized (70% of teams expanding regionally) 3132. |
Heterogeneity extends beyond technical skills into demographic diversity. European teams combining mixed skill sets raise 43% more than the baseline 2021. Gender diversity acts as a further catalyst; mixed-gender founding teams outperform all-male teams in fundraising by 25% (securing an average of $26.9 million versus $21.5 million) 2021. Additionally, teams featuring at least one international co-founder secure 44% more funding than purely local teams, reflecting the value of cross-border networks and diverse market perspectives 2021.
However, severe structural disparities remain. While mixed-gender teams show high performance, startups founded entirely by women receive a disproportionately low share of global venture capital - securing only 1% to 2.3% of total deployed funding in 2024, exposing a massive inefficiency in capital allocation 6.
Equity Distribution and Conflict Mitigation
Because the majority of startup failures originate from internal conflict, the mechanics of how co-founders divide ownership is a matter of existential importance. Equity distribution reflects perceived value, dictates decision-making control, and aligns long-term incentives 1233.
Conflict Rates and Fixed Equity Splits
Historically, the standard approach to equity has been the fixed split, decided at the company's inception based on early negotiations. Recently, there has been a sharp trend toward absolute equality in these early distributions. According to Carta, 45.9% of two-person founding teams incorporated in 2024 split their equity exactly equally (50/50), a notable increase from 31.5% in 2015 5934. The median split for two-founder teams tightened from 60/40 in 2019 to 51/49 in 2024 5934. Startup accelerators strongly advocate for near-equal splits, arguing that unequal distributions demoralize minority founders over the grueling multi-year startup lifecycle 9.
Despite its popularity as a tool to bypass early friction, an arbitrary equal split is frequently cited by legal and operational experts as a critical vulnerability. Startups are highly dynamic; initial assumptions about a founder's long-term value frequently prove inaccurate. When early contributions diverge - such as one founder working full-time while another remains part-time - a fixed 50/50 split creates deep resentment and intractable cap-table friction 1235. Research notes that 40% of founders eventually grow unhappy with their fixed equity arrangements 12.
Dynamic Equity Allocation Frameworks
To combat the rigidity of fixed splits, dynamic equity models - most notably the "Slicing Pie" framework - have gained institutional traction. Rather than relying on static percentages negotiated before company value is established, dynamic models allocate equity on a rolling basis, strictly proportionate to the fair market value of each founder's actual ongoing contributions 123637.
The Slicing Pie model categorizes and weighs contributions using specific multipliers to account for risk. For instance, uncompensated time is typically valued at the founder's market salary rate with a 2x multiplier, while cash investments receive a 1x or 2x multiplier depending on the framework's parameters 1238. By recalculating ownership dynamically, the model claims a near-zero conflict rate regarding equity, compared to a 55% conflict rate in traditional fixed setups 12.
| Equity Distribution Model | Core Mechanism | Conflict Rate and Inherent Risk | Best Applied When... |
|---|---|---|---|
| Unequal Fixed Split | Static percentages (e.g., 60/40) based on initial negotiation. | Moderate risk of minority founder demotivation over time 933. | One founder brings vastly superior capital, proprietary IP, or time commitment. |
| Equal Fixed Split | Static percentages (e.g., 50/50) chosen to avoid early friction. | High risk (55% conflict rate) as roles and efforts diverge over the company lifespan 1235. | Founders have identical historical track records and guarantee equal future commitments. |
| Dynamic Allocation (Slicing Pie) | Fluid percentages adjusting continuously based on tracked inputs (time, cash, IP) 1237. | Near zero conflict rate, as equity mathematically matches actual measured output 12. | Early-stage, highly uncertain environments where founder roles and time commitments remain fluid. |
Regardless of the chosen split mechanism, implementing a vesting schedule is universally recognized as mandatory. The industry standard remains a four-year vesting schedule with a one-year cliff 938. Without vesting, a co-founder who departs after six months could walk away with their full allocation, holding the remaining founders hostage and rendering the venture structurally un-investable to venture capitalists 3338.
Scaling, Survival, and Exit Probabilities
The composition of the founding team deeply influences how a startup navigates the brutal timeline from incorporation to an eventual exit event (such as an acquisition or initial public offering).
Long-Term Survival Metrics Across Cohorts
The macroeconomic reality of company building is incredibly harsh. Overall, approximately 90% of startups ultimately fail 1839. The mortality curve is steepest in the early years: roughly 20% fail within the first year, and 50% to 70% fail between years two and five 18294940. Reaching the ten-year milestone is a statistical anomaly, with only 10% to 34.7% of businesses surviving a full decade, heavily dependent on the sector (e.g., agriculture shows higher stability, while tech and mining show massive attrition) 62940.
As previously noted, solo founders (particularly in non-VC backed environments) demonstrate higher long-term survival rates, successfully avoiding the 23% of startup failures directly attributed to team and co-founder issues 18. The leading cause of failure across all team sizes remains building a product with no market need (42%), followed closely by running out of cash (29% to 38%) and being outcompeted by rivals (19%) 1839.
Exit Mechanisms and Time Horizons
While the average time to exit via Mergers and Acquisitions (M&A) for VC-backed startups currently sits at approximately 6.3 years 51, larger liquidity events like IPOs or major strategic acquisitions routinely take 10 to 15.4 years depending on market conditions 174153. Startups leveraging artificial intelligence have recently compressed this timeline significantly, with the median AI unicorn achieving a $1 billion valuation in just 2 to 3.4 years - often with half the employee headcount of traditional enterprise software companies 63041.
Team Size Correlations with Exit Likelihood
When analyzing exit probability, team size and composition play a measurable role. Data from the Kauffman Firm Survey indicates a positive relationship between team-founded ventures and the likelihood of being acquired, though this benefit diminishes as the team grows excessively large due to the aforementioned coordination costs 42.
Furthermore, survival to later funding stages radically improves exit math. Series A companies exit at nearly double the rate of seed ventures (12% versus 7%), and the probability of a successful exit increases linearly through subsequent funding rounds, reaching 18% at Series B, 22% at Series C, and 29% at Series D 56. Multi-founder teams - by virtue of raising more capital initially and successfully navigating the grueling due diligence of later stages - inherently cluster in these higher-probability exit brackets.
The determination of the optimal startup team composition cannot be reduced to a binary rule. If the primary goal is operational survival, rapid decision-making, and total equity retention, the data strongly supports the solo founder model, empowered by AI and modern digital infrastructure. Conversely, if the objective is venture-scale hypergrowth, unicorn valuation, and institutional investment, a multi-founder team - ideally comprised of two to four individuals with diverse, highly complementary skills - remains the optimal configuration. Regardless of the chosen path, failure to implement rigorous structural safeguards like dynamic equity allocation and vesting schedules will rapidly neutralize any theoretical advantage provided by the team's composition.