
Performance of sector rotation and relative strength trading
Sector rotation and relative strength investing represent two distinct but conceptually aligned methodologies for extracting excess returns from financial markets. Both strategies operate on the premise that capital markets exhibit persistent trends and that leadership among equity cohorts is cyclical rather than static. Sector rotation traditionally relies on a top-down macroeconomic framework to anticipate which industries will benefit from shifting economic phases. Conversely, relative strength - quantified academically as the momentum factor - relies on price behavior, systematically buying recent winners and selling recent losers regardless of the underlying macroeconomic narrative.
Assessing whether trading the strongest names actually works requires a rigorous evaluation of both the theoretical merits of these strategies and their empirical friction in real-world environments. This analysis evaluates the business cycle theory of sector rotation, the academic robustness of the cross-sectional momentum anomaly, the frequency and severity of momentum crashes, and the structural implementation costs that ultimately dictate net profitability for investors.
The Macroeconomic Framework of Sector Rotation
The premise of sector rotation is rooted in the structural cyclicality of the broader economy. Different industries maintain varying sensitivities to macroeconomic inputs, including interest rates, inflation, consumer demand, and commodity prices. Because these variables fluctuate predictably throughout an economic cycle, corporate earnings within specific sectors expand or contract at different times. By tactically overweighting the sectors poised for expansion and underweighting those facing contraction, portfolio managers attempt to generate alpha relative to a static buy-and-hold benchmark.
Business Cycle Phases and Indicators
Economic cycles are typically defined by four distinct phases: expansion, peak (or slowdown), contraction (recession), and trough (recovery). The National Bureau of Economic Research (NBER) formalizes these broad phases based on retrospective data, while investment practitioners often utilize forward-looking indicators like the Conference Board's Leading Economic Index (LEI) to identify cyclical turning points in real time 1. The concept of the business cycle, formalized early on by Wesley C. Mitchell and Arthur F. Burns, relies on the aggregation of cyclical economic indicators to map the expansions and contractions of national economic activity 1.
A theoretical model established by Sam Stovall in the Standard & Poor's Guide to Sector Rotation outlines the sequence in which equity sectors are expected to outpace the broader market 234. Because financial markets are forward-looking discounting mechanisms, equity sector leadership typically precedes the real economic cycle by three to nine months 33.
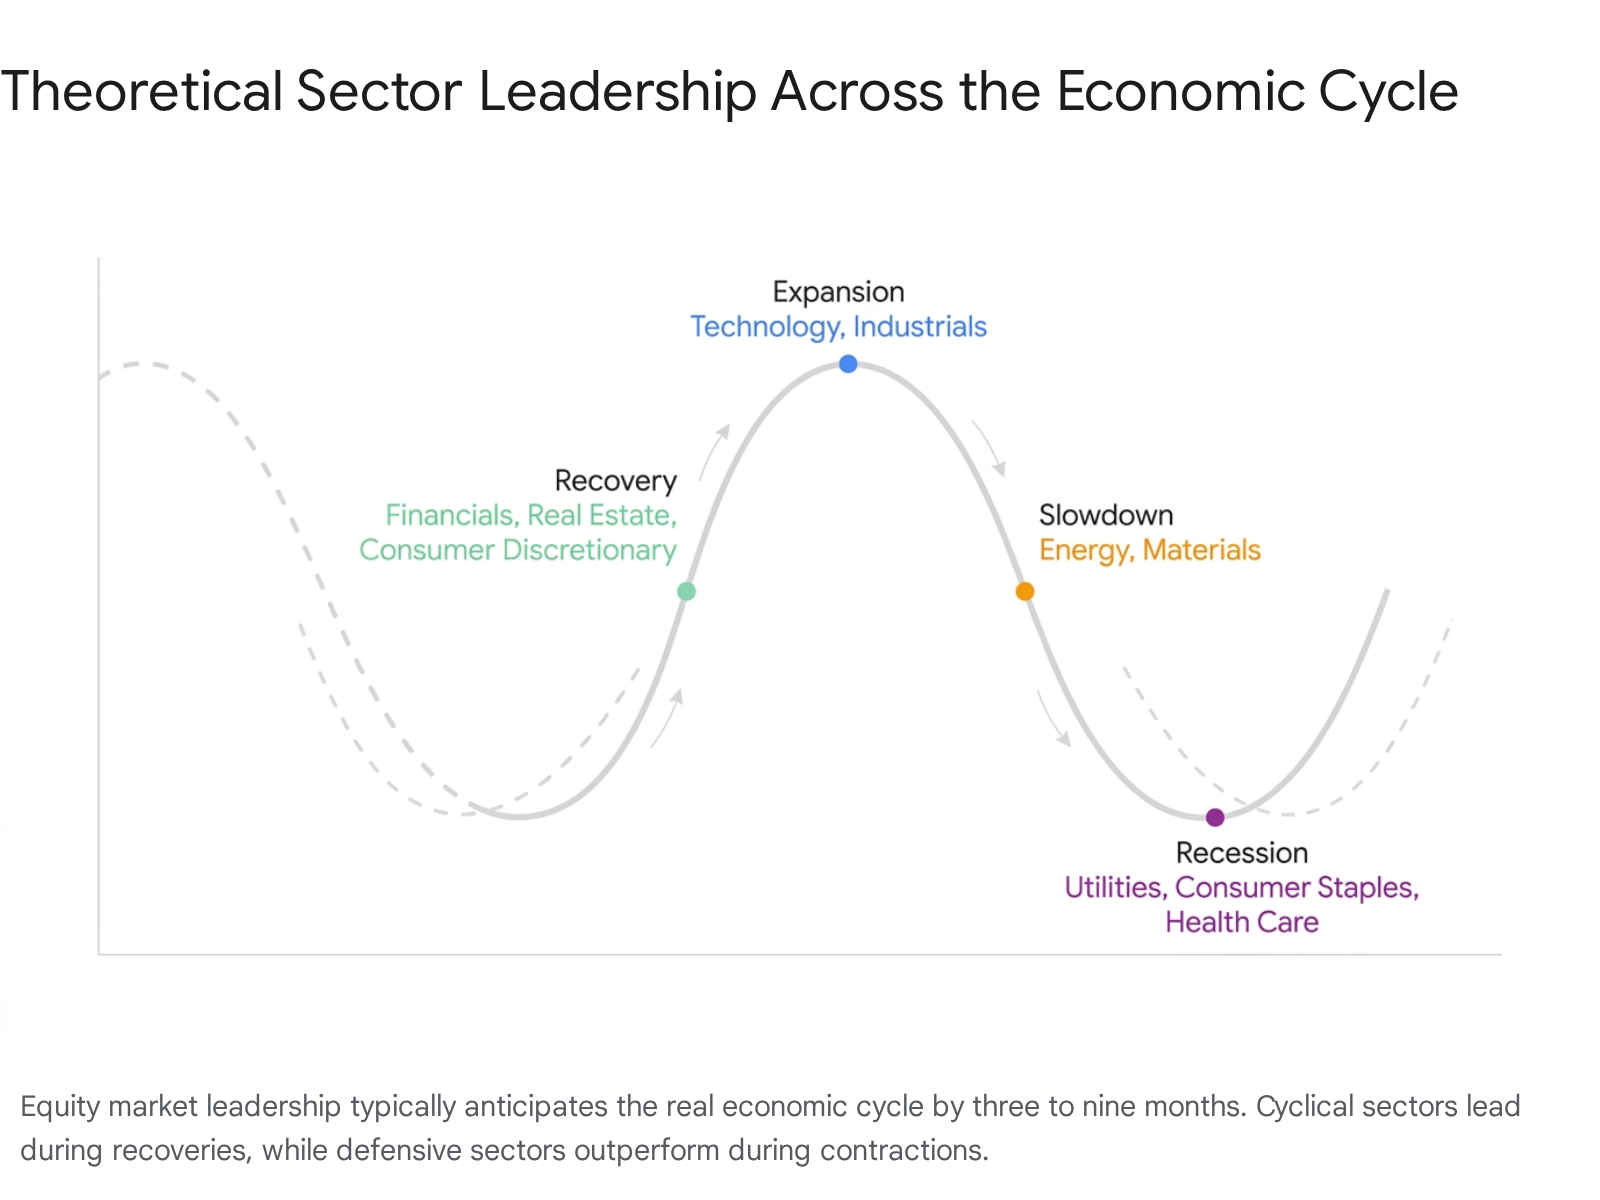
Investors who wait for official economic data to confirm a cycle shift often miss the initial, most profitable stages of the rotation.
Macroeconomic Linkages and Sector Sensitivities
During the early recovery phase, the economy bottoms out and growth begins to accelerate. Monetary policy is typically highly accommodative, interest rates are falling, and the yield curve steepens. This environment structurally favors the Financials sector, which benefits from expanding net interest margins as the spread between borrowing and lending rates widens 4789. Additionally, Consumer Discretionary and Real Estate equities exhibit relative strength, as declining borrowing costs make mortgages and durable goods more affordable, stimulating consumer demand 478.
As the economy transitions into a mid-cycle expansion, growth reaches a positive but stabilizing rate. Capacity utilization increases significantly, and corporations expand capital expenditures. The Information Technology and Industrials sectors traditionally excel in this phase as businesses invest heavily in productivity improvements, software, and manufacturing infrastructure 1. During this prolonged phase, the performance gap between cyclical and non-cyclical sectors often narrows, but cyclical assets generally maintain their advantage 5.
During the late-cycle phase (or economic slowdown), the economy approaches full capacity, triggering inflationary pressures and supply chain bottlenecks. Central banks typically respond by tightening monetary policy and hiking interest rates, leading to a flattening or inverted yield curve 7811. Rising input costs squeeze profit margins for consumer-facing businesses, but commodity producers - specifically the Energy and Materials sectors - often generate peak earnings as raw material prices surge 7811.
Finally, during a recession or contraction, aggregate demand falls, unemployment rises, and corporate profits broadly decline. Capital flows out of economically sensitive cyclical assets and into non-cyclical, defensive sectors. Consumer Staples, Utilities, and Health Care historically exhibit relative strength during recessions due to their inelastic demand profiles; consumers must continue purchasing basic food, electricity, and medical care regardless of economic hardship 14126. High dividend yields in these sectors also provide a buffer against declining equity prices 6.
| Business Cycle Phase | Key Macroeconomic Indicators | Outperforming Sectors | Underperforming Sectors |
|---|---|---|---|
| Early Recovery | Falling interest rates, steepening yield curve, reviving consumer expectations | Financials, Consumer Discretionary, Real Estate | Utilities, Health Care, Consumer Staples |
| Mid-Cycle Expansion | Rising industrial production, stable interest rates, expanding credit | Information Technology, Industrials | Defensive sectors broadly underperform |
| Late-Cycle Slowdown | Rising interest rates, flattening yield curve, peaking inflation | Energy, Materials | Consumer Discretionary, Real Estate |
| Recession | Falling industrial production, inverted-to-normalizing yield curve, rising unemployment | Consumer Staples, Utilities, Health Care | Information Technology, Financials, Industrials |
Empirical Realities of Business Cycle Rotation
While the theoretical framework for sector rotation is economically intuitive, empirical testing reveals significant constraints in executing the strategy profitably over long horizons. Validating the business cycle theory requires analyzing massive datasets spanning multiple decades and distinct economic regimes.
Historical analyses by institutional researchers validate the broad directional accuracy of the business cycle model. Evaluations spanning from 1960 to 2019, covering 7 recessions, 7 recoveries, 12 expansions, and 11 slowdowns, demonstrate clear patterns of sector dominance 4. During recessionary periods, defensive sectors - Consumer Staples, Utilities, and Health Care - have outpaced the broader market by an average of more than 7% to 10% 112. The Consumer Staples sector, in particular, has maintained a near-perfect track record of relative outperformance during economic contractions 6.
Conversely, Real Estate and Technology historically rank among the worst-performing sectors during economic contractions, owing to their heavy reliance on discretionary corporate spending and consumer borrowing 112. During expansion phases, Technology, Financials, and Real Estate consistently post the highest excess returns, with Financials beating the market in 11 out of 13 recorded expansion phases in one comprehensive dataset 14. Real Estate generated average relative returns of 39% during the specific recovery phases following recessions 4.
The Perfect Foresight Problem and Economic Forecasting
The primary hurdle in implementing macroeconomic sector rotation is the severe lag in economic data publication. By the time macroeconomic indicators (such as GDP contractions or revised employment data) officially confirm a transition into a new business cycle phase, the equity market has typically already rotated to price in the new reality 7. The consensus estimates required to identify economic troughs in real time are usually clouded by extreme market pessimism, making timely execution exceedingly difficult for human analysts 7.
Academic research quantifies this timing challenge. Studies testing a sector rotation strategy that assumes perfect foresight - meaning the investor perfectly anticipates NBER business cycle stages before they are officially declared - show surprisingly modest baseline returns. Over a testing period from 1948 to 2022, utilizing Fama and French 49 industry portfolios, a perfect-foresight sector rotation strategy generated a theoretical annual outperformance of only 2.3% above the benchmark 78.
Crucially, once realistic transaction costs are factored into this theoretical model, the excess return diminishes to between 1.1% and 1.9%, rendering the alpha statistically indistinguishable from zero 8. This indicates that even if an investor could perfectly predict the macroeconomic future without error, the frictional costs of constantly rotating capital and the natural variance in sector behavior from cycle to cycle heavily dilute the strategy's net benefits 118. A baseline buy-and-hold strategy often produces superior risk-adjusted returns when accounting for the frequency of mistimed sector shifts and the taxation of short-term capital gains 98.
| Cycle Phase | Top Historical Performers (1960-2019) | Average Excess Return | Performance Consistency (Hit Rate) |
|---|---|---|---|
| Recession | Consumer Staples, Utilities, Health Care | +7% to +10% | Outperformed in 6 of 7 recessions |
| Recovery | Real Estate, Consumer Discretionary | +39% (Real Estate Avg) | High consistency post-trough |
| Expansion | Technology, Financials | +19% to +21% | Financials beat market in 11 of 13 expansions |
| Slowdown | Health Care, Consumer Staples | +15% (Health Care Avg) | Defensive outperformance reliable |
Cross-Sectional Momentum: The Quantitative Alternative
Given the limitations of discretionary macroeconomic forecasting, many practitioners and institutional asset managers substitute fundamental cycle analysis with quantitative relative strength. This systematic approach rotates into sectors, industries, or individual assets exhibiting upward price momentum, agnostic of the underlying economic narrative. In quantitative finance literature, this is formalized as the momentum factor.
Cross-sectional momentum is defined by the tendency of assets that have performed well relative to their peers over a recent look-back period (typically 6 to 12 months, excluding the most recent month to account for short-term mean reversion) to continue outperforming in the near term 91011. The momentum anomaly is one of the most robust and heavily documented phenomena in financial economics, persisting across asset classes, geographies, and centuries of market data 91012. Behavioral economists attribute this persistence to investor underreaction to new fundamental information, followed by herd behavior that extends price trends well beyond fair value 911.
Global Robustness and Factor Superiority
Momentum systematically yields excess returns globally. Historical analyses of momentum factor indices demonstrate that momentum outperforms value, growth, and quality factors across the vast majority of developed and emerging equity markets 131415. Academic surveys assessing price momentum across 40 international markets found significant momentum profits in the Americas, Europe, and Emerging Markets 141516.
For instance, an analysis of the MSCI World Momentum Index over a 31-year period (1994 to 2026) revealed a compound annual growth rate (CAGR) of 11.74%, significantly outpacing standard capitalization-weighted global indices 24. Furthermore, momentum strategies exhibited superior Sharpe ratios in 75% of the global markets tested by researchers, emphasizing the factor's ability to generate favorable risk-adjusted returns despite higher absolute volatility 13.
The Japan Exception
While momentum is globally pervasive, it exhibits one glaring geographical failure: Japan. Extensive academic literature documents that standard momentum strategies yield negligible or even negative excess returns in the Japanese equity market 1718. The failure of momentum in Japan has historically led some skeptics to question the factor's universal viability, suggesting the anomaly might be a product of data mining rather than a structural market feature.
However, advanced factor research rejects this interpretation. Researchers, including Clifford Asness, have demonstrated that because the momentum and value factors are strongly negatively correlated, studying them as a combined system reveals deeper insights 1718. When evaluated as a unified portfolio, the results in Japan are perfectly consistent with value and momentum working everywhere at similar combined levels. Because value historically performed exceptionally well in Japan during periods when momentum failed, a 50/50 portfolio of value and momentum in Japan produced strong, statistically significant Sharpe ratios 17. Thus, the Japanese momentum results are viewed by institutional quants as the exception that proves the rule regarding multi-factor portfolio construction.
Industry Momentum Versus Single-Stock Momentum
A critical distinction exists in the literature between applying relative strength to individual securities versus applying it to aggregated sectors or industries. For practitioners of sector rotation, this distinction is paramount.
Academic findings, notably the seminal 1999 paper by Moskowitz and Grinblatt, reveal that the momentum effect observed in individual stocks is largely subsumed by industry momentum 102719. When researchers control for industry performance, the profitability of purely buying past winning stocks and selling past losing stocks drops significantly, sometimes becoming statistically insignificant 27.
Conversely, strategies that buy stocks from past winning industries and sell stocks from past losing industries remain highly profitable, even after controlling for traditional risk factors such as size, value, individual stock momentum, and microstructural liquidity issues 27. Sector-level momentum is driven by clustered productivity shocks and synchronized macroeconomic sensitivities that affect entire cohorts of companies simultaneously 920.
Because stocks within a narrowly defined sector or industry share correlated macroeconomic risk factors, establishing a relative strength strategy utilizing broad sector classifications captures the core momentum premium while structurally diversifying away the idiosyncratic risk of individual corporate failures 2030. Vanstone, Hahn, and Earea demonstrated explicitly that industry momentum captured through sector ETFs is more profitable and reliable than individual stock momentum in the United States 9.
Risk Profiles and Momentum Crashes
The most significant risk inherent to relative strength and momentum strategies is vulnerability to sudden, catastrophic drawdowns known as "momentum crashes." Because momentum strategies systematically concentrate capital in recent winners and avoid (or short) recent losers, they dynamically alter their market beta and risk exposures over time. In a sustained bull market, momentum portfolios load heavily on high-beta, pro-cyclical assets. In a protracted bear market, momentum portfolios inevitably rotate into low-beta, defensive assets to protect capital 911.
When markets experience sharp inflection points - particularly violent, rapid recoveries following deep economic crises - momentum strategies suffer catastrophic losses. The mechanism is straightforward: momentum strategies are implicitly short volatility. During a market panic, the strategy rotates into defensive names. When the market suddenly bottoms and violently reverses upward, the deeply oversold, low-quality stocks (the "losers" that the momentum strategy is avoiding or actively shorting) surge dramatically 9. Concurrently, the defensive stocks that had held up well during the crash (the "winners" currently held in the portfolio) stagnate as risk appetite returns.
The archetypal momentum crash occurred in 2009. During the initial months of the post-financial-crisis rally, prior momentum leaders (defensives, healthcare, staples) underperformed massively while deeply distressed financials and cyclicals surged over 100% 9. This dynamic resulted in pure individual-stock long-short momentum strategies suffering their worst drawdowns in decades, wiping out years of accumulated alpha in a matter of weeks 9. Momentum crashes tend to happen precisely when markets are most volatile and uncertain, making them a feature of the strategy rather than a bug 31.
Drawdown Mitigation via Sector Rotation and Quality Overlays
While sector-based rotation relies on the exact same relative strength mechanics as stock-level momentum, the aggregation of stocks into sector indices structurally reduces crash severity. Because sectors are inherently diversified internally, they dampen the extreme volatility of low-quality, distressed equities that typically fuel momentum crashes.
Empirical data confirms this mitigation. During the 2008 - 2009 financial crisis, an academic single-stock momentum factor strategy (UMD) experienced a devastating maximum drawdown of -57.53% 2032. In contrast, a 10-sector relative strength rotation strategy operating over the exact same period suffered a much shallower maximum drawdown of -34.62% 2032. While trading broad sectors rather than individual equities inherently dilutes the absolute maximum return potential of the pure momentum factor, it achieves a commensurate - and often highly desired - reduction in left-tail crash exposure 20.
Furthermore, institutional practitioners often combine momentum with quality factors to further suppress crash risk. Research by Novy-Marx and AQR demonstrates that filtering momentum portfolios by profitability metrics (such as Return on Equity above 15% or high gross margins) significantly reduces drawdowns without sacrificing long-term returns 31. High-quality stocks with strong balance sheets are far less likely to experience the violent, distressed-reversal rallies that traditionally trigger momentum crashes 31.
| Strategy Design | 2008-2009 Max Drawdown | Crash Vulnerability | Idiosyncratic Risk Exposure |
|---|---|---|---|
| Pure Single-Stock Momentum | -57.53% | Extreme | High |
| 10-Sector Rotation (Relative Strength) | -34.62% | Moderate | Low (Diversified) |
| Momentum + Quality Filter Overlay | Significantly Reduced | Low to Moderate | Moderate |
Implementation Frictions and Transaction Costs
Theoretical factor research and academic backtests routinely ignore market friction. However, extracting alpha from relative strength requires frequent portfolio rebalancing. Momentum signals decay rapidly, necessitating monthly or quarterly turnover. Consequently, transaction costs are the ultimate determinant of whether sector rotation actually works in practice for live capital.
Turnover, Bid-Ask Spread, and Slippage
Momentum is an inherently high-turnover strategy. Empirical data on live momentum funds indicates average one-sided net turnover rates ranging from 80% to 200% annually 332122. Every reallocation incurs multiple layers of transaction costs: explicit brokerage commissions, implicit bid-ask spreads, market impact (slippage), and tax liabilities generated by short-term capital gains 223623.
Early academic studies, such as the influential 1997 paper by Keim and Madhavan, as well as Lesmond, Schill, and Zhou (2003), concluded that the gross profits of momentum strategies are largely "illusory" once real-world trading costs are applied 192223. These studies identified that traditional unconstrained momentum screens heavily favor small-cap, illiquid stocks, which carry prohibitive bid-ask spreads and severe market impact costs.
For small-cap momentum portfolios, studies estimate that total trading costs can range from 7% to 9% per trade. When factoring in 150% to 200% annual turnover, total annual trading costs range from 10% to 18%, effectively erasing all theoretical gross profits and generating negative net returns for investors 22. Without institutional execution algorithms, attempting to trade pure small-cap momentum is structurally unprofitable.
The Large-Cap and ETF Advantage
Implementation viability drastically improves when the strategy universe is restricted to highly liquid large-cap stocks or aggregate sector indices. Institutional analyses of live large-cap momentum strategies demonstrate that while expenses and trading costs create measurable drag, a substantial net premium survives.
A 2017 study by Israel, Moskowitz, Ross, and Serban analyzing AQR's live momentum funds from 2009 to 2016 showed that large-cap momentum strategies outperformed theoretical benchmarks once optimized for execution 33. In live environments, trading costs subtracted an average of only 12 to 23 basis points (bps) annually for large-cap allocations, with fund expenses subtracting roughly 40 to 54 bps 3321. This leaves a significant portion of the historical momentum premium intact for investors.
For self-directed investors and tactical managers, sector rotation via Exchange Traded Funds (ETFs) presents the most cost-efficient execution model available today. Broad US sector ETFs (such as the SPDR Select Sector funds) feature annual expense ratios ranging from 0.09% to 0.20%, combined with penny-wide bid-ask spreads and zero-commission structures at most modern brokerages 3839.
By relying on high-capacity sector ETFs rather than mutual funds (which charge 0.50% to 1.50% and restrict trading to end-of-day NAV), investors can harvest industry momentum with minimal slippage 273839. Studies constructing simple, equal-weighted portfolios of the top-performing sector ETFs, rebalanced monthly, confirm that such strategies consistently outperform the S&P 500 on a net-return basis while lowering maximum drawdowns, proving that the strategy is viable when frictional costs are structurally minimized 3024.
| Implementation Vehicle | Est. Annual Turnover | Expense Ratio / Explicit Costs | Implicit Trading Costs (Spread/Slippage) | Strategy Viability Post-Friction |
|---|---|---|---|---|
| Small-Cap Single Stocks | 150% - 200% | High (Commissions) | Severe (10.0% - 18.0% annually) | Unprofitable; gross returns erased |
| Large-Cap Single Stocks | 80% - 100% | Medium (40-54 bps fund fees) | Low (~0.12% - 0.23% annually) | Profitable; net premium survives |
| Actively Managed Mutual Funds | Varies | High (50-150 bps) + Loads | Hidden in NAV | Marginal; fees erode alpha |
| Sector ETF Rotation | 50% - 100% | Very Low (9-20 bps) | Minimal (Penny-wide spreads) | Highly Profitable; scalable & efficient |
Seasonal Overlays and Strategy Enhancements
Beyond pure relative strength and business cycle tracking, researchers have identified seasonal anomalies that can enhance sector rotation strategies. The most widely documented is the "Sell in May and Go Away" (SMGA) or Halloween Effect. Academic studies confirm that average market returns tend to be systematically higher in the months of November through April compared to May through October 25.
A sophisticated sector rotation strategy can leverage this anomaly by holding pro-cyclical sectors (Technology, Industrials, Consumer Discretionary) during the strong November-April period, and rotating into defensive sectors (Consumer Staples, Utilities) during the weaker May-October period 225. Studies show that overlaying this seasonal bias with a traditional relative strength model provides significant incremental alpha, particularly when utilized to manage net market exposure dynamically 25.
Recent Market Dynamics: The 2020-2024 Regime
The macroeconomic environment from 2020 to 2024 served as an extreme stress test for sector rotation and relative strength frameworks. Exiting the early 2020 pandemic trough, the global economy experienced an aggressive, compressed early-cycle recovery driven by unprecedented fiscal stimulus. This was followed rapidly by a late-cycle inflationary shock, supply chain crises, and the most aggressive central bank rate-hiking cycle in recent history 726.
This violent regime shift induced historic dispersion in sector performance, validating the necessity of dynamic allocation. From the November 2020 election through November 2024, the broader S&P 500 Index returned approximately 81% 43.
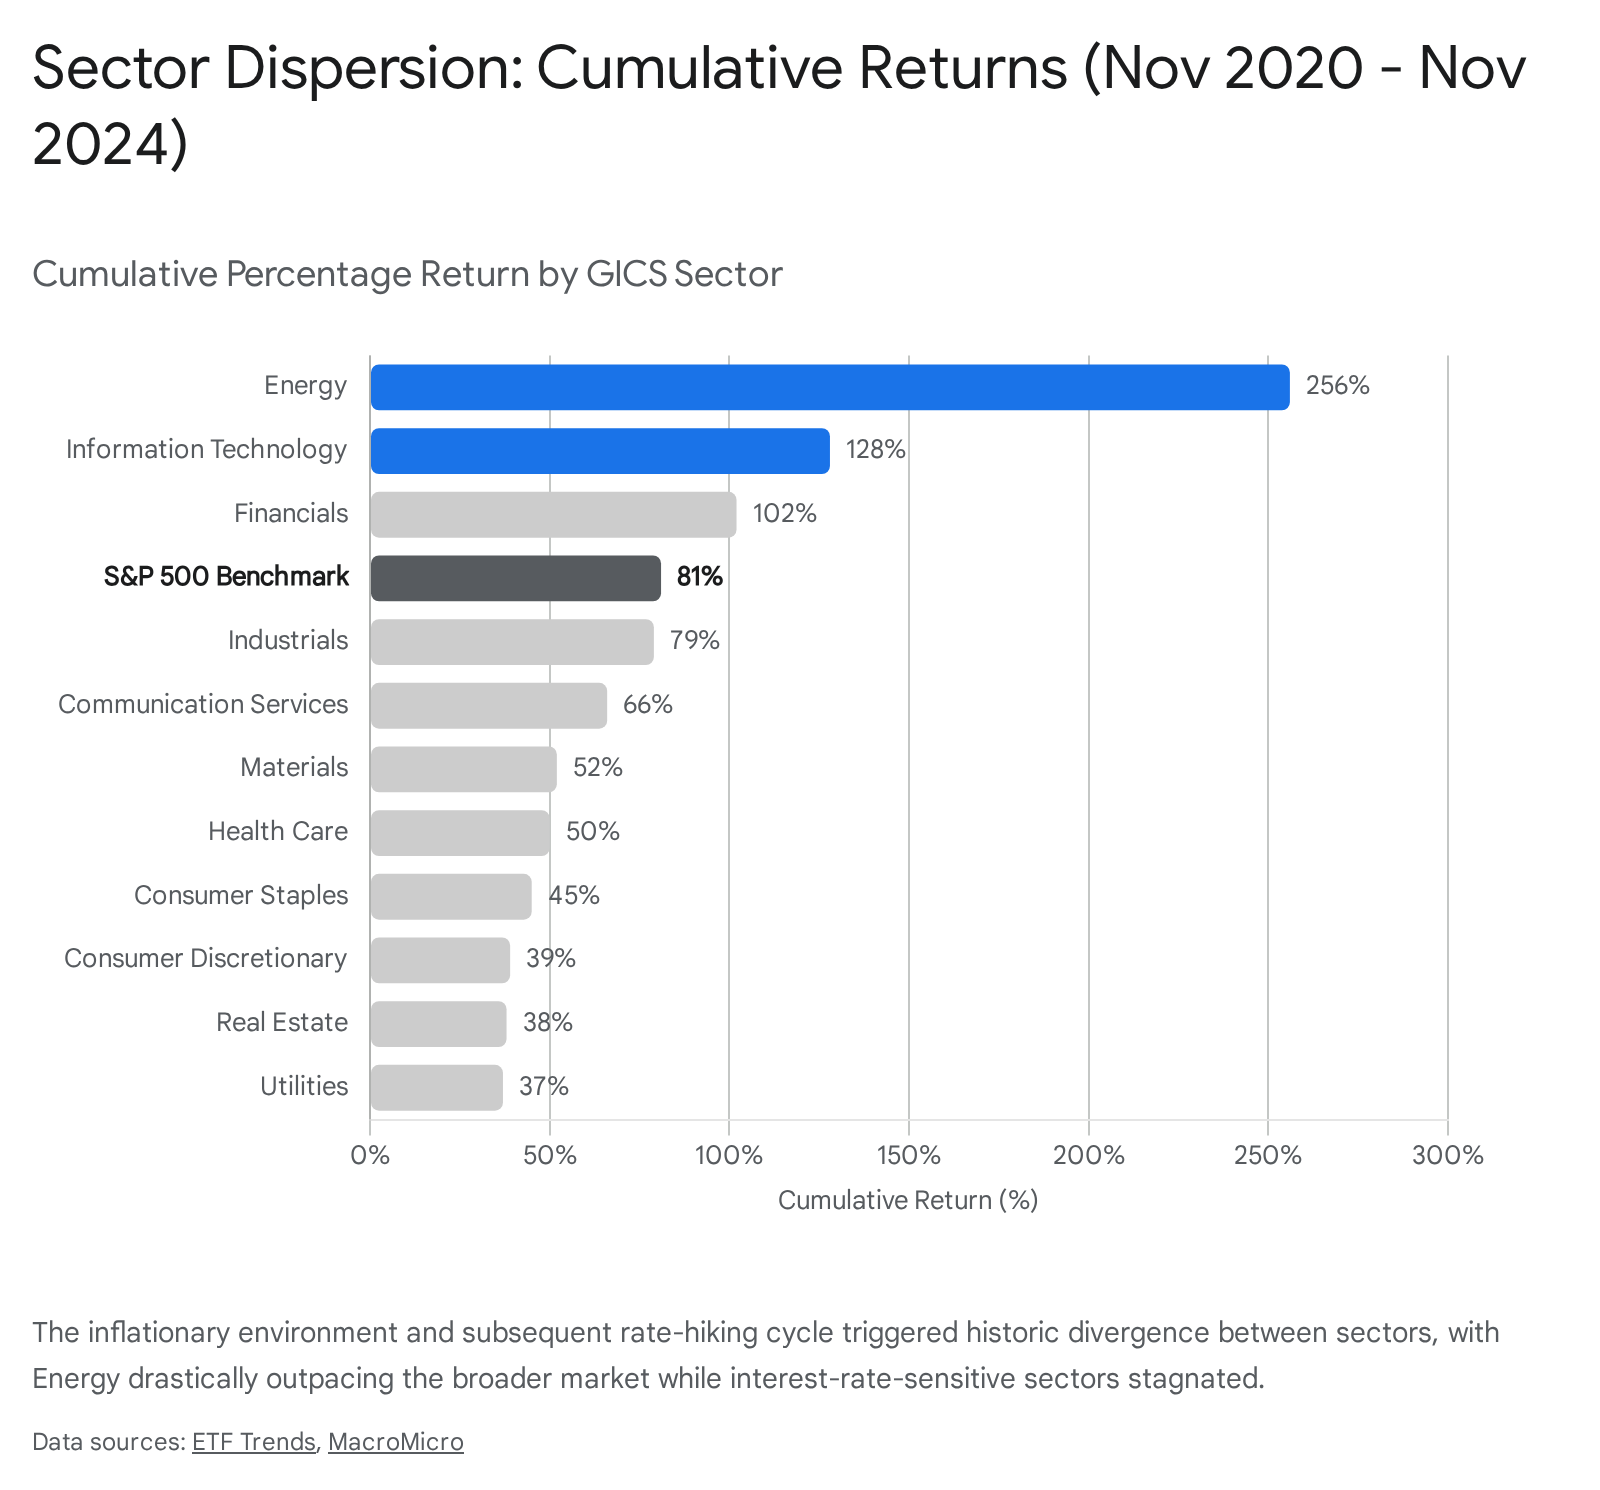
However, performance at the sector level diverged massively, creating an environment where static buy-and-hold portfolios suffered severe opportunity costs:
- The Energy sector - buoyed by the inflation shock, constrained global supply chains, and rising commodity prices - climbed an astonishing 256%, becoming the undisputed momentum leader of the period 43.
- The Information Technology sector - fueled initially by low interest rates and subsequently by massive capital expenditures into artificial intelligence - returned over 164% 4327.
- Conversely, defensive and highly interest-rate-sensitive sectors lagged the benchmark severely as the cost of capital rose. Utilities gained just 37%, while Real Estate posted effectively flat or slightly negative cumulative returns (-0.17%) over the multi-year period 4327.
The magnitude of this dispersion definitively validates the central thesis of relative strength. While fundamentally timing these macroeconomic shifts in real time using employment or GDP data proved precarious for many analysts, systematic price-momentum strategies naturally gravitated toward the Energy and Technology sectors as their relative strength established itself in the price action.
Conclusion
The question of whether trading the strongest names actually works can be answered affirmatively, though with significant structural caveats. Sector rotation based purely on macroeconomic forecasting is theoretically sound but empirically flawed; the lag in economic data publication and the requirement for near-perfect foresight make discretionary business cycle timing exceedingly difficult to execute profitably over the long term.
However, substituting discretionary macro forecasting with systematic relative strength - the momentum factor - yields robust, globally pervasive excess returns. Academic evidence strongly suggests that the momentum anomaly is driven primarily at the industry and sector level rather than the individual stock level. Consequently, implementing a relative strength strategy via broad, highly liquid sector ETFs offers the optimal path for investors. This approach captures the macroeconomically driven "industry momentum" anomaly, structurally minimizes the catastrophic drawdown risk associated with single-stock momentum crashes, and expertly circumvents the frictional bid-ask spreads and transaction costs that routinely erode theoretical academic profits. When executed with discipline, low-cost instruments, and an awareness of regime shifts, sector rotation based on relative strength remains a highly viable methodology for generating market outperformance.