Net market returns of moving average crossover systems
Moving average crossover systems represent a foundational methodology in quantitative finance, systematic trading, and technical analysis. These systems generate directional market signals based on the interaction between two or more moving averages of an asset's price. The standard configuration triggers a long position when a shorter-term moving average crosses above a longer-term moving average, and a short position or liquidation when the reverse occurs. The core premise assumes that past price sequences contain embedded, exploitable information regarding future price trajectories.
The central research inquiry evaluating whether these systems systematically beat the market after accounting for transaction costs reveals a stark division between theoretical, gross profitability and realized, net returns. Exhaustive analysis of historical data, market microstructure, and institutional portfolio construction indicates that isolated moving average crossover strategies applied to single assets generally fail to outperform a buy-and-hold benchmark after trading frictions are deducted. However, when these mechanics are abstracted into generalized time-series momentum frameworks and deployed across highly diversified, volatility-scaled multi-asset portfolios, the underlying anomaly continues to demonstrate statistically significant, positive net risk-adjusted returns over extended multi-decade horizons.
Theoretical Mechanics of Moving Averages
To assess the economic viability of moving average crossovers, it is necessary to establish their mathematical and structural function within the broader context of asset pricing anomalies. Academic literature demonstrates that moving average crossovers are mathematically equivalent to time-series momentum (TSMOM) strategies in their most generalized forms 12.
Equivalence to Time-Series Momentum
Time-series momentum strategies buy assets that have exhibited positive past returns and sell assets that have exhibited negative past returns over a defined lookback period 13. Research unifying disparate technical trading rules proves that moving average crossovers act as linear trend filters functionally identical to TSMOM, the Hodrick-Prescott filter, and the Kalman filter 134. The parameters selected by a quantitative analyst - such as the ubiquitous 50-day and 200-day lookback windows - are simply specific configurations of a time-series momentum filter designed to separate directional price persistence from statistical market noise 56.
These filters capture the same market underreactions, fundamental macroeconomic shifts, and behavioral herding dynamics that drive standard momentum factors 4. Consequently, the debate surrounding the profitability of moving average crossovers is synonymous with the academic debate surrounding the profitability of systematic trend following. Both rely on the tendency of asset prices to systematically underreact to new fundamental information, causing gradual price adjustments that linear filters can capture 4.
Simple Versus Exponential Models
Within this framework, the specific mathematical calculation of the moving average heavily dictates the system's sensitivity to recent data and its susceptibility to false signals. The two most prominent variations utilized in algorithmic design are the Simple Moving Average (SMA) and the Exponential Moving Average (EMA).
| Feature | Simple Moving Average (SMA) | Exponential Moving Average (EMA) |
|---|---|---|
| Weighting Mechanism | Assigns equal weight to all data points within the specified lookback period 8910. | Assigns an exponentially decreasing weight to older data, prioritizing recent closing prices 89. |
| Price Responsiveness | Slower to react to sudden price shifts, creating significant mathematical lag during rapid market transitions 1112. | Highly responsive to recent price action, reducing lag and highlighting short-term momentum shifts 81013. |
| Primary Use Case | Establishing long-term macroeconomic trend direction and identifying major dynamic support/resistance levels 1014. | Short-term momentum trading, rapid tactical entries, and capturing early trend formations 131415. |
| System Vulnerability | Extended lag can result in late entries and late exits, relinquishing a significant portion of the trend's total profit 1112. | Heightened sensitivity increases susceptibility to false signals (whipsaws) in volatile, non-trending market regimes 125. |
Shorter-term quantitative traders often utilize the EMA because it tracks closer to the immediate price action, whereas the SMA is preferred for macroeconomic trend identification due to its smoothing properties 813. However, regardless of the mathematical smoothing technique applied, both variations are fundamentally lagging indicators based entirely on historical price data, meaning they cannot predict future price movements but merely confirm existing trajectories 125.
The Friction of Execution and Whipsaw Costs
The divergence between gross returns (theoretical, friction-less profitability) and net returns (actual realized capital accumulation) is the primary reason simple crossover systems fail to beat market benchmarks over time. Moving average crossovers are inherently trend-following systems; they are designed to capture the positive skewness, or "fat tails," of sustained market trends 5. This convexity, however, comes at a continuous operational cost incurred during periods of market consolidation, mean-reversion, or high-volatility chop.
Mechanics of the Whipsaw Phenomenon
In a ranging or sideways market, moving average crossover systems generate frequent, false trading signals 12176. A short-term moving average will repeatedly cross above and below a long-term moving average as the asset price oscillates within a narrow band. This triggers successive buy and sell executions that result in small, incremental capital losses 1219. This phenomenon, known in quantitative finance as a "whipsaw," is the fundamental mechanism of baseline capital erosion in trend-following models 1920.
Historical analysis of the traditional 200-day moving average crossover indicates the severity of this issue. Since 1960, the S&P 500 has crossed above its 200-day moving average 187 times, yet only approximately 28% of those trades turned out to be profitable 17. The system's long-term profitability relies entirely on the magnitude of the minority of winning trades drastically exceeding the cumulative sum of the numerous small whipsaw losses incurred during sideways regimes 19. A strategy requiring a 33% win rate relies heavily on maximizing the reward-to-risk ratio of its profitable trends 6.
Structural Execution Costs
Each whipsaw trade subjects the portfolio to execution friction, transforming a theoretical zero-cost environment into a negative-sum reality. The transaction costs that actively erode moving average crossover returns include explicit brokerage commissions, the bid-ask spread, and slippage 21723.
Brokerage commissions represent the explicit fees charged per trade execution. While institutional trading fees have compressed significantly in modern markets, they historically presented a severe drag on high-turnover crossover strategies 78. The bid-ask spread represents the implicit cost of crossing the market to execute an order, which becomes particularly punitive in less liquid assets or during high-volatility environments where market makers widen spreads to protect against adverse selection 15219. Slippage is the difference between the expected price of a trade at the time the algorithmic crossover signal is generated and the actual price at which the trade is ultimately filled 212326. Because moving average crossovers often rely on universally observed parameters, they trigger signals concurrently with thousands of other market participants, leading to crowded entry points and severe execution slippage 527.
When evaluated over multi-decade horizons, academic simulations consistently demonstrate that the wedge between gross and net equity returns driven by transaction costs is substantial 78. High-frequency moving average strategies that generate daily or weekly signals frequently exhibit gross annualized returns that easily exceed market benchmarks, but routinely post negative returns once realistic slippage and commission models are applied 21.
In a comprehensive analysis of 135 years of financial data evaluating time-series momentum across 67 global markets, gross annualized returns of 18.0% were degraded to 11.0% net returns after modeling historical transaction costs and institutional fee structures 810.
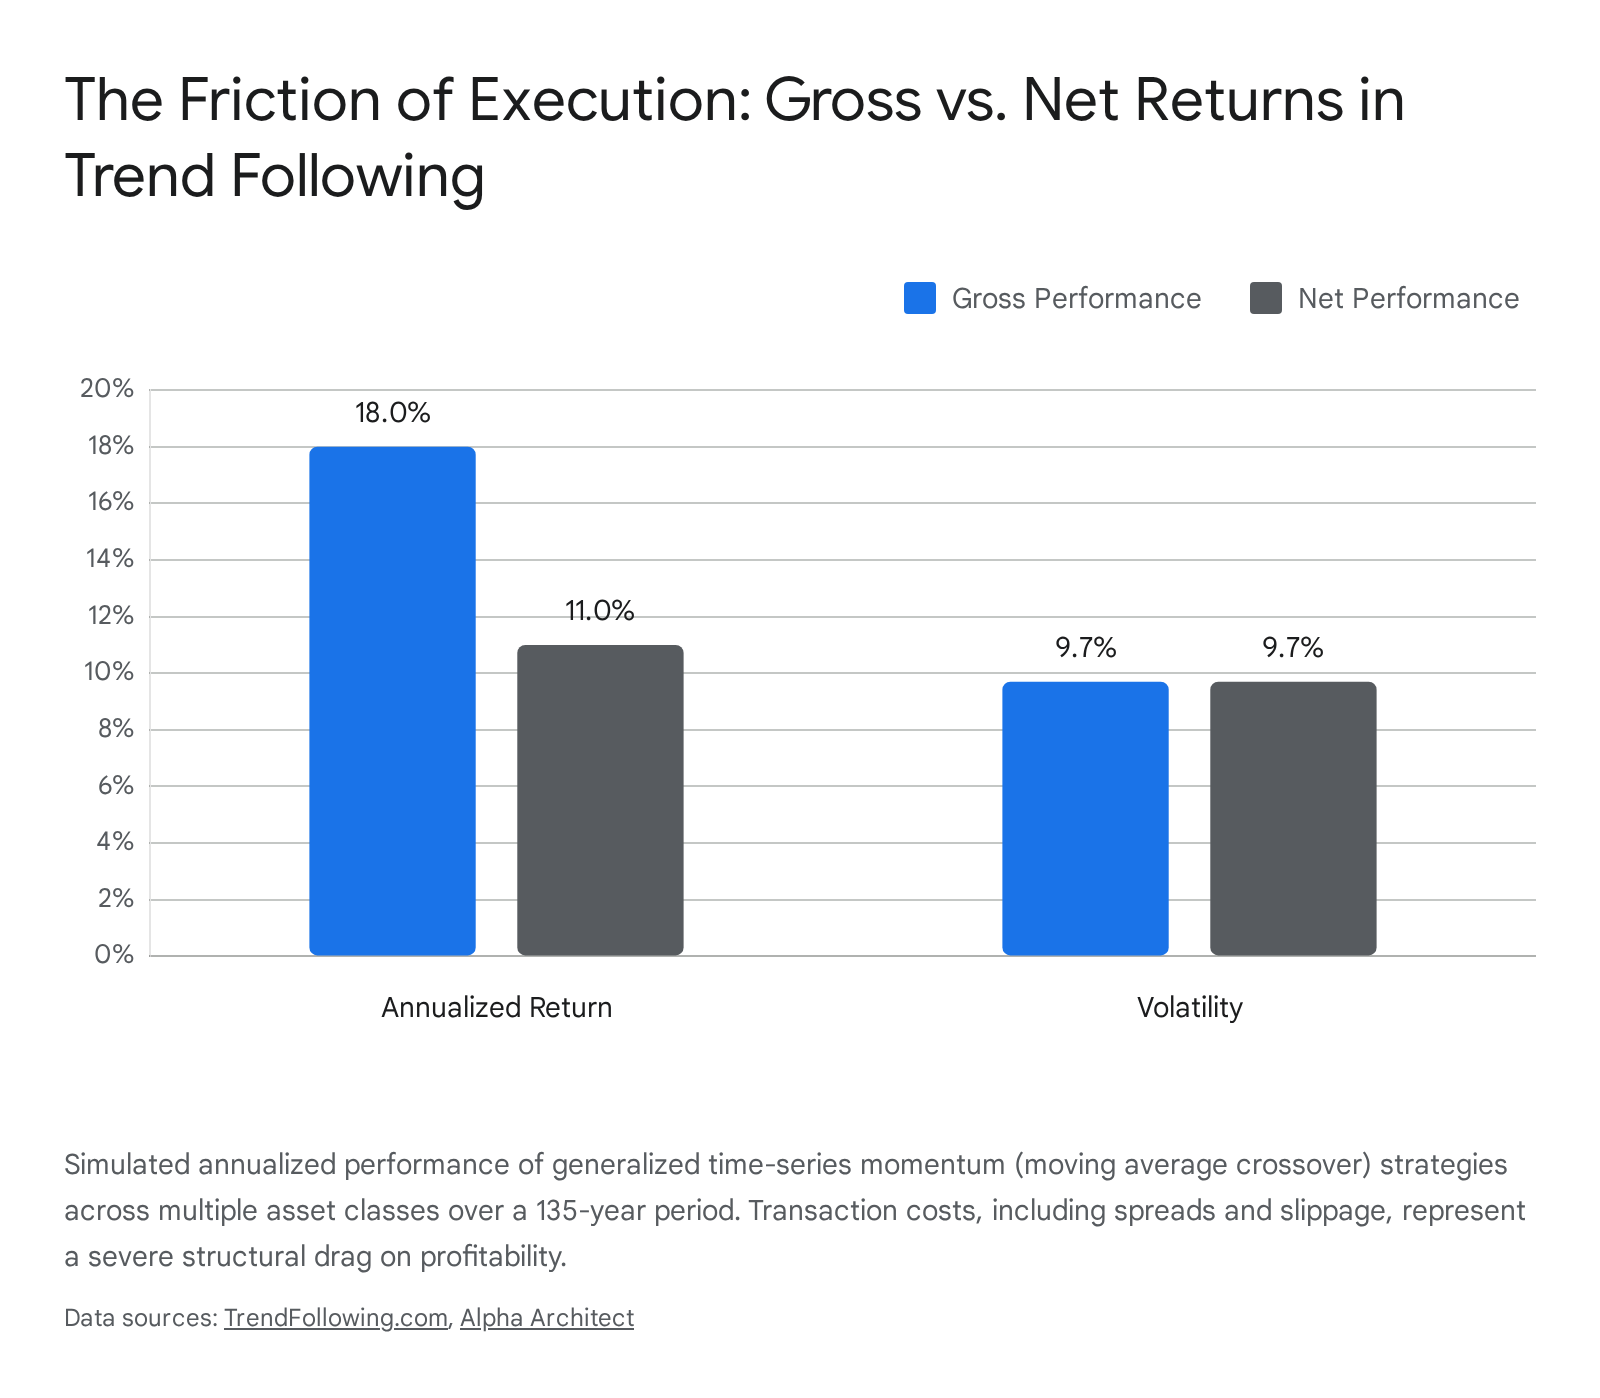
This 700-basis-point operational drag illustrates why strategies boasting spectacular theoretical gains frequently fail in live deployment.
High-Frequency Trading and Market Microstructure
The capacity for moving average crossovers to extract market alpha has evolved alongside the microstructure of global financial exchanges. The rapid proliferation of algorithmic trading (AT) and high-frequency trading (HFT) over the past two decades has fundamentally altered order book dynamics, presenting acute challenges for traditional technical indicators 293031.
Algorithmic Exploitation of Technical Signals
High-frequency trading firms utilize ultra-low-latency network infrastructure to execute trades in microseconds, capturing micro-inefficiencies and providing algorithmic market-making liquidity 293031. Under normal, stable market conditions, this activity tightens bid-ask spreads and improves overall price discovery efficiency 93132. Consequently, the market assimilates and prices in new information much faster than historical norms.
Because moving averages are fundamentally lagging indicators calculated using historical closing prices, they operate at a structural disadvantage in environments where price discovery occurs at the microsecond level 11125. By the time a widely tracked 50-day moving average crosses above a 200-day moving average, the underlying macroeconomic or fundamental information driving the trend has already been heavily arbitraged and priced into the asset by automated systems 3111.
Empirical market microstructure studies indicate that HFT algorithms engage in strategic liquidity provision and withdrawal that actively exploits slower, retail-level technical trading systems 1213. High-frequency algorithms systematically identify concentrations of limit orders and stop-loss orders placed around common moving average thresholds and technical support levels 12. When these levels are breached, HFTs execute predatory algorithms that demand liquidity from the thin side of the order book, forcing slower systems to fill market orders at sub-optimal prices, thereby increasing the slippage drag on the crossover strategy 1112.
Volatility Spikes and Signal Decay
During periods of severe market stress or systemic shocks, algorithmic interactions create complex feedback loops that exacerbate intraday price movements and trigger flash crashes 313214. HFT market makers frequently withdraw liquidity during these volatile spikes to protect their inventories from adverse selection 3212.
This sudden evaporation of liquidity combined with increased micro-volatility triggers an escalation in false moving average crossovers. Slower trend-following participants are thereby exposed to an increased frequency of whipsaw losses precisely when execution costs are at their highest 1237. Machine learning models evaluating high-frequency, minute-level financial data reveal that classic technical indicators, including simple and exponential moving averages, struggle severely with out-of-sample generalization in these environments, generating extensive false signals that destroy capital when dominated by market noise 1539.
Performance Divergence Across Market Environments
The net profitability of moving average systems is not uniform across all global exchanges; it exhibits distinct geographic and asset-class dependencies that correlate directly with the underlying market's efficiency and degree of information uncertainty 16.
Developed Equity Markets
In highly developed, heavily institutionalized equity markets, such as the United States and Western Europe, rigorous academic testing indicates that isolated technical indicators have lost their predictive edge. A seminal study evaluating over 5,000 technical trading rules across 49 country indices revealed that moving average strategies are not consistently profitable in developed markets after accounting for data snooping biases and transaction costs 1718. The intense quantitative competition, high institutional participation rate, and instantaneous information assimilation in these specific markets effectively neutralize simple technical alpha 1719.
Emerging Markets and Information Asymmetry
Conversely, empirical research provides evidence that moving average systems continue to generate stronger gross returns in emerging markets 1719. Studies evaluating the BRICS nations (Brazil, Russia, India, China, and South Africa) indicate that simple technical rules, including dual moving average crossovers, have historically outperformed passive buy-and-hold benchmarks on a gross basis 19.
| Market Classification | Market Efficiency | Trend Persistence | Impact of Transaction Costs | Net Profitability Probability |
|---|---|---|---|---|
| Developed Markets | High | Low (Rapid Mean Reversion) | Moderate | Low (Alpha heavily arbitraged) 1719 |
| Emerging Markets | Low to Moderate | High (Behavioral Herding) | Severe | Low to Moderate 161744 |
This divergence is widely attributed to lower structural market efficiency, higher baseline volatility, and significant information asymmetry in emerging economies 1644. In environments where fundamental corporate information is less reliable, less timely, or obfuscated, market participants rely more heavily on historical price patterns to make investment decisions. This reliance creates self-fulfilling trends and stronger long-term price persistence, allowing crossover rules to capture larger continuous moves 1644.
However, the realization of these theoretical gross profits is severely constrained by local market frictions. Emerging markets typically feature significantly wider bid-ask spreads, higher regulatory fees, and higher liquidity premiums than developed exchanges. Research into the directional forecasting of foreign exchange pairs demonstrates that while moving average and machine learning strategies exhibit high statistical significance in predicting currency movements in emerging markets, the economic viability collapses when subjected to institutional-level transaction costs. For instance, emerging market currency pairs often become mathematically unprofitable to trade using technical signals when round-trip trading costs exceed 1.0% 45.
Cross-Asset Applications
Trend-following utilizing moving averages performs optimally in asset classes prone to long-term, multi-year macroeconomic super-cycles, specifically commodities, fixed income, and fiat currencies 58.
Commodities are governed by protracted supply-and-demand imbalances, storage constraints, and production cycles that take years to resolve. Fixed income markets are governed by multi-year central bank monetary policy regimes. These structural realities generate the sustained directional trends necessary for moving average crossover systems to overcome their inherent short-term whipsaw costs 810. Single-asset equities, by contrast, are highly sensitive to rapid mean-reverting shocks, quarterly earnings surprises, and heavy idiosyncratic noise, making them broadly considered the most difficult environment in which to apply simple moving average crossovers profitably on a standalone basis.
Methodological Illusions in Historical Backtesting
A critical component of understanding why moving average crossovers appear to easily beat the market in retail trading literature, yet fail under institutional rigorousness, lies in the severe methodological flaws inherent in standard backtesting software and datasets.
The Impact of Survivorship Bias
The most pervasive and damaging distortion in technical backtesting is survivorship bias 4748. When researchers or analysts evaluate the historical performance of a moving average crossover system on a modern equity index, such as the S&P 500 or the NASDAQ 100, they typically apply the crossover rules to the list of companies currently residing in the index today.
This methodology silently removes all companies that went bankrupt, were delisted, merged, or suffered catastrophic equity declines over the historical testing period 2147. Because moving average systems are heavily exposed to downside gap risk during corporate bankruptcies (where price drops too fast for the moving average to issue a sell signal), eliminating these failed assets creates a highly distorted, artificially successful testing universe 2127. Academic studies demonstrate that excluding delisted stocks can erroneously inflate the annualized returns of backtested technical strategies by 1% to 4%, drastically underestimate maximum portfolio drawdowns, and create mathematically impossible Sharpe ratios 4748.
Data Snooping and Parameter Overfitting
The second illusion stems from data snooping bias and parameter overfitting 2117. A standard moving average crossover requires the selection of two arbitrary time parameters (e.g., the 50-day and 200-day). With modern computational power, analysts frequently run thousands of iterative simulations across historical data to find the precise combination of lookback windows (e.g., a 43-day and 181-day EMA) that maximized profit for a specific asset over a specific historical time frame 2349.
This curve-fitting practice ensures exceptional historical paper performance but entirely destroys the model's out-of-sample predictive power 2123. Financial markets are non-stationary; the volatility regimes that made a 43-day moving average profitable in the 2010s will not necessarily persist into the 2020s. When rigorous researchers apply strict statistical corrections for data snooping (such as White's Reality Check) across thousands of technical rules, the perceived statistical significance of moving average outperformance uniformly collapses, revealing that the "optimized" parameters were merely the result of random chance fitting historical noise 1718.
Institutional Trend-Following Architectures
Despite the failure of isolated moving average crossovers to beat the market after execution costs and data biases are accounted for, the underlying mechanism - time-series momentum - remains a foundational cornerstone of multi-billion-dollar quantitative hedge funds and Commodity Trading Advisors (CTAs) 1510.
Institutions do not achieve profitability by trading a simple 50-day/200-day moving average crossover on a single stock index. Instead, they abstract the crossover logic into a highly complex, systematic portfolio architecture designed explicitly to mitigate the transaction costs, single-asset noise, and whipsaw risks discussed above.
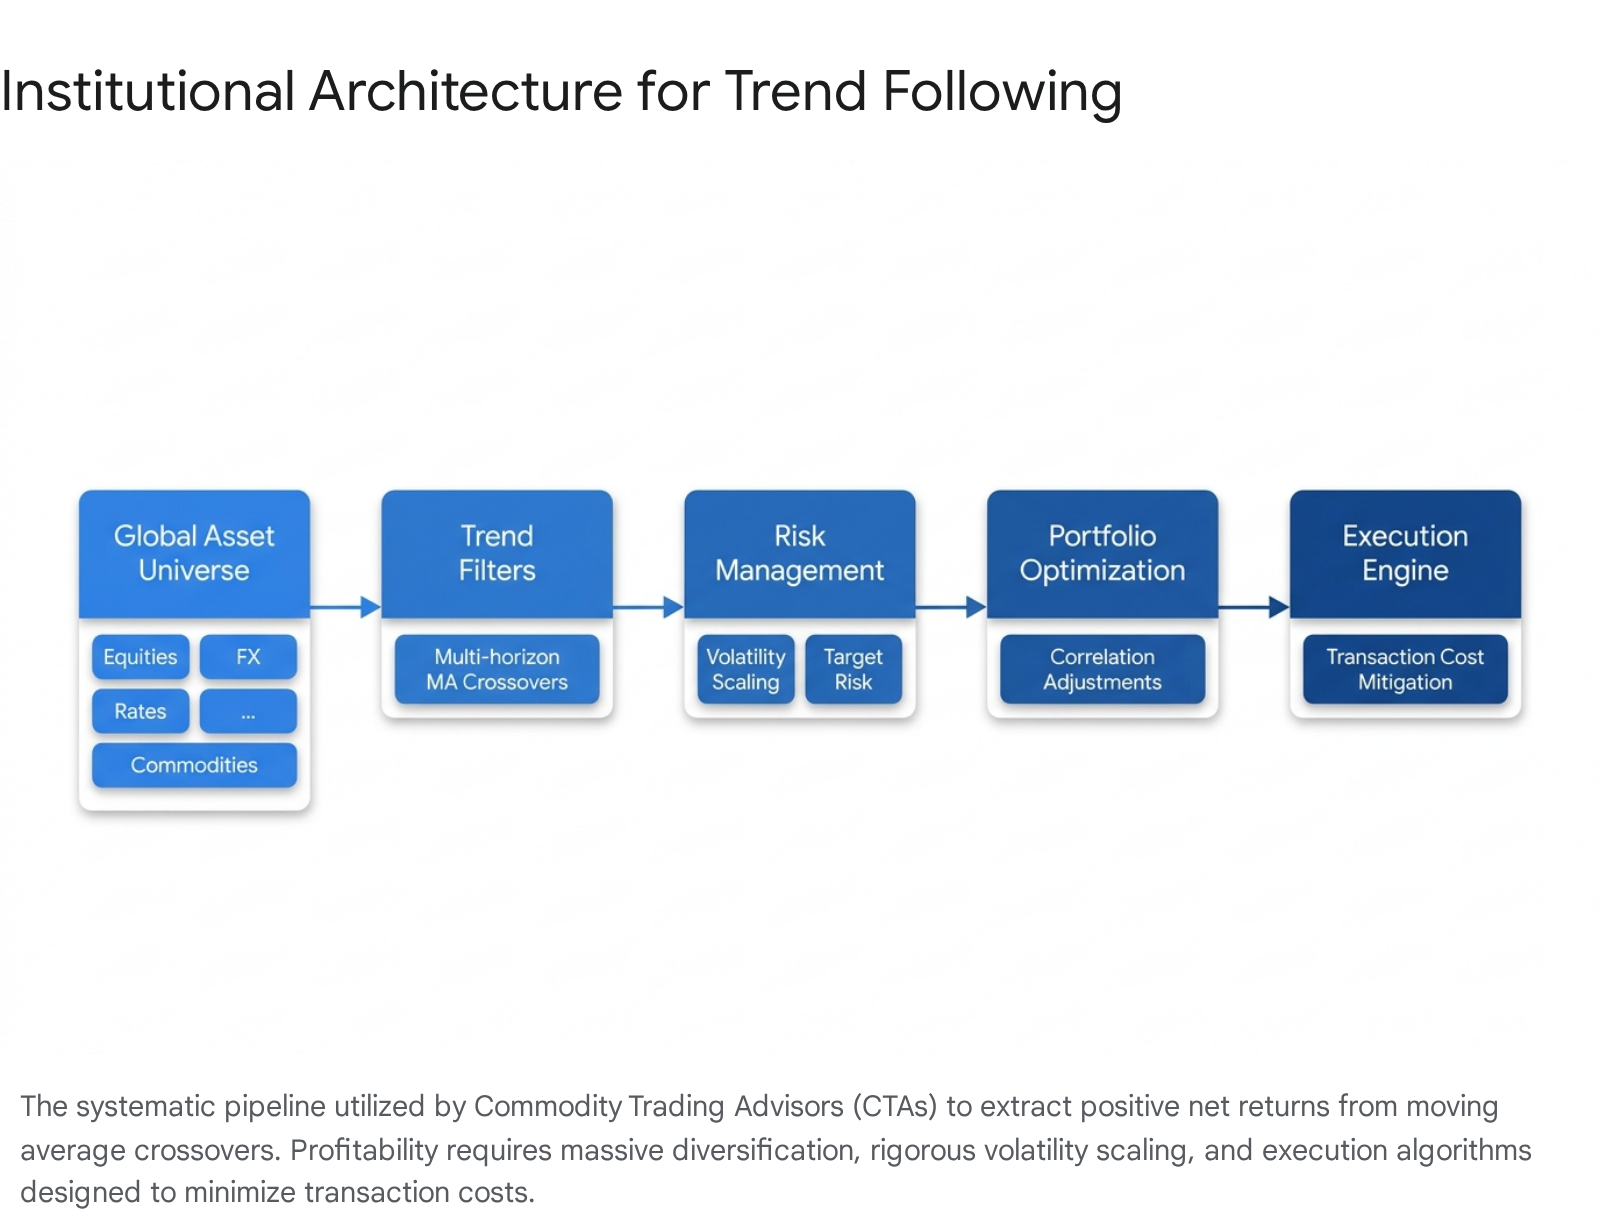
The methodology required to generate positive net returns from moving average mechanics relies on three fundamental risk management pillars.
Cross-Asset Diversification Frameworks
Because moving average systems suffer heavily in sideways and ranging markets, relying on a single asset guarantees extended, unrecoverable periods of capital drawdown. To counter this, institutions apply moving average models simultaneously across 60 to over 100 highly liquid global futures markets 5810. This universe includes international equity indices, sovereign government bonds, agricultural commodities, energy contracts, base metals, and currency pairs.
This extreme breadth ensures that while 70% of the portfolio may be suffering minor whipsaw losses in ranging, uncorrelated markets, the remaining 30% is capturing massive, outsized macroeconomic trends 520. The profits from the trending minority finance the friction of the ranging majority, resulting in net positive portfolio alpha.
Volatility Scaling and Position Sizing
A retail moving average system typically allocates capital uniformly or based on static risk percentages. Institutional systems utilize dynamic volatility scaling, automatically adjusting the position size of the crossover trade inversely to the asset's current market volatility 1208.
Metrics such as the Average True Range (ATR) or rolling standard deviations are used to gauge current risk parameters 51. If a moving average crossover triggers in a highly volatile market, the system drastically reduces the position size to limit the potential downside of a whipsaw loss 51. Conversely, if a crossover triggers in a low-volatility environment, the system leverages the position. By targeting a constant portfolio volatility (e.g., an annualized standard deviation of 10%), the system ensures that rapid mean-reverting shocks do not disproportionately destroy portfolio capital 410.
Multi-Horizon Ensembles
Rather than relying on a single set of moving averages optimized to historical data, institutions employ an ensemble approach. They continuously scale into trends using a blend of multiple lookback windows, such as 1-month, 3-month, 6-month, and 12-month crossover parameters 520.
A slow-moving, multi-year trend in government interest rates may be effectively captured by the 12-month parameter, while a rapid, event-driven shock in crude oil prices is captured by the 1-month parameter. This ensemble spreads the timing risk, mitigates the dangers of parameter overfitting, and prevents the system from being overly exposed to a single market regime's specific frequency 5.
When implemented strictly with these portfolio construction mandates, rigorous quantitative estimates over a century of data show that generalized trend-following strategies deliver long-term, risk-adjusted net returns that rival traditional equity benchmarks 10. This performance notably features "crisis alpha" - providing positive returns during severe equity market crashes (such as 2008 and 2020) - because the moving average crossover rules mathematically force the system to short plunging asset classes while retail investors hold through the decline 81052.
Conclusion
The determination of whether moving average crossover systems beat the market after costs is strictly contingent upon the method of implementation and the rigor of the execution architecture. When applied as a standalone technical indicator on single equities - the manner most frequently depicted in popular retail trading literature - moving average crossovers do not consistently beat a passive buy-and-hold benchmark. After accounting for bid-ask spreads, execution slippage, brokerage commissions, and the compounding drag of frequent whipsaw losses in ranging markets, the theoretical edge of the simple crossover rapidly decays into negative net returns. Furthermore, the increasing efficiency of modern electronic markets, driven by high-frequency trading and algorithmic liquidity provision, has accelerated the decay of these simplistic, lagging technical signals.
However, the mathematical core of the moving average crossover - the identification and extraction of time-series momentum - remains a proven, academically validated market anomaly driven by persistent behavioral underreaction. When these crossover metrics are decoupled from individual assets and deployed as part of a highly diversified, volatility-scaled, multi-horizon trend-following portfolio, they successfully overcome the friction of transaction costs. In this institutional context, moving average systems successfully harvest the positive skewness of global macroeconomic trends across commodities, currencies, and fixed income, delivering long-term, risk-adjusted net returns that provide a powerful diversifying mechanism against traditional equity market risk.