Overnight and weekend gap risk across asset classes
The discontinuity of trading hours across global financial markets introduces structural frictions that manifest as gap risk - the variance between a security's closing price in one session and its opening price in the next. These price jumps occur because information continues to accumulate while trading venues are closed, forcing an immediate repricing at the opening bell. The magnitude, frequency, and subsequent intraday behavior of these gaps differ fundamentally across asset classes, shaped by the underlying liquidity, investor clienteles, and market microstructure.
Structural Mechanisms of Price Discontinuity
Market gaps are primarily driven by the arrival of macroeconomic data, corporate earnings, or geopolitical developments during non-trading hours 12. In perfectly efficient, continuous markets, information is absorbed fluidly; however, periodic market closures concentrate the pricing of off-hours news into the opening auction.
Inventory Risk and Liquidity Provision
Theoretical frameworks, such as inventory management models and models of immediacy, suggest that gaps also reflect the compensation required by market makers for bearing overnight inventory risk 3. When large end-of-day order imbalances are carried overnight, market makers charge a liquidity premium, which often results in overnight price reversals 3. This phenomenon is particularly pronounced following periods of elevated uncertainty. For example, when the Cboe Volatility Index (VIX) is high, negative closing order imbalances yield substantially larger overnight return reversals than in low-volatility environments 3.
Consequently, gaps are not purely a function of new fundamental information; they are heavily influenced by the resolution of prior-session liquidity imbalances and the subsequent repositioning of institutional clienteles at the open 4. Re-balancing occurs as trading volume increases, taking market makers substantial volume - roughly 60,000 contracts in the S&P 500 e-mini futures market by 3:00 a.m. Eastern Time - to offset end-of-day order imbalances from the previous day 3.
Idiosyncratic vs. Systematic Shocks
Gap risk is broadly categorized into systematic (market-wide) and idiosyncratic (security-specific) components. Systematic gaps reflect macroeconomic updates that shift the fundamental valuation of an entire index or asset class 567. In contrast, idiosyncratic gaps are driven by firm-specific news such as earnings reports, clinical trial results, or executive changes 27.
Historically, asset pricing theory dictated that investors are only compensated for bearing systematic risk, as idiosyncratic risk could be diversified away 577. However, modern empirical studies demonstrate that total risk, including idiosyncratic risk, heavily influences cross-sectional stock returns. During severe gap events, idiosyncratic information systematically influences the prices of heavily correlated assets due to cross-asset hedging by informed traders, spreading the volatility shock across the broader market 78.
Equity Indices and the Overnight Return Anomaly
The equity market exhibits some of the most extensively documented and structurally persistent gap phenomena, characterized by a stark divergence between overnight and intraday return distributions.
The Overnight Drift
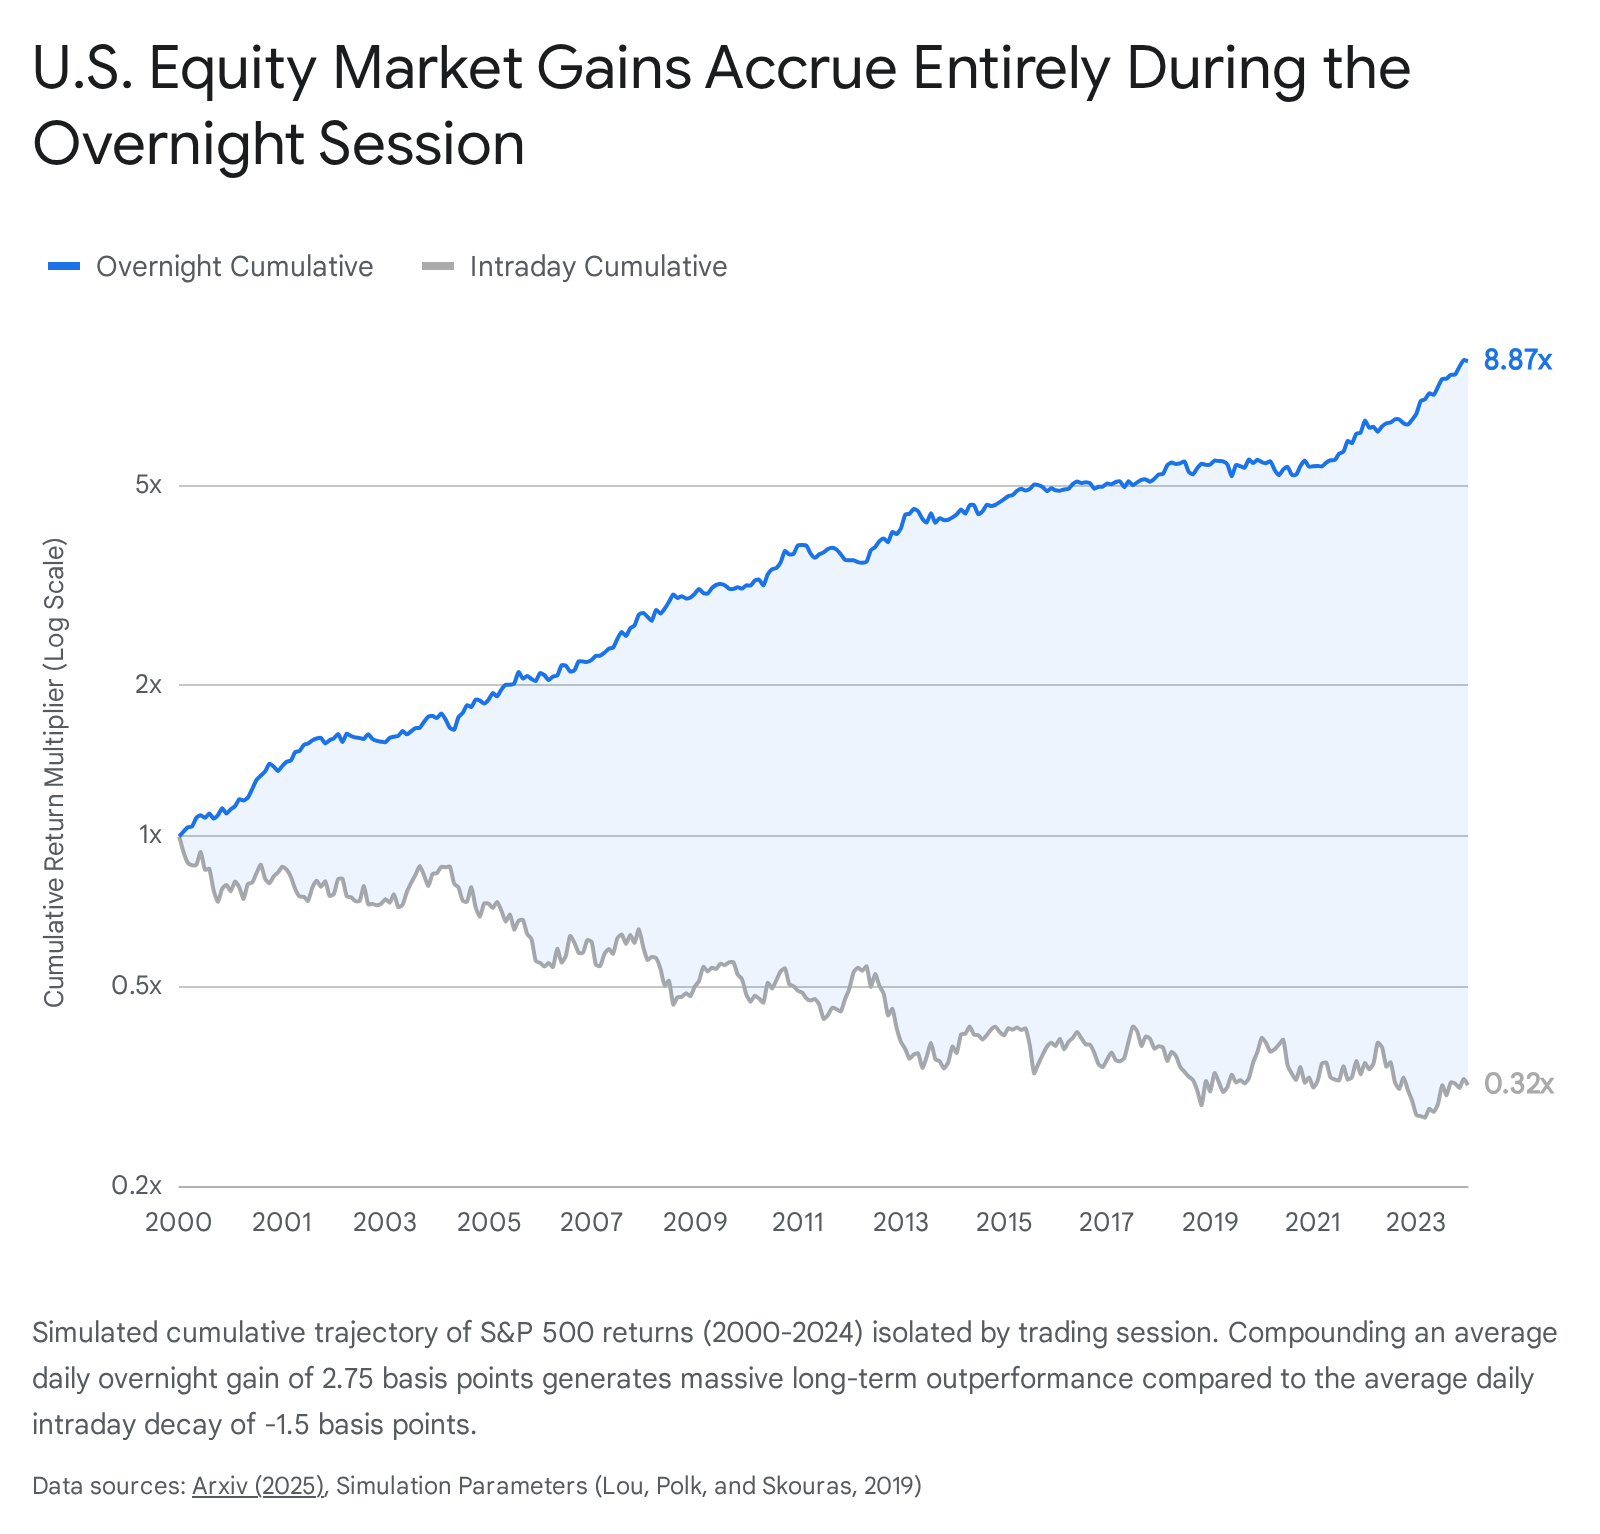
A central feature of equity index gap risk is the structural positive skew of overnight returns, often termed the "overnight drift." Empirical studies covering the past thirty years demonstrate that nearly all aggregate capital gains in the United States stock market have accrued during the overnight session 9. On average, the S&P 500 generates a positive return of approximately 2.75 basis points per day overnight (roughly 7.2% annualized), while average intraday returns are negative or flat 9.
Granular analysis reveals that the most acute portion of this overnight drift occurs during the European market open, specifically between 2:00 and 3:00 a.m. Eastern Time. S&P 500 futures generate an annualized return of 3.7% within this specific one-hour window alone 3. This hour's average Relative Signed Volume (RSV) is highly positive (+2.4%), mirroring the price drift and indicating systematic purchasing activity by liquidity providers clearing inventory imbalances from the prior U.S. close 3.
While the average close-to-close log return for the S&P 500 historically measures 5.9%, more than half of this (3.6% p.a.) is generated during the total overnight session (16:15 to 9:30), proving that gap risk holds an inherent positive expectation for passive long-only investors 3. This anomaly is robust globally; across 30 international stock markets, 23 display higher average returns overnight than intraday 10.
The Institutional and Retail Tug of War
The structural divergence between overnight and intraday gap performance is heavily influenced by investor clienteles. Institutional investors tend to execute large, algorithmic volume near the market close to minimize tracking error against closing benchmarks, generating significant closing imbalances and short-term mispricing 41112. Retail investors, conversely, tend to submit market orders overnight that execute blindly at the opening auction, creating immense opening price pressure 413.
This dynamic creates a persistent firm-level continuation and cross-period reversal effect. Stocks with a high retail trading proportion (RTP) experience substantially higher overnight-intraday return gaps; a 1 percentage point increase in RTP corresponds to an approximately 0.8 basis points higher return gap the following day 13. This effect is severe enough that a strategy buying the value-weight intraday winner decile and selling the value-weight intraday loser decile yields a three-factor intraday alpha of 2.41% per month, but an overnight alpha of -1.77% per month 4.
This "tug of war" dictates how equity anomalies are priced. Anomalies based on size, value, profitability, and illiquidity accrue their returns strictly intraday - often in the last 30 minutes of trading - but face severe negative overnight gaps 41214. Conversely, the momentum factor anomaly earns 100% of its abnormal returns via overnight gaps, generating a 3.47% monthly excess return overnight that is heavily offset by a -3.24% average intraday excess return 1114.
Weekend Gaps in Global Indices
Weekend gaps present a distinct subset of index gap risk due to the extended 60-hour closure. An examination of the Dow Jones Industrial Average (DJIA), the NASDAQ, and the German DAX from 2013 to 2023 reveals that weekend gaps frequently serve as leading indicators for subsequent short-term volatility 15.
| Equity Index | Gap Size Distribution | Relationship to Intraday Volatility | Regional Market Dynamics |
|---|---|---|---|
| DJIA | Incrementally grouped (up to 160 pts) | Strong asymmetric correlation; large gaps boost Take Profit probabilities but leave Stop Losses unaffected. | High sensitivity to weekend macroeconomic shocks globally. |
| NASDAQ 100 | Narrowly grouped (up to 80 pts) | Highly significant; larger gaps raise likelihood of hitting both upper and lower volatility thresholds. | Pronounced tech-sector sensitivity to off-hours news. |
| DAX | Tailored to empirical distribution | Moderate to weak positive association; minimal robust evidence of directional persistence. | Pre-market sessions and European regulatory structures absorb overnight shock differently. |
Table 1: Weekend gap characteristics and volatility impacts across major global equity indices (2013 - 2023) 1516.
Larger weekend gaps in the U.S. markets (DJIA and NASDAQ) correlate strongly with wider intraday price ranges on Monday, suggesting that the initial discontinuity signals a broader regime of uncertainty rather than a localized pricing adjustment 1516. In contrast, the DAX displays different gap behaviors. Due to Europe's distinct trading schedule and extended pre-market sessions, the German index manages to absorb overnight news differently, leading to less reliable momentum signaling off weekend gaps 15. Regardless of the index, empirical testing shows minimal evidence of a predictable, universal "fill-the-gap" bias at the immediate Monday open, debunking popular technical trading adages 1516.
Idiosyncratic Gap Risk in Individual Equities
While index gaps measure systematic risk, individual equities carry severe idiosyncratic gap risk, governed largely by discrete information shocks and differing liquidity thresholds.
Gap Magnitude and Fill Probability
In major United States equities, significant overnight gaps are common. Roughly 15% to 20% of trading sessions open with a gap of at least 1% in the SPY or QQQ ETFs 18. However, for individual S&P 500 constituents, the expectation that a gap will "fill" - meaning the intraday price will revert to the previous day's closing level - is heavily dependent on the gap's initial magnitude and the accompanying volume 1920.
Quantitative backtesting of 65,505 overnight gaps across 99 S&P 500 constituents from 2021 to 2024 demonstrates a non-linear decay in fill probability as gap size increases 1920.
| Gap Magnitude | Probability of Same-Day Fill | Accompanying Volume Profile | Expected Reversal Behavior |
|---|---|---|---|
| < 1.5% | 72% | Normal to Low | High probability of mean reversion driven by market makers fading noise. |
| 1.5% - 4.0% | Sharp linear decay | Elevated | Ambiguous; highly dependent on broader market sentiment. |
| > 4.0% | 15% | Highly Elevated (>2.5x Average) | Breakaway gap; material fundamental repricing with minimal fill likelihood. |
Table 2: Probability of intraday gap filling in S&P 500 stocks based on opening gap magnitude 1920.
The data establishes a statistical cliff at the 1.5% threshold. Small gaps are primarily driven by noise, minor liquidity imbalances, or retail-driven market-on-open orders, which institutional market makers quickly fade, driving the price back to equilibrium 1920. Gaps associated with low volume fill roughly 64% of the time. Conversely, gaps exceeding 4.0% represent the incorporation of material fundamental data. High-volume gaps (exceeding 2.5 times the average volume) fill only 29% of the time, as the elevated volume confirms strong institutional conviction in the new price level 20.
Earnings Announcements and Misreaction
The most violent overnight gaps in equity markets are idiosyncratic, triggered by quarterly earnings announcements, regulatory decisions, or mergers and acquisitions 217. These events bundle vast amounts of fundamental data - revenue, profit, guidance, and forward-looking commentary - into a single instantaneous release 17.
The market's initial overnight repricing to an earnings surprise often contains a significant non-fundamental behavioral component, quantified as the Return-Earnings Gap (REG) 18. The REG captures the market's relative misreaction to earnings surprises; a higher gap indicates an overly positive response relative to the actual fundamental data. Research indicates that approximately 50% of the earnings-day gap return associated with an extreme REG subsequently reverses. However, this reversal is incredibly slow, taking about three years to fully materialize 18. This suggests that massive overnight gaps can distort analyst expectations and belief formations long after the gap occurs, resulting in protracted mispricing 18.
Asymmetry in Gap Direction
A robust asymmetry exists in the direction of gap risk across market capitalizations. Analysis covering a ten-year period of the S&P 500, Nasdaq 100, and Russell 2000 reveals that negative gap openings are generally much larger in magnitude than positive gaps 19.
This downside severity is most pronounced in small-cap stocks (Russell 2000) and tech stocks (Nasdaq 100), indicating that liquidity instantly evaporates on bad news, forcing aggressive price markdowns 19. Following positive gap openings, there is a pronounced positive intraday drift where prices continue to rise, yielding average daily gains of 0.58% for the Russell 2000 and 0.50% for the Nasdaq 100 by the close. In contrast, negative gaps see rapid price adjustments with little subsequent intraday drift, suggesting that markets evaluate the economic impact of bad news much faster than good news prior to the opening bell 19.
Fixed Income and Credit Markets
Fixed income markets exhibit gap risks tied closely to macroeconomic data releases, central bank policy shifts, and liquidity conditions. However, the magnitude, frequency, and underlying mechanisms of these gaps differ sharply between sovereign debt and corporate credit.
United States Treasury Securities
The U.S. Treasury market is the deepest and most liquid in the world, yet it remains susceptible to gap risk during rapid macroeconomic regime shifts. Treasury yields gap when market expectations regarding inflation, terminal policy rates, or term premiums change abruptly 2420. Yield gaps at the Monday open are typically modest in basis point terms due to the continuous nature of global macro expectations, but they can trigger massive price revaluations on long-duration assets due to the inverse relationship between bond yields and prices 21.
The convenience yield - the premium paid for a Treasury's absolute safety and collateral value - fluctuates rapidly during geopolitical or trade shocks 22. For example, during trade tariff announcements in early 2025, the S&P 500 fell significantly while 30-year Treasury yields surged to 5.2%. During this period, the 10-year TIPS-Treasury premium gapped downward by nearly 10 basis points, severely distorting the traditional hedging properties of long-duration bonds 22.
This demonstrates that while overnight yield gaps in the 10-year Treasury note are often structurally small - frequently moving mere basis points (e.g., from 4.47% to 4.55% overnight) 2829 - the resulting portfolio impact on duration-heavy fixed income allocations can be profound.
Corporate Credit and High Yield Bonds
Corporate bonds present a bifurcated profile of gap risk, largely delineated by credit rating. Investment Grade (IG) bonds trade with tight Option-Adjusted Spreads (OAS) over Treasuries and exhibit low gap volatility. High Yield (HY) bonds, however, exhibit gap characteristics closer to equity markets due to their elevated default risk and lower liquidity 3023.
| Metric | Investment Grade (IG) Corporate Index | High Yield (HY) Corporate Index |
|---|---|---|
| Average OAS (Trailing 5Y) | 1.06% | 3.50% |
| OAS Standard Deviation | 0.23% | 0.74% |
| OAS Distribution Skew | Symmetrical | Right-skewed (Prone to sudden spread spikes) |
| OAS Range (Trailing 5Y) | 0.71% to 1.64% | 2.44% to 5.80% |
Table 3: Statistical properties of corporate bond Option-Adjusted Spreads (OAS) comparing Investment Grade and High Yield profiles 23.
As outlined in Table 3, the standard deviation of HY spreads is more than triple that of IG spreads 23. More critically, the HY OAS distribution is heavily right-skewed. This indicates that overnight credit gaps are asymmetric - spreads gap wider (meaning bond prices gap down) far more violently and suddenly than they gap tighter 23. The lack of liquidity in the HY sector means that weekend macro shocks are priced aggressively into Monday opens, exposing investors to severe mark-to-market losses.
Interestingly, corporate bond exchange-traded funds (ETFs) such as HYG exhibit the exact same overnight return anomaly seen in major equity indices. High-yield ETFs generate almost all of their historical performance during the overnight session (close-to-open), while regular trading hours (open-to-close) consistently drag on performance 24. This pattern is highly seasonal, peaking between Monday's close and Wednesday's open. It implies that market makers systematically mark down HY ETF prices during the day when the underlying, illiquid junk bonds are actually trading, and gap the ETF higher at the open to account for aggregate risk premiums and overnight liquidity costs 24.
Foreign Exchange Weekend Discontinuities
Unlike equities and corporate bonds, the foreign exchange (FX) spot market operates continuously 24 hours a day during the trading week. This continuous structure entirely eliminates weekday overnight gaps. However, institutional and retail trading halts over the weekend, making FX highly susceptible to weekend gap risk 133.
Frequency and Gap Filling in Currency Pairs
Historical data across the most liquid major currency pairs - such as EUR/USD, GBP/USD, and USD/JPY - shows that measurable weekend gaps occur on approximately 20% to 25% of all Monday opens 33. The magnitude of these gaps is substantial; the average FX weekly gap equates to roughly 50% to 60% of the entire Friday open-to-close trading range 25. For pairs like the AUD/USD, the average gap size can reach 100% of the daily Open-Close range 25.
Gap continuation in FX is highly sensitive to a specific magnitude threshold. Statistical models indicate that 75% of weekend forex gaps are relatively small, spanning less than 30 pips. These minor gaps are overwhelmingly absorbed and "filled" within the first few trading sessions of the week, driven by mean-reverting algorithmic liquidity provision 33.
However, the remaining 25% of gaps that exceed the 30-pip threshold rarely fill. Instead, these large gaps represent breakaway or runaway gaps triggered by material weekend macroeconomic shifts, political developments, or central bank rhetoric 133. Market participants treating large FX gaps as mean-reversion opportunities face severe directional risk, as prices typically continue to trend heavily in the direction of the >30-pip gap, creating strong momentum trends 3326.
Cryptocurrency Derivative Frictions
The cryptocurrency asset class trades 24 hours a day, 7 days a week on spot exchanges, theoretically removing all gap risk. However, institutional exposure is often managed through regulated derivatives markets (such as CME Bitcoin futures), which adhere to traditional Monday-to-Friday trading hours 27.
This structural mismatch creates some of the largest quantifiable weekend gap risks in modern finance. Because the underlying spot asset price discovery continues uninterrupted while the derivative venue is frozen, the futures contract is forced to instantly reconcile 48 hours of accumulated volatility at the Sunday evening open. For instance, following the announcement of a U.S. Strategic Crypto Reserve on a weekend in March 2025, CME Bitcoin futures recorded an unprecedented $10,000 price gap upon the resumption of trading 27. Until derivative venues align their operational hours with the underlying continuous spot markets, institutional participants holding regulated crypto derivatives over the weekend remain exposed to extreme, unhedgeable gap risk.
Statistical Distribution and Tail Risk Modeling
Traditional mean-variance optimization often models asset returns using a normal (Gaussian) distribution. However, the prevalence of overnight and weekend gaps mathematically forces asset return distributions to exhibit excess kurtosis (fat tails) and skewness, severely altering risk management paradigms.
Skewness, Kurtosis, and Extreme Events
A standard normal distribution has a kurtosis of 3.0. Distributions with higher kurtosis are termed leptokurtic, signifying a higher probability of extreme events, while those below 3.0 are platykurtic 2829.
Empirical analysis of the S&P 500 (SPY) daily returns yields a kurtosis of approximately 7.98 30. This heavily leptokurtic profile confirms that extreme, outsized price movements - frequently manifesting as severe overnight gaps - occur much more often than standard Gaussian models predict 282930. For example, based on a normal distribution, a three-standard-deviation loss in the S&P 500 should historically occur roughly once every 741 days. In reality, these extreme tail events have materialized approximately once every 113 days, a seven-fold increase in frequency directly attributable to overnight and weekend gap friction 31.
The skewness of the S&P 500 is generally near zero (+0.1047), indicating a relatively symmetrical distribution of extreme positive and negative gaps over ultra-long horizons 30. However, specific assets deviate wildly. As noted previously, high-yield corporate bonds exhibit severe right-skew in their spreads, exposing them to outsized overnight gap-downs in price 23.
Systematic Tail Risk Estimation
Because extreme gaps are infrequent, measuring time-varying tail risk using a single aggregate index is statistically challenging. Modern quantitative approaches utilize high-frequency cross-sectional data across thousands of single equities to isolate the common, unobservable component of tail risk .
By assuming the left tail of return distributions follows a power law structure, researchers apply risk-neutralized Hill estimators to intraday and overnight data. This captures the market's evolving perception of extreme downside risk 32. A one-standard-deviation increase in this cross-sectionally estimated tail risk metric strongly predicts future market returns, forecasting a 4.5% annualized increase in excess market returns over the following year, alongside significant predictive power at the three- and five-year horizons 33. Furthermore, stocks with high loadings on past tail risk earn an annual three-factor alpha 5.4% higher than stocks with low tail risk loadings 33.
This demonstrates that investors demand a significantly higher equity risk premium to hold assets when the probability of extreme, unhedgeable overnight gaps is elevated 3233. Consequently, gap risk is not merely an operational friction born from exchange opening hours; it is a fundamental, priced variable that dictates aggregate capital allocation, structural market liquidity, and cross-sectional asset pricing globally.