Multimodal models for swing trade forecasting
Theoretical Foundations of Multimodal Forecasting
The evolution of financial market forecasting has transitioned from relying exclusively on structured numerical data - such as historical price series and trading volumes - toward highly complex "quantamental" frameworks that integrate unstructured alternative data 1. At the forefront of this shift is multimodal deep learning, which simultaneously processes heterogeneous data sources, including textual news, corporate fundamentals, and spatial chart images, to generate predictive signals 23. This integration addresses the limitations of traditional econometric models, which often rely on assumptions of linearity and stationarity that fail to capture the complex, nonlinear dynamics of financial markets 434.
This multimodal approach is particularly relevant for swing trading, a strategy defined by holding positions across multiple days or weeks to capture medium-term market movements 75. Swing trading typically aims for multi-day moves of 100 to 400 pips in forex or equivalent percentage shifts in equities 7. Unlike high-frequency day trading, which is heavily reliant on market microstructure and low-latency execution, or long-term investing, which depends on macroeconomic cycles and extended earnings growth, swing trading operates in a unique temporal window. This horizon is optimal for multimodal models because it aligns with the decay rate of news sentiment and the gradual pricing of fundamental corporate data into the market 45.
Despite the theoretical advantages of these models and their capacity to challenge the Efficient Market Hypothesis by identifying transient inefficiencies, realizing consistent economic value remains highly challenging. The financial domain is characterized by low signal-to-noise ratios, non-stationary data distributions, and adversarial market conditions 610. Empirical performance of multimodal systems often exhibits a significant disconnect between statistical accuracy in isolated backtests and actual risk-adjusted returns in live deployment, primarily due to the failure to adequately model transaction costs, execution slippage, and information leakage 411.
Data Modalities and Feature Engineering
The foundation of any multimodal forecasting system is the extraction, normalization, and temporal alignment of diverse data streams. Financial environments generate information across multiple dimensions and frequencies, requiring specialized preprocessing pipelines for each modality before fusion can occur 412.
Market Data and Spatial Chart Representations
Historical market data, encompassing open, high, low, close, and volume (OHLCV) metrics, provides the primary structured input for forecasting models. This data is often transformed into technical indicators - such as the Moving Average Convergence Divergence (MACD), Relative Strength Index (RSI), Bollinger Bands, and exponential moving averages - to explicitly model momentum, volatility, and trend reversion 1378. However, recent advancements in deep learning have expanded how market data is ingested, moving beyond simple scalar time-series inputs.
Researchers increasingly treat historical price action as spatial data. K-line (candlestick) charts are rendered as two-dimensional images and processed using Convolutional Neural Networks (CNNs), Vision Transformers (ViT), or Residual Networks (ResNet) 29. The extraction of visual descriptors, such as Histogram of Oriented Gradients (HOG) features, allows models to capture morphological structures, body-to-wick proportions, candle color, and classical chart patterns that traditional numerical sequences might obscure 9. This spatial representation enables the model to identify visual support and resistance structures directly from the pixel distribution. Studies applying these hybrid temporal-visual approaches to major indices, such as the Nikkei 225 and Nifty 50, demonstrate that visual inputs provide complementary cues during periods of high volatility, where standard time-series trends become unreliable 21011.
Unstructured Textual Data and Social Sentiment
Financial narratives, disseminated through news articles, regulatory filings, and social media, represent a critical modality for capturing investor psychology and emerging market risks. The extraction of predictive signals from text relies heavily on Natural Language Processing (NLP) and transformer-based architectures.
While early models utilized lexicon-based sentiment analyzers like VADER or TextBlob, these tools frequently struggle with the nuanced, jargon-heavy context of financial markets 1220. The introduction of domain-specific language models, most notably FinBERT, revolutionized textual feature extraction by pre-training on large-scale financial corpora 121. FinBERT is specifically optimized to parse specialized jargon common in earnings releases and analyst reports, offering substantially improved sentiment classification performance compared to dictionary-based models 21. In empirical studies predicting the directional movement of indices like the Nifty 50, incorporating FinBERT-derived polarity features yielded accuracy improvements of over 5% across various recurrent neural network architectures 22.
The source of the text also significantly dictates the nature of the predictive signal. Research analyzing the disparity between different social media platforms indicates that short-form, retail-driven content (e.g., TikTok) strongly influences short-term speculative volatility and volume spillovers. Conversely, long-form content and traditional text-based social media (e.g., Twitter) align more closely with long-term market dynamics and institutional sentiment 23. Models integrating cross-platform sentiment signals have reported forecasting accuracy improvements of up to 20% in cryptocurrency markets 23.
Semantic Embeddings Versus Scalar Sentiment Scores
A critical architectural decision in processing textual data is whether to utilize derived scalar sentiment scores or raw dense semantic embeddings. Sentiment scores compress complex narratives into a single numerical value (typically scaled between -1 and 1 or categorical labels like bullish/bearish), simplifying the fusion process but potentially discarding vital context 1325.
Conversely, passing raw semantic embeddings directly into the multimodal fusion layer preserves higher-dimensional relationships. This allows the downstream network to interpret specific vocabulary in the context of current price action, rather than relying on a pre-computed sentiment abstraction 1415. Techniques such as Zero-Shot learning or embedding extraction from large language models significantly reduce computational bottlenecks while retaining the semantic richness of the raw text 16. Empirical comparisons suggest that utilizing raw embeddings often yields superior predictive accuracy, provided the network architecture possesses sufficient depth and cross-modal attention mechanisms to handle the increased dimensionality 1517.
Fundamental Data and Option-Implied Volatility
Fundamental data provides the intrinsic valuation baseline for equities, encompassing metrics derived from 10-K and 10-Q filings, such as price-to-earnings (P/E) ratios, operating cash flow, enterprise value, and debt-to-equity levels 3018. The integration of fundamental data into swing trading models presents unique challenges due to its low reporting frequency. While market and news data are generated continuously, fundamental data updates quarterly.
To address this frequency mismatch, models typically employ forward-filling techniques, projecting the most recent quarterly data forward until a new report is published 430. Despite the low frequency, the inclusion of fundamental factors acts as a stabilizing anchor for the forecasting model. Research utilizing the S&P 500 indicates that hybrid models integrating quarterly financial ratios with 20-day technical price windows achieve significantly higher predictive accuracy than models relying on technical data alone, as the fundamental features mitigate overreactions to transient news noise by providing context on a company's financial resilience 18.
Advanced frameworks also integrate forward-looking expectations via option-implied volatility. The "Binocular" directional forecasting framework, for instance, encodes both realized equity price dynamics and option-implied volatility surfaces as two-dimensional images. Processed using CNNs and integrated through cross-attention mechanisms, this bidirectional information flow allows the model to leverage expectations-based information from derivatives markets, achieving higher Sharpe ratios than traditional momentum strategies, particularly during periods of elevated uncertainty 19. Additionally, models utilizing Time-Varying Parameter Vector Autoregression (TVP-VAR) construct dynamic heatmaps of inter-market spillovers, capturing systemic risk and cross-asset correlations that influence broad index movements across global markets 320.
Temporal Alignment and Cross-Frequency Synchronization
The most complex engineering challenge in multimodal financial forecasting is the temporal alignment of heterogeneous data streams. Financial time series exhibit extreme multi-frequency characteristics: price data updates at the millisecond level, news is published irregularly throughout the trading day, and fundamentals update quarterly 434.
Models must establish strict temporal causality to prevent information leakage. Textual data is typically aggregated over rolling historical windows, such as the 20 trading days preceding an event 15. To account for the diminishing relevance of older news, advanced architectures implement Temporal Decay algorithms or Weighted Moving Averages (WMA). These mechanisms model the decay of an event's influence, assigning exponentially higher weights to recent observations and ensuring that stale sentiment does not distort short-term swing forecasts 21.
Architectural Paradigms for Modality Integration
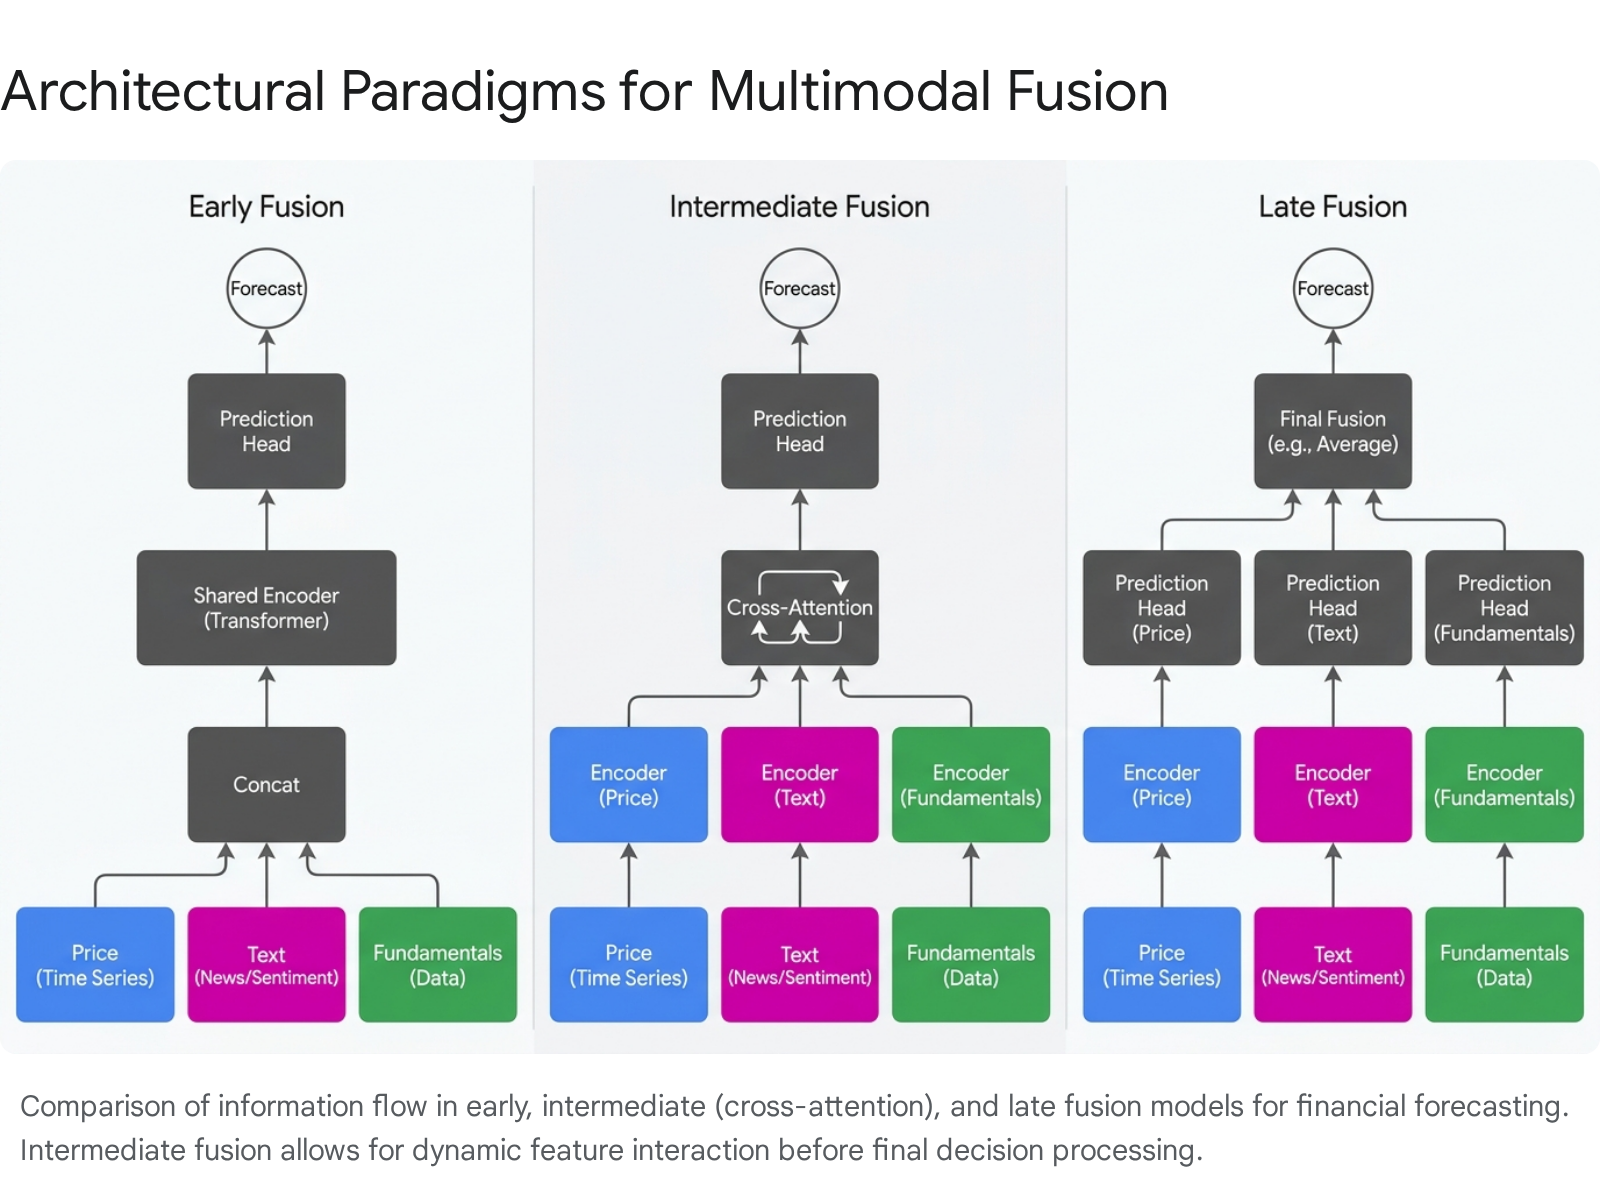
The method by which disparate data modalities are integrated fundamentally dictates a model's capacity to recognize complex market patterns. Multimodal fusion strategies are generally categorized by the depth at which the integration occurs within the neural network: early, late, and intermediate (cross-attention) fusion 122237.
Early Fusion Methodologies
Early fusion, or feature-level fusion, involves the direct concatenation of raw or minimally processed features from all modalities into a single, comprehensive vector at the input stage 1222. This unified vector is subsequently fed into a generic machine learning classifier or regressor, such as a Random Forest, XGBoost, or a standard Multi-Layer Perceptron (MLP).
The primary advantage of early fusion is its theoretical ability to allow the model to learn direct, low-level correlations across modalities immediately 1215. For example, the model can instantly associate a sudden spike in trading volume with a specific quantified sentiment score from that same minute. In certain highly constrained environments, such as predicting post-earnings announcement drift, early fusion networks have occasionally demonstrated superior performance across all evaluation metrics, achieving accuracies upwards of 80% by enabling effective cross-modal representation learning 15.
However, this approach exhibits significant vulnerabilities when applied to broad financial data. Early fusion is highly sensitive to modality imbalance, scale discrepancies, and noise 1238. Because the raw features lack structural alignment, the network often struggles to disentangle sparse, high-impact signals (such as a rare regulatory filing) from continuous, noisy signals (such as daily price fluctuations).
Late Fusion and Decision-Level Aggregation
Late fusion, also known as decision-level fusion, isolates each data modality, processing them through independent, specialized sub-networks 1222. For instance, time-series price data may be processed by a Long Short-Term Memory (LSTM) network, candlestick image data by a ViT, and raw text by a FinBERT encoder. Each independent network generates a preliminary prediction or confidence score, which are subsequently aggregated at the final output layer using voting mechanisms, weighted averages, or a secondary ensemble classifier 938.
This architecture preserves the unique representational structure of each modality and prevents noisy data in one stream from interfering with the feature extraction of another 915. It is particularly effective in portfolio optimization tasks, where different alpha sources must be independently evaluated for volatility and risk before combination 38. However, late fusion's strict isolation precludes the network from recognizing deep, cross-modal interactions during the crucial feature extraction phase. This severely limits its ability to understand context - such as interpreting a specific news headline differently based on whether the asset is currently in a technical uptrend or downtrend 1523.
Intermediate Fusion and Cross-Attention Mechanisms
Intermediate fusion, heavily augmented by cross-attention mechanisms, represents the current state-of-the-art in multimodal financial forecasting. This paradigm processes modalities through independent encoders initially but introduces explicit, learnable fusion layers at intermediate stages of the network, enabling dynamic, context-dependent feature interactions prior to final classification 3738.
Cross-attention modules are the core mechanism driving intermediate fusion. Unlike self-attention, which models relationships within a single sequence, cross-attention models directional interaction across streams by using queries derived from one modality (e.g., numerical market indicators) and keys/values derived from another (e.g., text embeddings) 3740. This selective, context-aware integration allows the model to determine precisely which textual information is relevant for numerical prediction at each specific time point 1738.
Advanced variations of this architecture have demonstrated significant performance gains across various benchmarks:
- Multimodal Stable Fusion with Gated Cross-Attention (MSGCA): This framework introduces sequential gating mechanisms. It uses stable, primary features (such as long-term moving average sequences) to guide the integration of more volatile modalities (such as real-time news documents). The gated layer acts as a discriminator, filtering out semantic conflicts and noise, and has achieved performance gains ranging from 8.1% to 31.6% over unimodal baselines across different datasets 2442.
- Stock Optimization using News Knowledge (STONK): This framework evaluates different encoders and fusion strategies. When utilizing a DeBERTa encoder paired with cross-modal attention, the system achieved a 0.68 classification accuracy and a 0.73 F1 score, outperforming pure concatenation methods 40.
- Cross-Modal Temporal Fusion (CMTF): By treating structured data as predefined numerical values and unstructured news as classification tensors, CMTF aligns multifrequency inputs using weighted moving averages. Evaluated on the FTSE 100, the model achieved an 84.88% recall and 51.04% precision for next-day price direction, outperforming classical baselines by leveraging sequential dependencies 21.
These architectures provide inherent interpretability. The attention weights generated by the network allow researchers to observe exactly which textual tokens the model prioritized in relation to a specific numerical price movement, offering actionable insights into the drivers of predictive alpha 3738.
| Fusion Strategy | Integration Point | Strengths in Financial Forecasting | Limitations | Ideal Use Case |
|---|---|---|---|---|
| Early Fusion | Input Level | Captures direct correlations immediately; simple architecture. | Highly sensitive to noise and modality scale imbalance. | Short-term event prediction (e.g., earnings announcements). |
| Late Fusion | Decision Level | Preserves modality independence; isolates noise from different streams. | Fails to capture deep cross-modal contextual interactions. | Portfolio optimization; risk aggregation across different asset classes. |
| Intermediate (Cross-Attention) | Mid-Network Layers | Dynamic, context-aware weighting; high interpretability via attention maps. | Computationally intensive; requires careful architectural design to prevent overfitting. | Swing trading forecasting requiring sentiment-to-price alignment. |
Advanced Predictive Modeling and Reinforcement Learning
The selection of the underlying neural architecture is as critical as the fusion strategy. While traditional machine learning methods like Random Forests and XGBoost remain reliable for noisy data, deep learning models provide the capacity required for complex multimodal representations 413.
Transformer and LSTM Hybrids
Recurrent Neural Networks (RNNs), particularly LSTMs and Gated Recurrent Units (GRUs), have long been the standard for modeling sequential financial time series due to their ability to capture temporal dependencies 252627. However, LSTMs often struggle with very long-range dependencies and parallel processing.
The integration of Transformer architectures, leveraging multi-head self-attention, has largely superseded pure LSTM models in processing both the textual and temporal dimensions of financial data. Transformers process entire sequences simultaneously, providing superior semantic understanding 20. Hybrid architectures often employ LSTMs for local temporal feature extraction and Transformers for global cross-modal fusion. For instance, testing on major global indices including the Nikkei 225, CSI 300, and S&P 500 demonstrates that hybrid models incorporating FinBERT sentiment and dynamic market structures consistently out-forecast single-source models and traditional benchmarks 320.
Deep Reinforcement Learning for Execution
While forecasting architectures predict future price movements, translating those predictions into profitable swing trades requires an execution layer. Deep Reinforcement Learning (DRL) has emerged as a powerful mechanism for this task, shifting the model's objective from simple accuracy to cumulative reward optimization under real-world constraints 82829.
DRL agents - such as Deep Q-Networks (DQN), Double DQN (DDQN), Soft Actor-Critic (SAC), and Twin Delayed DDPG (TD3) - interact continuously with simulated market environments. These environments are programmed with realistic market frictions, including transaction costs, slippage, and permanent market impact 2848. In evaluations on the Indian NIFTY 50 index using high-frequency data, advanced DRL variants like DDQN achieved Sharpe ratios of 0.7394 and win rates of 73.33%, demonstrating strong volatility-adjusted suitability for real-world deployment 8. Furthermore, for derivative hedging tasks, continuous-control agents like SAC and TD3 have been shown to reduce expected hedging losses by two-thirds and lower conditional value at risk (CVaR) by over 50% compared to traditional delta hedging, proving highly adaptive to friction-intensive environments 28.
Benchmark Datasets and Evaluation Protocols
The rigorous evaluation of multimodal forecasting models necessitates standardized, domain-specific benchmark datasets. Historically, the field has suffered from fragmented, proprietary, or highly synthetic datasets, which severely limited reproducibility and cross-model validation 3049.
High-Fidelity Multimodal Datasets
The recent introduction of large-scale financial benchmarks has catalyzed objective research by standardizing the preprocessing and temporal alignment of data 33034.
FinMultiTime represents a significant advancement, serving as a comprehensive, four-modal, bilingual dataset. It encompasses 5,586 stocks across the U.S. (S&P 500) and Chinese (HS 300) markets from 2009 to 2025 33034. The dataset, totaling 112.6 GB, provides strict temporal alignment across textual financial news, structured quarterly tables, K-line chart images, and multi-resolution price series (minute, daily, quarterly) 33050. By standardizing the alignment pipeline, FinMultiTime allows researchers to isolate the efficacy of fusion architectures without confounding data engineering variables.
Other specialized datasets target specific capabilities of large language models in finance. Fin-Fact, comprising over 3,300 financial claims, is designed specifically for multimodal financial fact-checking and explanation generation, providing a rigorous test against LLM hallucinations 51. Similarly, FinMME features over 11,000 high-quality samples across 18 financial domains, evaluating models on comprehensive perception (temporal sequence recognition) and complex cognition (trend prediction and causal analysis), applying strict hallucination penalties to generate an unbiased "FinScore" 3053.
| Benchmark Dataset | Primary Focus | Modalities Included | Scale and Coverage | Key Innovation / Purpose |
|---|---|---|---|---|
| FinMultiTime | Broad Multimodal Fusion | Price, Technical Images, Fundamental Tables, News Text | 5,586 stocks, 2009 - 2025, US & Chinese markets | Strict temporal alignment across four modalities with multi-frequency resolution. |
| Fidel-TS | Data Leakage Prevention | Time-Series, Verifiably Exogenous Text (e.g., weather, scheduled events) | Large-scale, high-frequency | Built from live APIs to eliminate LLM pre-training contamination and temporal leakage. |
| Fin-Fact | Fact-Checking / Integrity | Financial Claims (Text, Images) | 3,369 financial claims | Evaluates LLM hallucination and reasoning against ground-truth financial facts. |
| FinMME | Reasoning & Cognition | Text, Complex Financial Charts, Tables | 11,000+ samples, 18 domains | Tests deep cognitive perception and trend inference against hallucination penalties. |
| TimesX | Context-Enriched Generalization | Time-series, Diverse Textual Contexts | Large-scale real-world series | Addresses poor generalization of synthetic data via an automated data generation pipeline. |
Data Leakage and Pre-training Contamination
Data leakage is the most prevalent cause of backtest overfitting, occurring when information from the future implicitly influences the model during the training phase, rendering out-of-sample testing invalid 63132. In traditional time-series forecasting, researchers must employ strict chronological data splitting (e.g., expanding window or walk-forward validation) to maintain temporal causality, as standard k-fold cross-validation is inappropriate for non-stationary financial data 22232.
The integration of textual data and LLMs has introduced novel, highly complex vectors for leakage 493334. First, temporal or causal leakage occurs when data collection pipelines retrieve web documents, such as end-of-year earnings reports, that contain aggregated data unavailable at the specific daily timestamp being predicted 3334. Second, description leakage occurs when ingested textual summaries explicitly state the ground-truth outcome of the price action being forecasted 3334.
Most critically, the era of large language models has introduced pre-training contamination. Because foundational models (e.g., GPT-4) are pre-trained on vast, static internet corpora, they have inherently "seen" historical market events. Testing these models on historical financial data often results in an illusion of predictive capability, as the model is effectively recalling past events rather than forecasting them 493334. Benchmarks like Fidel-TS have been developed specifically to address these vulnerabilities, prioritizing data sourcing integrity by utilizing live API streams of verifiably exogenous data to guarantee strict causal soundness 3334.
The Gap Between Statistical Accuracy and Economic Alpha
A pervasive issue in academic financial forecasting is the reliance on standard machine learning metrics - such as Accuracy, Precision, Recall, and the F1-score - to evaluate model success 440. While these metrics are mathematically sound for generalized classification tasks, they frequently fail to reflect economic reality in financial markets.
Limitations of Traditional Classification Metrics
This phenomenon, termed the "accuracy vs. alpha gap," occurs because standard classification metrics treat all predictions equally 435. In financial markets, the magnitude of a price move is as critical as its direction. A model that correctly predicts five days of minor positive returns but incorrectly predicts one massive market crash will exhibit high directional accuracy but suffer catastrophic economic losses.
Consequently, the efficacy of swing-trading models must be evaluated using financial performance metrics computed over rolling out-of-sample periods. These include the Sharpe Ratio (risk-adjusted return), Sortino Ratio (downside risk-adjusted return), Maximum Drawdown (peak-to-trough loss), and the Profit Factor (gross profit divided by gross loss) 403637. For instance, in evaluating the STONK multimodal framework, researchers reported a Profit Factor of 2.03 and a Sharpe Ratio of 3.15 when using specific cross-modal attention configurations, providing a much clearer picture of the strategy's viability than its 0.68 raw accuracy score 40.
Market Frictions: Transaction Costs and Slippage
The transition from theoretical accuracy to realized alpha requires the explicit modeling of market frictions. Real-world swing trading incurs unavoidable costs that erode theoretical margins 4861.
Transaction fees (brokerage commissions) and bid-ask spreads create a baseline hurdle rate for profitability 4861. Furthermore, execution slippage - the difference between the expected price of a trade and the price at which the trade is actually executed - severely impacts strategies that rely on volatile, news-driven momentum 48. Backtests that assume execution at the closing price without accounting for liquidity constraints or order book depth produce highly inflated, optimistic performance estimates 2848. Research indicates that incorporating a realistic 0.1% transaction cost per trade can completely negate the profitability of baseline unimodal models; however, highly optimized hybrid transformer models have demonstrated the ability to absorb these costs, generating statistically significant Jensen's Alpha and cumulative returns that vastly outperform buy-and-hold benchmarks 61.
Non-Stationary Markets and Regime Shifts
Financial markets are profoundly non-stationary, meaning the underlying statistical properties of price and sentiment data change over time. These changes are driven by macroeconomic cycles, geopolitical events, and shifts in regulatory policy 482038.
A multimodal model trained during a sustained quantitative easing environment (a low-volatility, high-liquidity bull market regime) will likely fail when deployed in an inflationary, high-interest-rate regime 463. The relationship between sentiment and price is regime-dependent; empirical evidence shows that the impact of sentiment on returns is often amplified or entirely reversed during extreme market conditions or recessions 21. The COVID-19 pandemic serves as a prime example of a structural regime shift, where historical price patterns broke down entirely, and textual narratives regarding supply chains and public health became the dominant drivers of asset pricing 1227.
To survive such volatility shocks, modern forecasting frameworks must be highly adaptive. This involves implementing rolling-window retraining pipelines, incorporating macroeconomic indicators to explicitly define the current market state, and utilizing architectures that dynamically recalibrate the attention given to specific modalities based on real-time environmental feedback 82128.
Conclusion
The convergence of structured price data, fundamental accounting metrics, and unstructured natural language through multimodal deep learning represents a paradigm shift in financial market analysis. For swing-trade forecasting, this approach bridges the critical gap between short-term technical momentum and the delayed reality of corporate fundamentals. Architectures utilizing intermediate cross-attention fusion provide the most effective mechanism for this synthesis, allowing dynamic, bidirectional alignment of temporal signals with textual narratives.
However, the efficacy of these models cannot be measured purely by statistical classification accuracy. True algorithmic validity in financial markets requires bridging the "accuracy vs. alpha" gap. Models must be rigorously evaluated through chronological, leak-free backtesting frameworks that explicitly account for transaction costs, execution slippage, and structural regime shifts. As the accessibility of large language models and alternative data expands, the competitive advantage in swing trading will increasingly depend not just on the volume of data ingested, but on the architectural precision of the fusion mechanism and the rigor of the risk-management layer.