Net Price vs Sticker Price: What's the Difference
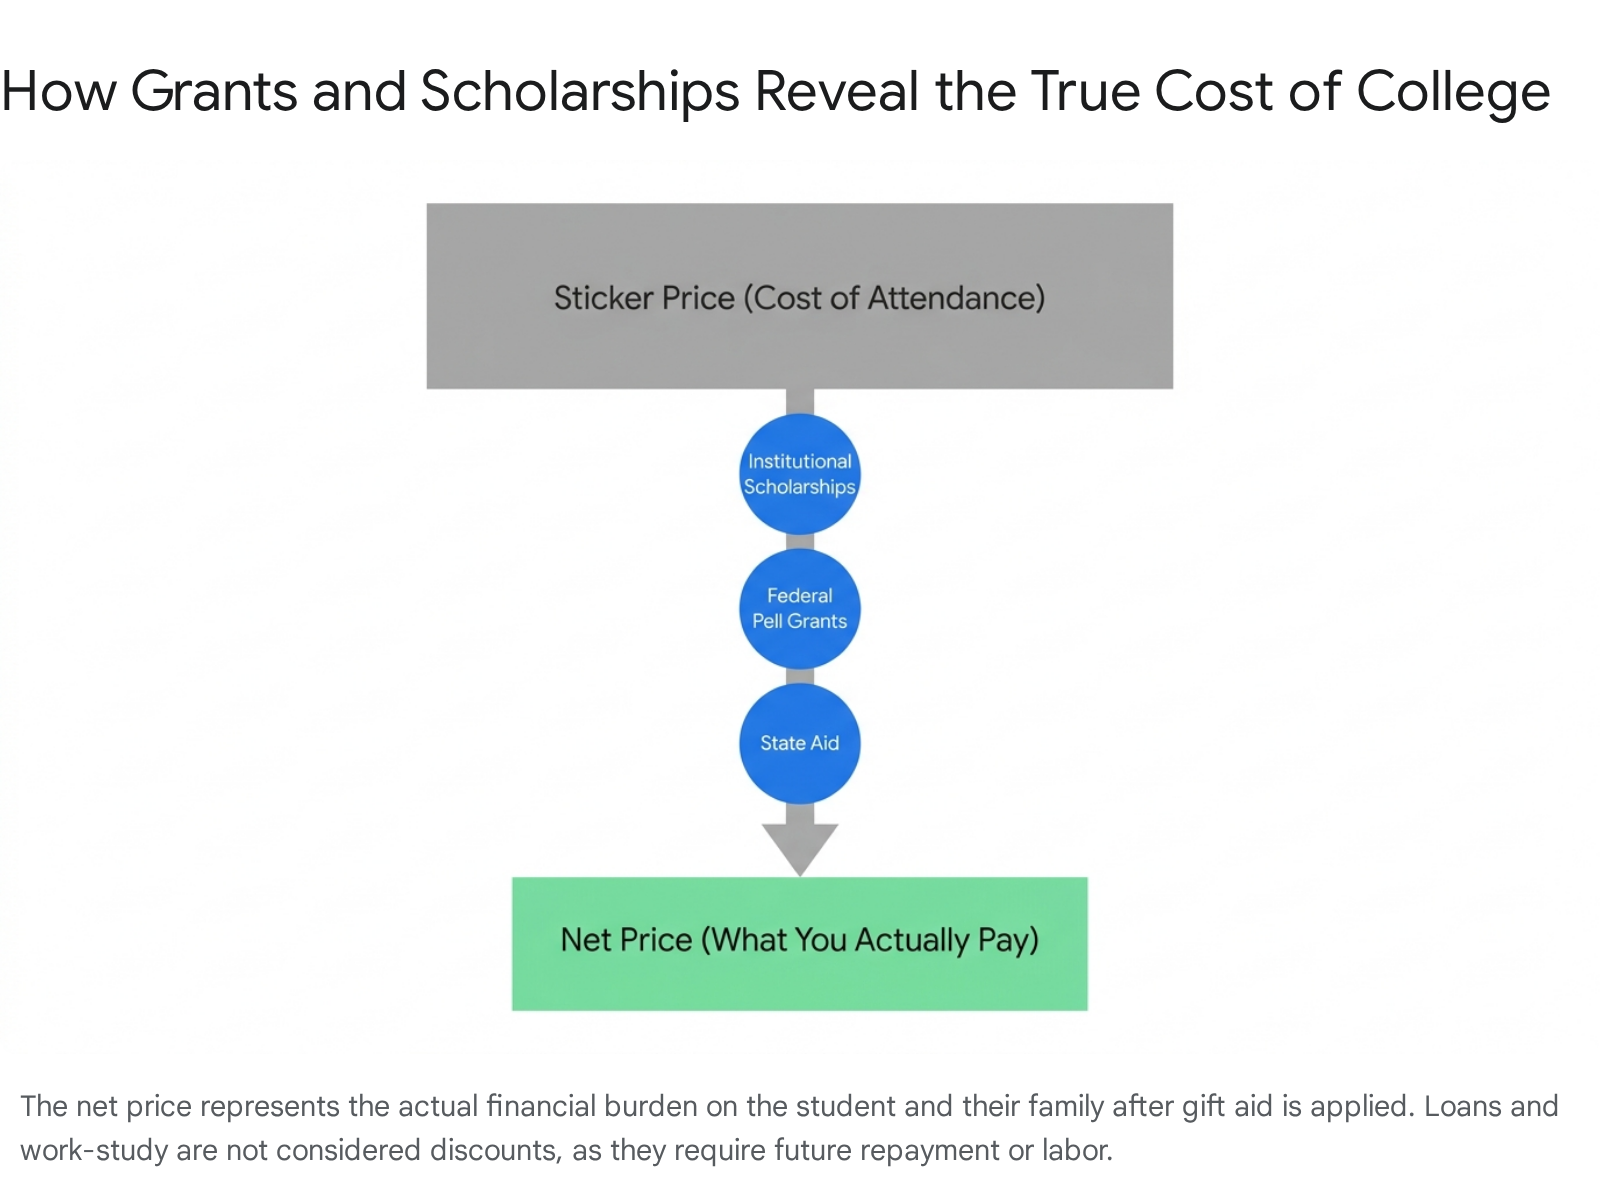
The "sticker price" of a college is its total advertised cost for one year - including tuition, fees, room, and board - but very few students actually pay this maximum amount. The true out-of-pocket cost is the "net price," which is the actual financial burden remaining after all grants and scholarships are subtracted from the sticker price. By focusing strictly on the net price rather than headline-grabbing tuition rates, families can accurately evaluate affordability, compare financial aid offers, and avoid being deterred by artificially inflated list prices.
The Psychology of Pricing in Higher Education
Every fall, headlines warn of skyrocketing college costs, frequently pointing to elite private institutions whose total costs are nearing the $100,000 threshold for a single academic year 1. While these numbers are factually accurate representations of what colleges publish on their official websites and in their marketing materials, they paint a deeply misleading picture of the financial reality faced by the vast majority of degree-seeking students. Confusion about college pricing is longstanding and persistent, stemming largely from the fundamental disconnect between the published cost of attendance and the discounted rate that institutions actually accept as payment 2.
To fully grasp the mechanics of college pricing, it is highly instructive to look at the pricing models utilized in the hospitality and healthcare sectors. In the hotel industry, for instance, properties maintain what is known as a "rack rate" or "Best Available Rate" 34. This is the maximum advertised, unrestricted price for a room. However, nearly every guest receives some form of a discount, whether through a corporate rate, a travel portal, a loyalty program, or an affiliation like AAA 45. The rack rate serves primarily as a psychological anchor; it establishes a perception of high value and allows the consumer to feel they are receiving a significant bargain when the inevitable discount is applied 34.
A more severe parallel exists in the American healthcare system through the use of hospital "chargemasters." A chargemaster is a massive, highly inflated list of list prices for every conceivable medical procedure, drug, and supply 56. Almost no one pays the chargemaster price. Insurance companies negotiate massive, systemic discounts - sometimes paying only 37 percent of the list price - and uninsured patients often qualify for charity care or heavily reduced rates 56. The chargemaster price is essentially a fictional starting point for complex financial negotiations 6.
Higher education operates on a remarkably similar model. The published cost of a college is simply the starting point of a complex financial negotiation facilitated through the financial aid office 78. For the overwhelming majority of undergraduate students, this inflated headline number is immediately and drastically slashed by institutional, state, and federal financial aid 910. Understanding the mechanics of this pricing system is the single most important step for families attempting to accurately evaluate the true cost of a college degree.
Deconstructing the Sticker Price
When a college quotes its "sticker price," it is officially referencing a figure known as the Cost of Attendance (COA) 7911. Federal regulations require every higher education institution that participates in federal financial aid programs to provide this estimate to prospective and current students 1112. The COA serves a specific regulatory purpose: it establishes a hard ceiling for the maximum amount of total financial aid (including both grants and loans) a student is legally allowed to receive during an academic year 11.
The Cost of Attendance is meant to represent a realistic, comprehensive budget for a full academic year. It is not merely the cost of sitting in a classroom. Instead, it is divided into two distinct buckets of expenses: direct costs and indirect costs 11131415.
Direct vs. Indirect Costs
The distinction between direct and indirect costs is a critical area of confusion for families, primarily because families only receive an actual bill from the university for the direct costs. Indirect costs are simply estimates of what it takes for a student to live and study over the course of nine months, and families have significant, autonomous control over how much they actually spend in these secondary categories 1315.
| Cost Category | Type | Description | Included in COA? |
|---|---|---|---|
| Tuition & Fees | Direct | The cost of academic instruction, facility upkeep, and mandatory campus services. Billed directly by the college. | Yes |
| Room & Board (On-Campus) | Direct | Dormitory housing and campus meal plans for resident students. Billed directly by the college. | Yes |
| Housing & Food (Off-Campus) | Indirect | Rent, groceries, and utilities for students living independently. Not billed by the college. | Yes |
| Books & Supplies | Indirect | Textbooks, laptops, lab materials, and software subscriptions. Usually purchased from third parties. | Yes |
| Transportation | Indirect | Gas, flights home, or public transit passes. Controlled entirely by the student's choices. | Yes |
| Personal Expenses | Indirect | Laundry, toiletries, entertainment, and miscellaneous living costs. | Yes |
Because the published sticker price includes thousands of dollars in estimated indirect expenses - such as off-campus pizza, holiday flights home, and new laptops - the advertised cost of college often looks artificially inflated 111315. A family's actual out-of-pocket spending may be significantly lower than the stated COA if the student chooses to buy used textbooks, commutes from a family home, or lives a highly frugal lifestyle 1315. Conversely, a student who travels extensively or lives in a luxury off-campus apartment may find that their personal indirect costs far exceed the college's conservative estimates.
The Reality of the Net Price
If the sticker price is the worst-case scenario budgeting tool, the net price is the financial reality 917. The formula for determining the net price is straightforward but strictly defined by the federal government:
Cost of Attendance (Sticker Price) - Grants and Scholarships = Net Price 7916.
Grants and scholarships are universally referred to in higher education as "gift aid" or "free money" because they do not have to be repaid and require no future labor 1617. This vital funding can originate from multiple sources: the federal government (such as the Pell Grant for low-income students), state governments, private philanthropic organizations, or the college's own endowment and operating budget 7910.
The Illusion of Loans in Financial Aid Packages
One of the most pervasive and damaging points of confusion for students is the inclusion of loans and work-study funds in their financial aid award letters. While federal student loans (such as Direct Subsidized and Unsubsidized loans) and Parent PLUS loans are legally considered "financial aid" in a technical and regulatory sense, they do not reduce the net price of attending the institution 91718.
A loan simply defers the cost of the education to the future, attaching interest to the principal amount. Work-study programs provide an opportunity to earn money, but they require the student to actively trade their labor for wages during the semester. Therefore, when families attempt to calculate what a specific college will actually cost them over four years, they must disregard loans in their initial math and look exclusively at the net price remaining after pure gift aid is applied 7917.
Deceptive financial aid award letters that blur the line between gift aid and loans have drawn the ire of lawmakers and policy advocates. Institutions have frequently been criticized for packaging loans as "awards," making a college appear artificially affordable until the student graduates and faces the reality of repayment 18192021.
The "High Tuition, High Aid" Business Model
To understand why the gap between sticker price and net price is so vast, one must look closely at how modern colleges and universities manage their revenue and build their incoming classes. Over the past few decades, many private non-profit institutions - and increasingly, public universities facing state funding cuts - have adopted a strategic enrollment management approach known as the "high tuition, high aid" model 2223.
Under this system, a private college might strategically set its tuition at $50,000, bringing its total Cost of Attendance to $75,000 or more 8924. This high sticker price serves a dual purpose. Psychologically, it signals prestige, academic quality, and exclusivity to prospective applicants in a market where consumers often irrationally equate high price with high value 8. Financially, it allows the college to extract maximum possible revenue from the small percentage of wealthy, price-insensitive families who can easily afford to pay full freight without blinking 723.
The college then takes a significant portion of the revenue collected from these full-pay students and redistributes it as institutional grants to middle- and lower-income students 81023. This strategic discounting - often marketed to families as "merit scholarships" or "need-based aid" - allows the college to build a socioeconomically diverse class, attract students with high standardized test scores to boost institutional rankings, and hit specific revenue targets 1025.
The Unprecedented Scale of College Discounting
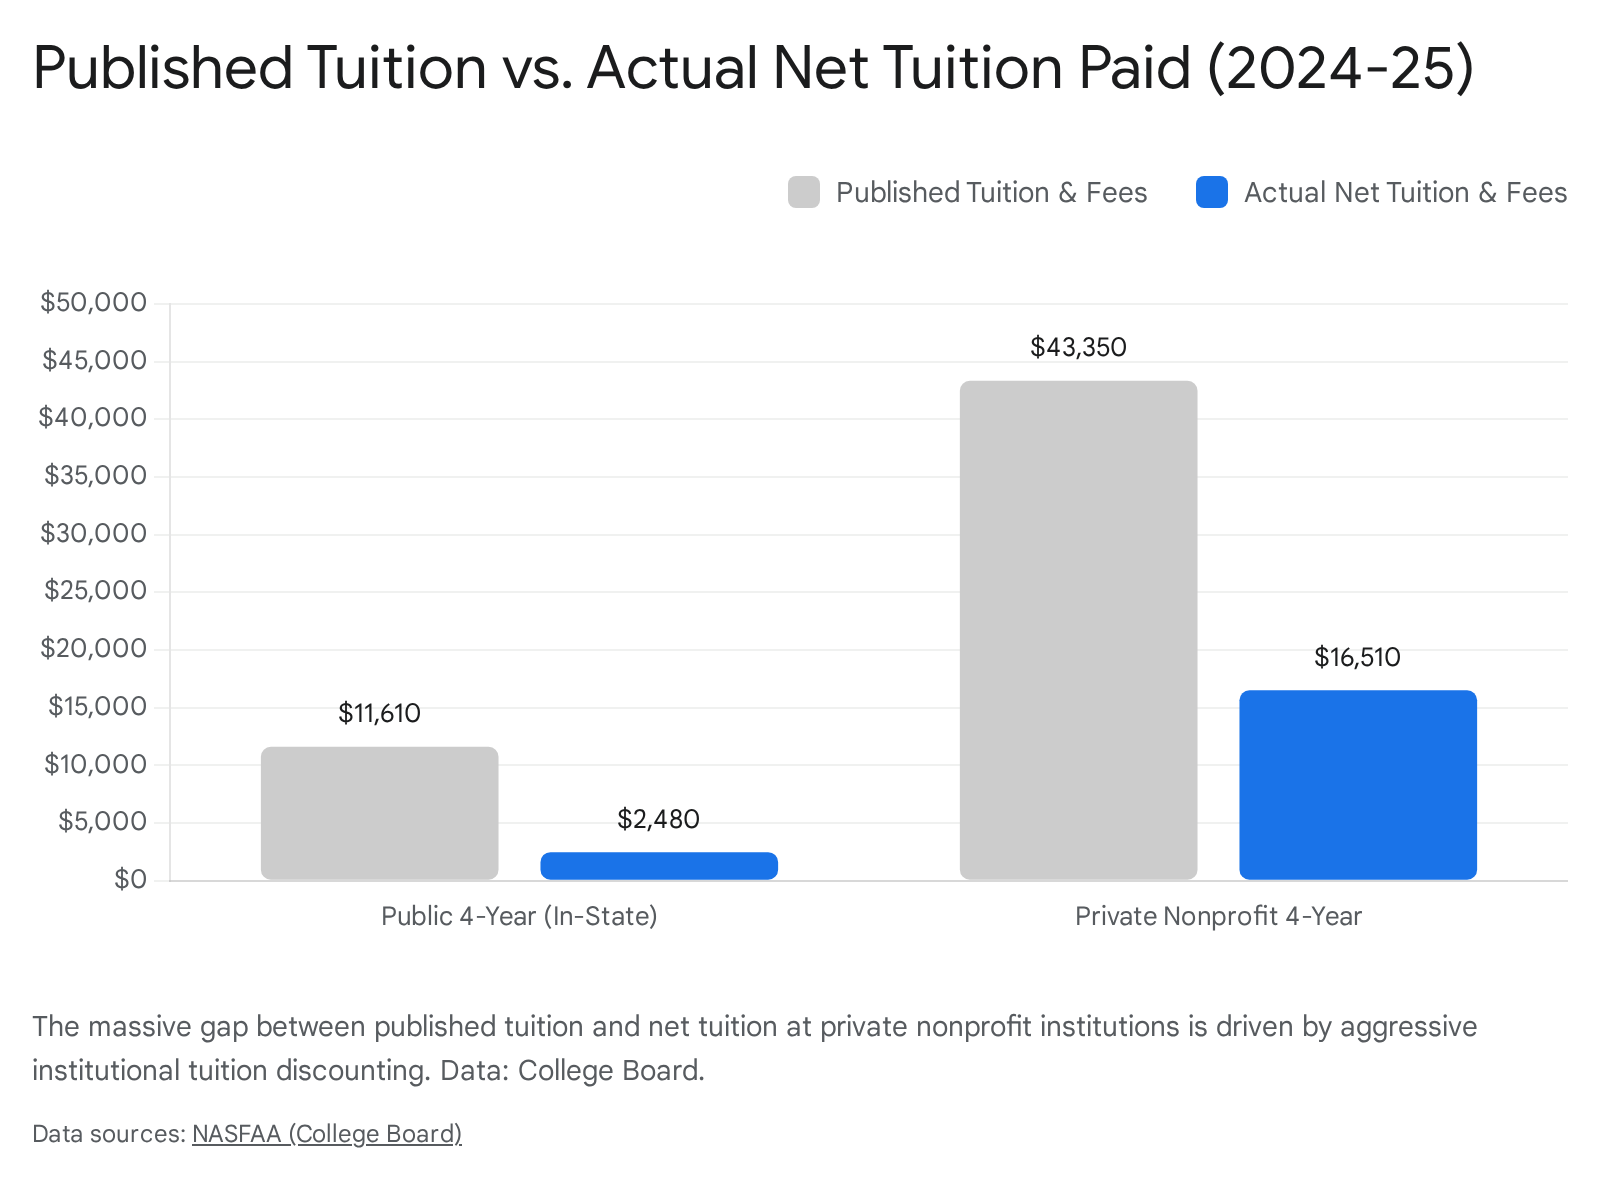
The practice of tuition discounting is not a fringe strategy; it is the fundamental economic engine of modern private higher education, and it has reached historic highs. According to the National Association of College and University Business Officers (NACUBO), the estimated average institutional tuition discount rate for first-time, full-time undergraduates at private, nonprofit colleges hit a staggering 56.3% for the 2024 - 25 academic year 232627.
This metric is vital to understanding college affordability. It means that for every dollar of tuition and fee revenue a private college could have collected based on its published sticker price, it instead gave away roughly 56 cents in institutional grant aid 26.
Furthermore, an estimated 83.4% of all undergraduates at participating private institutions received some form of institutional grant aid in 2024-25 26. When a massive discount is applied to more than 80% of the entire customer base, the discounted price is the real market price, and the sticker price is merely an anchor 826. While this model makes college accessible to a broader range of students, NACUBO warns that such high discount rates are putting immense financial stress on tuition-dependent private institutions, threatening their long-term financial sustainability 2327.
The Real Cost of College: By the Numbers
To see how these discounting practices play out nationally, analysts rely on the College Board's annual Trends in College Pricing data. The data consistently reveals a massive gulf between the terrifying sticker prices reported in the mainstream press and the nuanced reality of average net prices 1730.
The 2025 - 2026 Academic Year Data
For the upcoming 2025 - 26 academic year, the College Board reports the following national averages for published sticker costs (tuition and mandatory fees only, before accounting for room and board) 302829:
- Public two-year (in-district): $4,150
- Public four-year (in-state): $11,950
- Public four-year (out-of-state): $31,880
- Private nonprofit four-year: $45,000
When factoring in housing, food, books, and estimated indirect personal expenses, the average total Cost of Attendance leaps dramatically. The average total sticker budget is roughly $29,910 for public in-state students and over $62,500 for students at private nonprofit institutions 302930.
However, average net prices present a starkly different reality. While comprehensive net price data typically trails by a year due to the complexities of federal data collection, authoritative estimates demonstrate that net prices have remained remarkably stable. In fact, one of the most counterintuitive realities in modern higher education is that, after adjusting for inflation, the average net tuition and fees paid by first-time, full-time in-state students at public four-year universities actually declined over the past decade. Net tuition peaked at $4,450 in the 2012 - 13 academic year and has declined to an estimated $2,300 in 2025 - 26 (measured in constant 2025 dollars) 2829.
Similarly, the inflation-adjusted average net tuition and fees at private nonprofit four-year colleges fell from nearly $19,810 during the 2006 - 07 academic year down to an estimated $16,910 in 2025 - 26 2829.
| Institution Type | Avg. Published Tuition & Fees (25-26) | Avg. Total Sticker Budget (25-26) | Avg. Net Tuition & Fees (Estimated) |
|---|---|---|---|
| Public 4-Year (In-State) | $11,950 | $29,910 | ~$2,300 |
| Public 4-Year (Out-of-State) | $31,880 | $49,080 | Varies widely by state aid policy |
| Private Nonprofit 4-Year | $45,000 | ~$62,570 | ~$16,910 |
Data Source: College Board Trends in College Pricing 2025 - 26. Total budgets include housing, food, and estimated indirect costs. Net tuition estimates account for inflation-adjusted grant aid 30282930.
It is paramount to note that these figures are averages. The net price is highly individualized. An applicant from a high-income household in the top income quartile may very well pay the full $62,500 sticker price at a highly selective private college 1. Conversely, a low-income student who qualifies for maximum federal and institutional aid might attend that exact same prestigious college for a net price approaching $0 17.
The Illusion of Rising Costs
The narrative that college is becoming increasingly unaffordable for everyone is largely driven by looking exclusively at sticker prices, which have indeed outpaced general inflation for decades 1030. However, this trend suggests that colleges have counterbalanced higher sticker prices by continuously increasing their institutional grant aid to make the net price more attainable for lower-income and middle-class families 31.
As noted by the Brookings Institution, the sticker price is becoming an increasingly poor indicator of actual college costs for all students, regardless of family income 10. Even among higher-income students who fail to qualify for federal need-based aid, merit-based discounting ensures that only a fraction actually pay full price 2.
The Flawed Promise of Net Price Calculators
Because national averages are of little use to an individual family trying to balance their specific household budget, the federal government intervened to enforce price transparency. Enacted as part of the Higher Education Opportunity Act of 2008, a federal mandate required that by 2011, every college receiving Title IV federal financial aid funds must host a functioning "Net Price Calculator" (NPC) on its website 11932.
These digital tools require users to input specific data points: family income, assets, household size, and occasionally academic metrics like GPA or standardized test scores. The calculator then processes these inputs through the college's proprietary internal financial aid formulas to generate an individualized estimate of the student's net price before they ever submit an application 13633.
Systematic Failures in the NPC Ecosystem
While NPCs remain the best available tool for predicting college costs early in the search process, they are far from flawless. Extensive research by institutions such as the Brookings Institution, the University of Pennsylvania, and the Institute for College Access & Success has highlighted several systemic issues with these transparency tools 18203334:
- Outdated Data Inputs: A comprehensive audit of the NPC landscape found that up to 40% of institutions used outdated cost data in their calculators - sometimes relying on tuition and historical aid numbers from three to four years prior 20. When tuition rates rise annually, utilizing old data produces estimates that bear little resemblance to what students will actually pay upon enrollment.
- Lumping Loans with Grants: A highly deceptive practice utilized by over a quarter of audited colleges involves packaging student loans and Parent PLUS loans into the "Estimated Award" section of the calculator's output 181920. By failing to clearly visually differentiate between free money (grants) and debt (loans), these calculators artificially suppress the perceived net price, leading families to believe a school is highly affordable when, in reality, it requires massive borrowing 1820.
- Missing Indirect Costs: Some calculators intentionally omit the cost of books, transportation, and personal expenses entirely, displaying a net price based solely on billed tuition and housing 20. This understates the true cost burden students will face during the year.
- The Upperclassman Drop-off: By federal design, NPCs are structured strictly to estimate costs for first-time, full-time freshmen 1939. They routinely fail to account for one-time freshman merit grants or housing subsidies that disappear in the second year. As a result, a low-income student might receive a favorable NPC result for their freshman year, only to be surprised by bills that are thousands of dollars higher during their sophomore year 19.
Despite these well-documented flaws, higher education experts and financial advisors universally recommend that families run an NPC for every single college on their target list before finalizing their application strategy. A well-maintained NPC can provide invaluable guidance, potentially saving a family the heartbreak of applying to, gaining admission to, and falling in love with an institution they simply cannot afford 93036.
The FAFSA Factor: A System in Transition
To officially claim the grants and scholarships required to reduce a staggering sticker price down to a manageable net price, a student must file the Free Application for Federal Student Aid (FAFSA). The financial information submitted on the FAFSA serves as the master key to higher education financing; it dictates a student's eligibility for federal Pell Grants, access to federal student loans, state-level aid, and often, institutional need-based grants 103536.
The American financial aid landscape recently underwent a seismic and turbulent shift with the implementation of the FAFSA Simplification Act, which completely overhauled the application process, the underlying need-analysis formulas, and the digital infrastructure starting in the 2024 - 2025 academic year 123537.
The Shift from EFC to SAI
For decades, the output of a completed FAFSA was a number known as the "Expected Family Contribution" (EFC) - a specific dollar figure representing what the federal government believed a family could reasonably afford to pay out of pocket for one year of college 3538. This terminology was widely criticized by higher education professionals because it was inherently misleading. Families rarely paid their exact EFC. Because most colleges lacked the endowment resources to meet 100% of a student's demonstrated financial need, they routinely left a "gap" between the EFC and the actual net price, forcing families to take on loans to cover the difference 738.
Under the new simplification rules, the EFC has been permanently retired and replaced by the Student Aid Index (SAI) 353638. The SAI is deliberately designed not to look like a dollar amount a family is expected to pay. Rather, it functions purely as an index number used by financial aid offices to gauge relative financial need among the applicant pool 3538. To help states and institutions target aid more effectively to the most profoundly vulnerable students, the SAI scale can drop below zero, down to a minimum of -1,500 (whereas the old EFC scale stopped firmly at $0) 373839.
Winners, Losers, and the Rollout Disaster
The primary goal of the simplified FAFSA was to expand federal Pell Grant eligibility by linking it directly to family size and federal poverty guidelines, making college more affordable for thousands of low-income students who were previously on the bubble of eligibility 363739. However, the new formula also introduced significant structural changes that shifted net prices, creating new winners and losers - particularly within the middle class:
- The Sibling Penalty: The old EFC formula offered a massive, built-in discount to families who had multiple children enrolled in college simultaneously 3539. The new SAI formula entirely removed this multi-sibling discount. As a result, middle-income families with two or more students in college concurrently experienced drastically reduced financial aid eligibility, leading to significantly higher net prices 353639.
- Small Businesses and Family Farms: Previously, the net worth of family farms and small businesses (defined as having fewer than 100 employees) was shielded and excluded from federal asset calculations. The new FAFSA requires the net worth of these assets to be reported, which drastically raised the calculated SAI - and the eventual net price - for families who are "asset rich but cash poor" 3639.
Complicating matters further, the initial rollout of the simplified FAFSA in late 2023 and early 2024 was characterized as a historic failure. It was marred by severe technical glitches, massive processing delays, and widespread communication breakdowns from the Department of Education 40414243. A subsequent Government Accountability Office (GAO) autopsy of the rollout pointed to structural and managerial failures that turned the launch into a yearlong debacle, damaging public trust in the federal aid system 42.
These delays resulted in colleges receiving student data months late, which meant millions of students were forced to commit to colleges without having received a financial aid offer or knowing their true net price 414244. FAFSA completion rates among high school seniors plummeted during this cycle, sparking fears of a long-term decline in college enrollment 4243. While the 2025 - 26 FAFSA cycle has shown strong signs of operational recovery and a return to predictability 45, the lingering effects of the rollout serve as a stark reminder that the affordability of college is intrinsically tied to the functionality of federal infrastructure and policy 4445.
The Trust Crisis in Higher Education
The chaotic intersection of high sticker prices, opaque discounting practices, flawed net price calculators, and federal application delays has resulted in a deep crisis of public trust. The complexity of determining what college actually costs has become a barrier to entry in itself.
A 2025 study conducted by the Strada Education Foundation found that 77% of adults consider college generally unaffordable 51. Furthermore, when these same adults were asked to estimate the actual net cost of a public four-year university, the vast majority overestimated the expense; only 22% of respondents correctly identified that the average student pays a net price between $20,000 and $29,999 51.
This pricing confusion has severe real-world implications. The Strada data links pricing confusion directly to distrust in the higher education sector; families who find the financial aid process confusing are significantly more likely to question institutional motives and believe colleges prioritize profits over education 46. More alarmingly, this lack of transparency leads to self-selection out of the system. Students from lower-income backgrounds frequently look at sticker prices and assume higher education is entirely out of reach, failing to realize that they are the exact demographic most likely to receive heavy discounting that would make their net price highly affordable 5146.
Until structural reforms - such as standardized financial aid offer letters and functional, universal net price calculators - are mandated by Congress, the burden remains on the consumer 1821.
Bottom line
The published sticker price of a college is largely an administrative ceiling and a marketing mechanism, encompassing both billed institutional charges and highly variable estimates of personal living expenses. The true cost of a degree is the net price, a highly individualized figure that factors in the generous institutional discounts and government grants that the vast majority of students receive. While the pricing system remains frustratingly opaque, families who ignore the initial sticker shock, utilize net price calculators critically, and navigate the FAFSA process will often find that higher education is far more affordable than the headlines suggest.