Market regime detection and adaptation in algorithmic trading
Financial markets are profoundly dynamic, characterized by latent structural states that govern asset pricing, volatility, and cross-asset correlations. These underlying states, commonly referred to as market regimes, dictate whether an environment is trending or mean-reverting, calm or turbulent, liquidity-rich or liquidity-constrained 123. Historically, quantitative finance relied heavily on static models - such as traditional mean-variance optimization or fixed-horizon trend following - that assumed stationarity in return distributions. However, empirical evidence repeatedly demonstrates that financial time series are inherently non-stationary; the statistical properties of markets change abruptly and often unpredictably, rendering static algorithms highly vulnerable to severe drawdowns during structural breaks 45.
The transition from static frameworks to regime-aware modeling represents a fundamental evolution in systematic investing 12. The primary objective of market regime detection is not necessarily the direct point forecasting of future asset prices, but rather the contextualization of the present environment 2. By answering the question of what specific market state an algorithm is operating within, quantitative systems can dynamically adjust their risk exposure, switch between strategy sleeves, modify leverage, and alter position sizing 238.
The recent epoch of quantitative research, particularly spanning 2023 through early 2026, has witnessed a massive leap in the sophistication of regime detection methodologies. This evolution is thoroughly documented in cutting-edge SSRN preprints, top-tier journals like Quantitative Finance, and authoritative whitepapers from established systematic funds such as AQR Capital Management and Man Group. Classical statistical approaches, such as Hidden Markov Models (HMMs) and change-point detection, have been increasingly augmented - and in some cases superseded - by deep learning architectures, Transformer-based sequence models, and quantum-enhanced Reinforcement Learning (RL) frameworks 910111213. Concurrently, institutional focus has shifted from the mere detection of regimes to the complex mechanics of algorithmic adaptation and the minimization of information latency 141516.
This comprehensive report explores the cutting-edge advancements in market regime detection and adaptation. It begins by examining the architectural shift from classical probabilistic models to advanced deep learning frameworks. It then analyzes the critical gap between regime occurrence, algorithmic detection, and systemic adaptation, highlighting the shift from reactive adjustments to predictive state modeling. Furthermore, the analysis investigates how regime changes manifest differently across diverse asset classes and geographic market microstructures, contrasting Developed Markets (DMs) with Emerging Markets (EMs). Finally, the report explicitly addresses the pervasive algorithmic pitfalls and misconceptions that plague regime-aware systematic strategies, including the illusion of instantaneous detection, the threat of overfitting to historical regimes, and the inescapable tradeoff between false positives and lagging indicators.
The Evolution of Regime Detection Architectures
The identification of market regimes requires inferring a persistent but unobservable market state from noisy, high-dimensional financial data 2. Because historical market data does not arrive with predefined labels indicating whether a given timestamp belongs to a "bull," "bear," or "crisis" regime, detection relies fundamentally on unsupervised or semi-supervised learning techniques 17. Over time, these techniques have evolved from strict probabilistic classifications to highly complex, attention-driven deep learning models capable of synthesizing vast arrays of microstructural signals.
Classical and Probabilistic Frameworks
For decades, the standard workhorse of market regime detection has been the Hidden Markov Model (HMM) 2173. HMMs assume that the market exists in one of $K$ discrete, hidden states, each characterized by its own distinct emission distribution (typically Gaussian, defined by a mean $\mu$ and variance $\sigma^2$) 19. The transition between these states is governed by a Markov chain, where the probability of moving to a new regime depends entirely on the current regime, mathematically expressed as $P(z_t = j | z_{t-1} = i) = A_{ij}$, where $A$ represents the state transition matrix 1920.
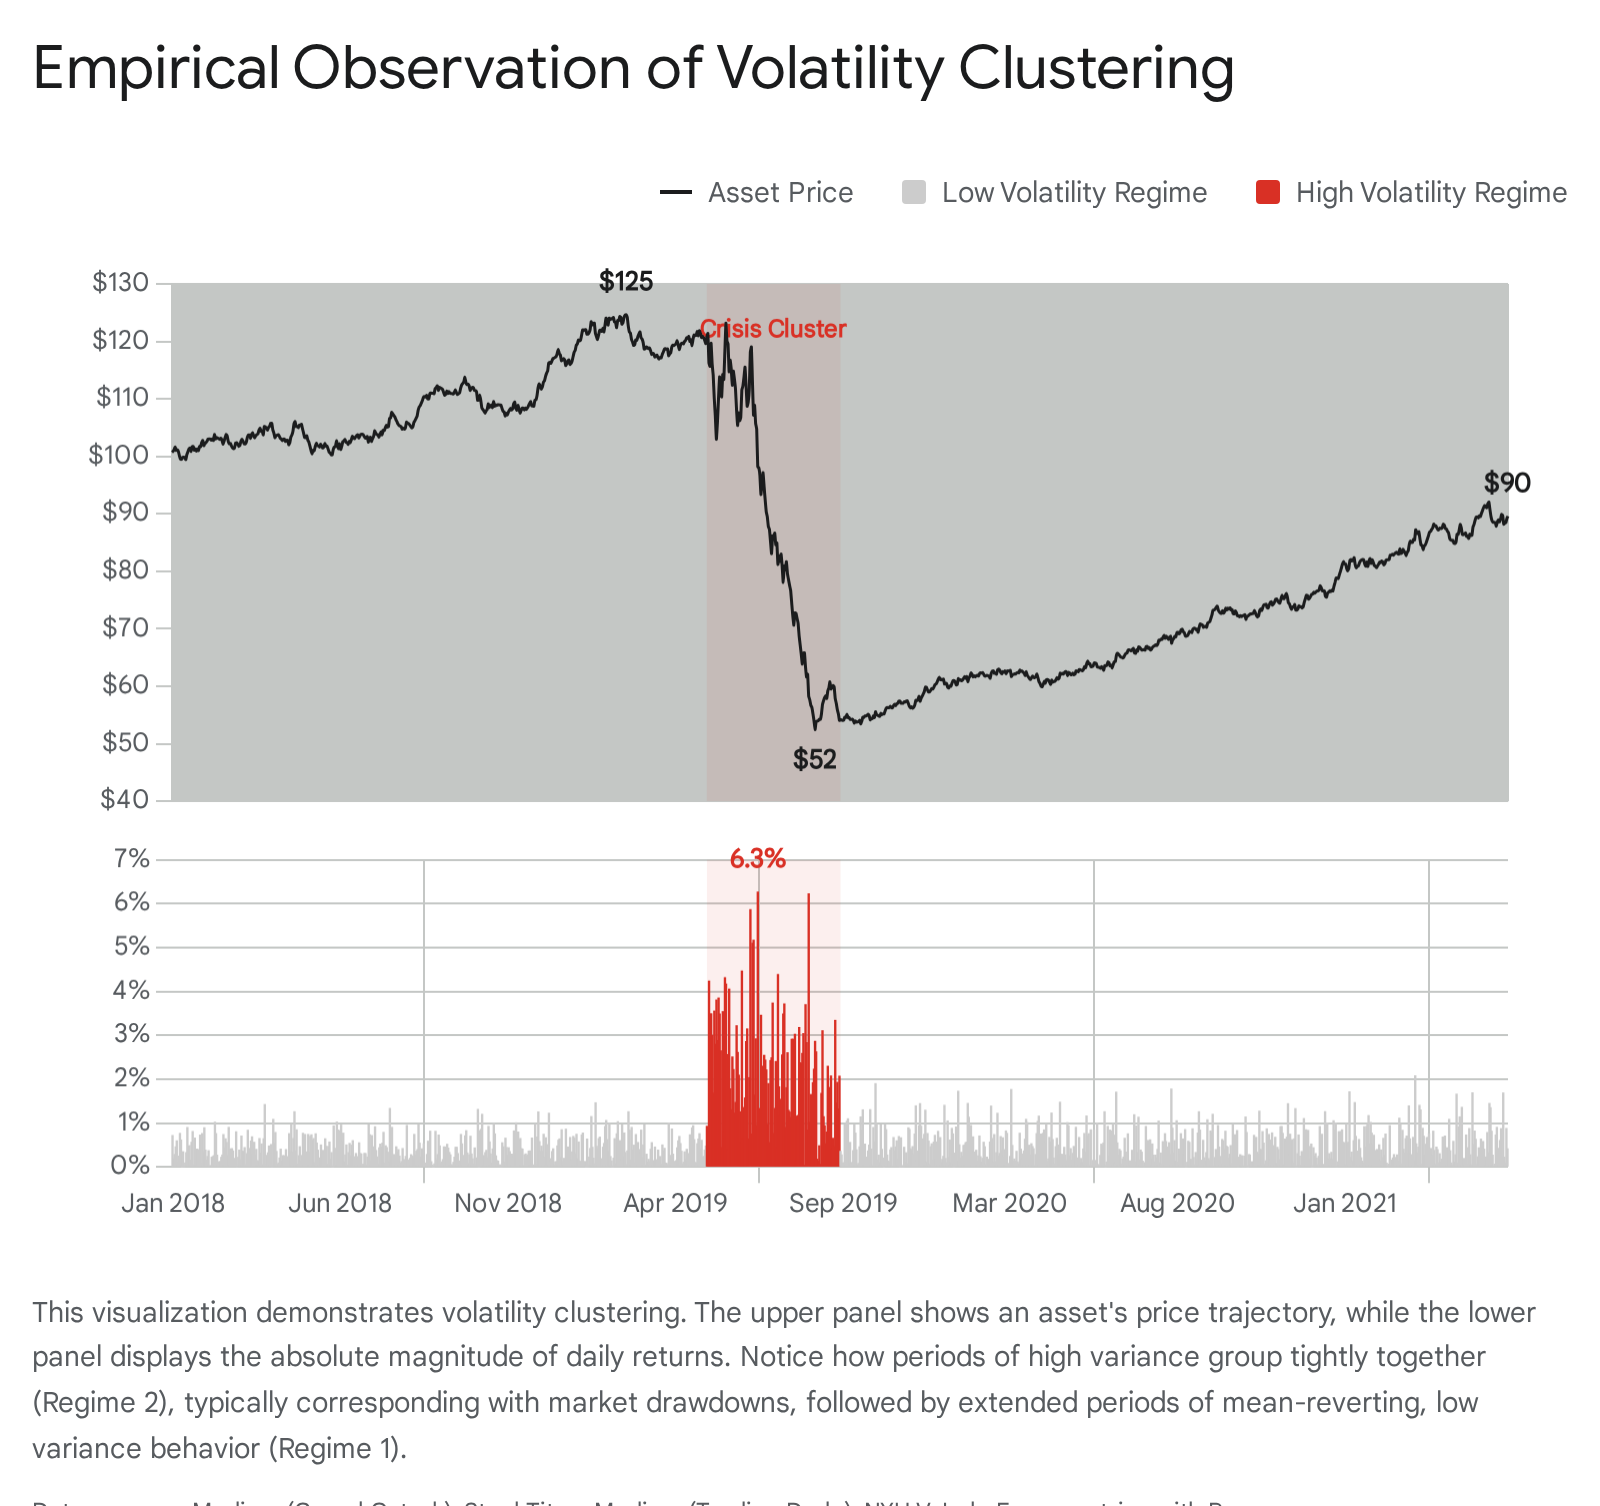
The primary theoretical strength of HMMs is their ability to capture the persistence of market states. Financial markets exhibit strong volatility clustering - a phenomenon where large price movements are frequently followed by further large movements, and calm periods breed further calm 2145. If a single day features an extreme volatility spike, an HMM does not immediately assume a regime shift, properly discounting the event as potential market noise. However, if a sequence of highly volatile days occurs, the transition matrix updates the latent state probabilities, providing mathematically sound evidence of a shift to a turbulent regime 224. Empirical modeling of indices like the S&P 500 using Gaussian HMMs reveals this state persistence clearly; the probability of remaining in a stable, low-volatility state often hovers around 97.75%, while the probability of transitioning directly from that low-volatility state into a high-volatility crisis state is a mere 4.53% 24. This demonstrates the structural infrequency of abrupt market breaks compared to the persistence of existing trends.
Despite their interpretability, classical HMMs and related Gaussian Mixture Models (GMMs) suffer from rigid distributional assumptions 1719. Financial returns are notoriously non-normal, exhibiting heavy tails, extreme skewness, and excess kurtosis. To address this, modern iterations deployed by institutional asset managers often employ t-distributed mixture models integrated with Generalized AutoRegressive Conditional Heteroskedasticity (GARCH) frameworks 1. The t-distribution is far superior to Gaussian variants for financial applications because it natively accounts for the heavy tails and extreme outliers that serve as key markers of systemic regime shifts 1.
Furthermore, non-parametric approaches utilizing Wasserstein distance - a metric derived from optimal transport theory that measures the dissimilarity between recent and historical price distributions on a continuous scale - have gained traction. These methods discover regimes from empirical data with minimal assumptions, capturing fundamental distributional shifts without relying on fixed mean or variance parameters 1925.
Deep Learning and Transformer-Based Advancements (2023+)
While HMMs excel at modeling low-dimensional temporal state changes, they struggle with the high-dimensional, non-linear realities of modern algorithmic trading, which must synthesize order book imbalances, macroeconomic indicators, and cross-asset correlations simultaneously 116. Consequently, the research frontier has aggressively shifted toward deep learning.
Early deep learning approaches relied on Recurrent Neural Networks (RNNs) and Long Short-Term Memory (LSTM) networks to capture the sequential nature of financial time series 627. LSTMs are inherently capable of mapping non-linear volatility scaling and long-term dependencies that linear trend-following models miss 15. A modern extension of this lineage is the Gated Recurrent Straight-Through Unit (GRSTU), a model introduced in 2024 that utilizes automatic differentiation and Adam optimization to efficiently categorize time series into distinct regimes. The GRSTU demonstrates particular robustness on smaller, noisier datasets where classical statistics falter, providing swift regime classification that translates into out-of-sample outperformance on equity indices like the S&P 500 9.
However, recursive models like LSTMs suffer from a strict information bottleneck: they must process data sequentially, making it computationally difficult to weigh the relevance of a distant historical regime against recent, high-frequency noise. This limitation has been systematically resolved by the introduction of Transformer-based architectures to financial time series 1315.
The Momentum Transformer (Wood et al., 2023) applies multi-head attention (MHA) to learn global temporal dependencies and regime-switching dynamics 15. By bypassing recursive bottlenecks, the causal temporal attention mechanism allows the model to attend directly to relevant historical regimes - such as past inflation shocks or sudden liquidity crises - regardless of their distance in time 15. This enables the model to explicitly internalize regime vulnerabilities during the training phase, rendering it more robust to out-of-sample structural breaks than traditional reactive filters 15.
Building on this, the Volatility-Aware Temporal Transformer (VATT) integrates volatility-specific inductive biases directly into the network architecture 12. VATT utilizes a specialized Volatility Gating Module (VGM) that dynamically modulates the attention mechanism based on the prevailing market regime 12. During periods of high volatility and structural uncertainty, the VGM contracts the model's receptive field to focus intensely on recent, high-frequency microstructure signals, such as depth-weighted spreads and Order Flow Imbalance (OFI). Conversely, during stable regimes, it expands its attention broadly across historical data to capture longer-term mean reversion 12. Crucially, the VGM is a lightweight convolutional block that adds negligible overhead compared to heavy matrix multiplications; VATT achieves an inference latency of approximately 4.1 milliseconds, making it viable for minute-level intraday trading systems, though it remains computationally prohibitive for microsecond-level high-frequency trading (HFT) 12.
Quantum-Enhanced Reinforcement Learning
The most complex leap in regime adaptation involves Deep Reinforcement Learning (DRL). Unlike supervised models that merely predict the next state or price, RL agents treat portfolio management as a continuous sequential decision-making problem. They continuously update their policies to maximize utility functions (e.g., Sharpe ratio or downside protection) while navigating changing, non-stationary environments 277.
A notable 2025 advancement in this space is the Q-A3C2 framework, a quantum-enhanced Asynchronous Advantage Actor-Critic model 11. Traditional RL models frequently suffer from catastrophic forgetting or severe overfitting when market regimes shift abruptly 29. Q-A3C2 addresses this by embedding Variational Quantum Circuits (VQCs) into the policy network to map financial features into high-dimensional Hilbert spaces, enhancing non-linear representation 11.
More importantly, the framework mitigates regime-shift vulnerability through an embedded time-series dynamic clustering mechanism. Instead of evaluating thousands of individual equities in a static, high-dimensional space, the agent operates on dynamic clusters that evolve monthly based on rolling macroeconomic structures 11. This reduces the feature dimensionality exponentially. By treating market interaction as a monthly episodic decision problem rather than a single continuous trajectory, the RL agent can recognize when the underlying market structure shifts from a high-volatility growth regime to a defensive-led regime, adapting its action space dynamically and capturing temporal shifts that static strategies fail to exploit 11.
Structural Comparison of Detection Methods
To synthesize the operational realities of these models, the following structural comparison contrasts the leading regime detection architectures across key performance metrics.
| Method | Latency & Execution | Computational Cost | Strengths | Weaknesses |
|---|---|---|---|---|
| Gaussian HMM | Extremely Low (Sub-millisecond) | Low (Standard CPU estimation techniques) | Highly interpretable transition probabilities; effectively models state persistence; robust against basic transient noise 192030. | Fails on high-dimensional data; strict distributional assumptions (normality) cannot accurately handle heavy fat-tails or extreme outliers 1719. |
| Wasserstein K-Means | Low (Dependent on specified window parameters) | Low to Medium | Unsupervised and non-parametric; captures true distributional shifts without relying on fixed mean/variance parameter assumptions 1925. | Hard boundaries (hard clustering) can oversimplify fuzzy, gradual regime transitions; performance degrades significantly with sparse historical data 119. |
| VATT (Transformer) | 4.1 ms (Inference Latency) | High (~9.1 hours training, GPU required) | Dynamic attention gating scales receptive field based on ambient volatility; synthesizes granular microstructure signals seamlessly 12. | Inference latency remains too high for ultra-fast microsecond HFT; heavily dependent on clean, continuous Level-2 limit order book data 12. |
| Q-A3C2 (Quantum RL) | High (Episodic monthly execution) | Very High (VQC mapping, 4,500 training epochs) | Continuous adaptation to non-stationary environments; time-series dynamic clustering prevents catastrophic overfitting during abrupt transitions 11. | Extreme implementation complexity; requires hybrid quantum-classical hardware (NISQ) simulation; lower interpretability of quantum feature mapping 11. |
The Dynamics of Adaptation: Latency, Strategy, and Prediction
Detecting a regime shift is a purely mathematical exercise; surviving it requires a robust, systemic adaptation mechanism. The efficacy of any regime-aware quantitative system is inherently constrained by the critical gap between when a regime shift structurally occurs, when the algorithmic model confirms the detection, and when the portfolio construction logically adapts to the new reality.
Latency and the Reactive vs. Predictive Paradigm
In the context of regime modeling, "latency" does not merely refer to network ping times or hardware execution speed; it refers to information latency and statistical lag 1531. Standard reactive models - which rely on moving averages, trailing volatility thresholds, or even basic hard-clustering HMMs - require a critical mass of post-transition data to trigger a state change 3. If a sudden macroeconomic shock transitions the market from a low-volatility bull regime to a high-volatility crisis regime, a reactive model might take days or weeks to accumulate enough statistical evidence to cross a 95% confidence threshold 25. During this lag, the strategy continues executing logic perfectly suited for the prior regime, leading to severe and rapid drawdowns. As quantitative researchers note, traditional indicators track the symptoms of a shift rather than identifying the underlying structural change 25.
To minimize this lag, institutional research has pivoted decisively toward predictive state modeling and soft clustering. Instead of assigning a "hard" binary classification (e.g., State 0 or State 1), Markovian soft filters use forward-backward algorithms to generate a continuous posterior distribution of regime probabilities in real-time 32. These regime smoothing probabilities are then utilized as dynamic weights within regime-specific regression or forecasting models 328. Consequently, adaptation becomes fluid rather than binary. If the probability of a "crisis" regime creeps from 5% to 25% over a three-day window, a predictive, regime-aware system preemptively scales down leverage, reduces position sizing, and widens execution stops incrementally, rather than waiting for the probability to breach an arbitrary 50% threshold to execute a sudden, massive portfolio liquidation 232.
Time-Scale Diversification and the "Barbell" Strategy
A central theme in recent authoritative research from top systematic funds - most notably AQR Capital Management and Man Group - is the fundamental reevaluation of how algorithms adapt across multiple time horizons during regime shifts 141634.
Historically, Commodity Trading Advisors (CTAs) and trend-following funds managed regime uncertainty by diversifying across a dense grid of lookback windows (e.g., 20, 60, 125, 250, and 500 days), often applying static equal weights to each horizon 1416. The prevailing theory was that a multi-horizon approach would naturally smooth performance across abrupt regime shifts, mitigating the risk of being caught on the wrong side of a sudden reversal.
However, recent studies optimizing horizon weights dynamically at the asset level using Bayesian graphical models reveal a critical flaw in this consensus. Research shows that the medium-term horizon (e.g., the 125-day lookback layer) is statistically redundant 1434. Once short-term and long-term components are included in the model, the medium-term band contributes negligible incremental performance and essentially overlaps with its neighbors. During choppy, transitioning markets - such as the volatile macroeconomic environment of 2024 - 2025 - medium-term sleeves frequently suffer from "whipsawing." They buy late into a brief rally and sell late into a brief dip, exhibiting severely lagging behavior that fails to recover following market drawdowns 14.
The adaptive solution proposed by leading researchers is the structural "Barbell" approach 141634. By excising the medium-term layer entirely, systematic funds combine only the extreme ends of the spectrum: short-term horizons (20-to-60 day) to provide immediate convexity, reactivity, and drawdown mitigation during sudden regime shocks, paired exclusively with long-term horizons (250-to-500 day) to capture persistent, slow-moving macroeconomic trends 1634. This specific adaptation mechanism reduces model complexity, minimizes redundant trading costs, and vastly improves Sharpe ratios across shifting environments by acknowledging that static allocations implicitly, and incorrectly, assume the relative importance of each horizon remains constant across time 1416.
Mapping Strategies to Regime Types
When a predictive system detects a valid probabilistic shift in the market state, the physical execution logic must alter entirely. The following table outlines how core quantitative strategies adapt to specific structural regime transitions, highlighting specific adjustments to risk management parameters.
| Transition Type | Execution Strategy & Tactical Shifts | Position Sizing & Risk Management | Latency & Alert Thresholds |
|---|---|---|---|
| Low-to-High Volatility | Shift from gradual trend-following or short-volatility carry trades to short-term tactics (e.g., scalping, intraday mean-reversion) 8. | Drastically reduce position sizes to normalize portfolio Value-at-Risk (VaR). Tighten stop-losses immediately to protect capital from rapid adverse price excursions 8. | Alert intervals shrink from 60+ minutes to 1 - 5 minutes. Minimum price-movement thresholds lowered to as low as 0.5% 8. |
| High-to-Low Volatility | Deploy long-term trend-following, options selling (collecting premium), and broader macroeconomic factor strategies 8. | Expand position sizes as the risk per unit of capital decreases. Widen stop-losses to prevent premature exits triggered by normal market noise 8. | Alert intervals expanded to hourly or daily limits. Avoid over-managing and overtrading positions 8. |
| Trend-to-Mean-Reverting | Deactivate directional indicators (e.g., Moving Averages, ADX). Activate boundary-based oscillators (RSI, Bollinger Bands) to fade overextended price moves 38. | Adopt wider stops to account for temporary price moves within the established support/resistance range. Trade smaller size at the absolute boundaries 8. | 30 - 60 minute intervals. Thresholds set to ~1.5% to capture wider range rotations 8. |
| Mean-Reverting-to-Trend | Deploy breakout strategies and volatility expansion logic. Fade boundary-reversion algorithms as ranges widen and momentum accelerates 38. | Utilize trailing stops to capture extended moves. Reward decisiveness and conviction by adding to winning positions on pullbacks 38. | 5 - 15 minute intervals. Focus heavily on volume confirmation upon boundary breaks to avoid false starts 8. |
Cross-Asset and Geographic Manifestations of Regime Shifts
Market regimes do not manifest uniformly across the financial ecosystem. The microstructural characteristics of the specific asset class and the geographic region fundamentally dictate how a regime shift propagates, the speed at which it occurs, and the specific variables that serve as reliable early warning signals.
Asset Class Microstructures: Equities, FX, and Crypto
Equities: Regime shifts in equity markets are heavily influenced by the broader business cycle, corporate earnings revisions, and central bank discount rates 35. They are characterized by intense volatility clustering and distinct sector rotations 9. For instance, a recent comprehensive study of the Johannesburg Stock Exchange (JSE) from 2007 to 2024 utilized a Markov Switching Model to capture regime shifts between bull and bear markets, revealing that liquidity behaves asymmetrically across sectors 9. During a shift from an expansionary to a contractionary regime, defensive sectors (such as utilities, financials, and retail) tend to retain liquidity and market depth. Conversely, cyclical and highly debt-reliant sectors (such as technology, telecommunications, and consumer discretionary) experience severe liquidity droughts and widened bid-ask spreads 9. An equity-focused regime algorithm must therefore monitor sector-level liquidity degradation as a leading indicator of a broader market shift.
Foreign Exchange (FX): Unlike equities, which represent absolute valuations with a theoretical floor of zero, currencies trade in relative pairs representing the divergent monetary policies, trade flows, and risk tolerances of sovereign nations 35. FX regimes are largely dictated by interest rate differentials, inflation disparities, and the unwinding of carry trades 3537. A structural shift in FX often involves a rapid, violent reversal of capital flows. To manage this, classical regime identification techniques, such as the four-state regime-switching (PRS) model, are explicitly tailored for FX. This model identifies distinct market conditions based on the direction and magnitude of deviations of the FX spot rate from its long-term trend, dynamically adjusting optimal hedge ratios to capture the asymmetry and fat-tail characteristics inherently present in FX return distributions 38.
Cryptocurrency: Crypto markets possess a uniquely fragmented microstructure characterized by 24/7 continuous trading across dozens of centralized and decentralized venues 3510. Regime shifts in this asset class are often triggered by deterministic supply shocks (e.g., Bitcoin block reward halvings) as well as speculative leverage liquidations in the derivatives markets 35. Advanced temporal analysis of cryptocurrency perpetual futures (covering 26 exchanges and 812 symbols) reveals a persistent two-tiered market structure 10. While top-tier centralized exchanges are tightly integrated, decentralized and mid-tier exchanges exhibit significant fragmentation. Notably, structural break tests on this market detect no discrete regime shifts; instead, the market evolves through gradual drift 10. Furthermore, Granger causality tests show that during certain volatile regimes, price discovery often originates on these mid-tier venues before propagating to major exchanges like Binance 10. Consequently, an adaptive crypto algorithm must ingest funding rate disparities, multi-venue basis spreads, and temporal drift patterns to detect regime transitions, rather than relying solely on single-exchange spot price action.
Developed vs. Emerging Markets: A Shifting Dynamic
The traditional macroeconomic consensus held that Emerging Markets (EMs) are inherently riskier, exhibiting higher volatility and beta compared to Developed Markets (DMs), effectively making them a leveraged, high-beta bet on global economic cycles 11. However, in recent years, this fundamental dynamic has experienced a structural regime shift of its own.
By 2025, structural improvements in EM macroeconomic governance and corporate fundamentals, combined with increased unpredictability in DM economies (e.g., inflation shocks, unprecedented monetary tightening, and fiscal dominance), resulted in a profound convergence of risk profiles 1142. The realized equity volatility in EMs is now remarkably similar to DMs, and EM sovereign bond yield spreads relative to G-7 countries have compressed to historical lows 1143. This resulted in a broad-based re-rating; in 2025, EM equities outperformed their DM counterparts by 3.7% in US dollar terms, supported by EM 2-year forward EPS growth forecasts standing at 16% (more than three times that of the US at ~5%) 43. Examining rolling 3-year time frames, the beta of the MSCI Emerging Markets index to its developed market counterpart has consistently remained below one .
Despite this convergence in volatility and performance, the microstructure of EMs still dictates a vastly different approach to algorithmic regime detection and adaptation. Emerging markets suffer from pervasive data sparsity; there are fewer analysts, fewer high-frequency data feeds, and shallower limit order books 37. Because liquidity is generally lower and transaction costs are higher, the market impact of algorithmic trading is significantly magnified. Therefore, quantitative strategies transplanted directly from a DM to an EM often fail 37.
In an EM context, regime adaptation models must prioritize algorithms with lower turnover to mitigate these execution frictions, and they must incorporate non-standard proxy variables to compensate for missing economic data points 37. Furthermore, the transmission mechanism of regime shifts differs fundamentally. For example, using interest rate differentials to trade FX works well in DMs, where higher inflation pushes yields higher and results in a stronger currency due to central bank credibility. However, in EMs, this relationship frequently breaks down; during periods of risk aversion, investors tend to dump local EM bonds (driving yields higher) and sell the EM currency simultaneously 37. Thus, algorithms must be contextually aware of the region's specific macroeconomic vulnerabilities.
Addressing Common Misconceptions and Algorithmic Pitfalls
The widespread adoption of machine learning in quantitative finance has cultivated a dangerous sense of infallibility among practitioners. Regime detection is particularly susceptible to statistical illusions, cognitive biases, and engineering flaws that can quietly erode alpha while presenting a facade of mathematical certainty.
The Illusion of Instantaneous Real-Time Detection
A pervasive myth in algorithmic trading is that advanced models can detect a regime shift the exact millisecond it occurs. This is fundamentally impossible due to the physical nature of structural breaks. As proposed by the deterministic framework DSM-861, markets actually evolve as constrained dynamic systems within a high-dimensional space 5. In this framework, the true market state is represented in 10 dimensions, which includes a 6-dimensional "hidden reservoir" of internal dynamics (e.g., order flow imbalance proxies, skewness, kurtosis, jerk, and cross-asset divergence) 5.
However, traders and standard algorithmic models typically only observe a 4-dimensional projection (price return, range, volume, and time phase) 5. Because the underlying structural tension builds in the unobservable dimensions long before manifesting in price action, a purely price-based reactive model will always be inherently late 544. An algorithm declaring a "real-time" regime change based solely on a single day's severe price drop is likely reacting to transient noise rather than a true structural break 2. True detection requires the accumulation of statistical evidence over time, making instantaneous confirmation a mathematical illusion. Recent studies on limit order book data demonstrate that even trigger-based detectors leveraging advanced channels like depth erosion and HMM entropy have theoretical bounds on lead-time, proving that performance degrades severely in low signal-to-noise ratio environments with short build-ups 44.
The Strict Tradeoff: False Positives vs. Lagging Indicators
Because instantaneous detection is impossible, quantitative researchers are forced to navigate a strict, inescapable tradeoff between false positives and lagging indicators 125. This tradeoff is directly controlled by the model's signal significance threshold (e.g., the p-value or probability threshold required to validate a state change) 25.
If a developer sets a high sensitivity threshold (e.g., a significance level of 0.10 or 10%) to react quickly to nascent transitions, the algorithm will generate a barrage of false positives 25. The system will constantly shift the portfolio in response to standard market noise, resulting in excessive turnover, debilitating transaction costs, and rapid "whipsaw" losses 114. Conversely, if the developer sets a highly conservative threshold (e.g., 0.01 or 1%) to demand absolute statistical certainty before acting, the system virtually eliminates false positives but becomes a severely lagging indicator 125. By the time the algorithm achieves 99% confidence that a market crash has occurred, the portfolio has already absorbed the majority of the drawdown 25. There is no perfect mathematical solution to this paradigm; practitioners must calibrate this threshold explicitly based on the strategy's specific capacity for transaction costs versus its tolerance for maximum drawdowns.
The Overfitting Trap and Historical Regimes
The most lethal pitfall in systematic regime modeling is overfitting 1745. With the advent of immense computational power, it is remarkably easy to train a deep learning model to perfectly classify every historical regime shift over the last twenty years. This results in a "backtest illusion," where the equity curve appears perfectly smooth, having gracefully sidestepped the 2008 Financial Crisis and the 2020 COVID-19 crash by avoiding losses in volatile periods 17.
However, this occurs because the algorithm has learned to memorize the specific noise and idiosyncratic symptoms of past crises rather than the true underlying market structure . Financial regimes rarely repeat identically. A model optimized purely on the liquidity and credit dynamics of the 2008 mortgage crisis will likely fail to identify a regime shift triggered by an unprecedented global pandemic, a rapid artificial intelligence productivity shock, or an unexpected change in fiscal dominance 4245. If an algorithm is brittle - meaning small changes in out-of-sample data cause massive, erroneous shifts in regime classification - the strategy will abruptly collapse in live trading . To mitigate this, robust systems employ techniques like strict out-of-sample validation, injecting synthetic noise into training data, and utilizing unsupervised clustering methods that discover organic regimes without relying on predefined historical labels to prevent the network from memorizing the past 17.
Conclusion
The pursuit of algorithmic resilience has driven market regime detection far beyond the rudimentary application of moving averages and static volatility thresholds. The integration of Gaussian Hidden Markov Models, Volatility-Aware Temporal Transformers, and Quantum-Enhanced Reinforcement Learning allows modern quantitative systems to process high-dimensional microstructure data, categorize latent market states, and adapt policies in fluid, non-stationary environments.
However, the deployment of these technologies requires a highly nuanced understanding of their operational limitations. The persistent gap between regime occurrence, mathematical detection, and physical execution necessitates a fundamental shift from reactive liquidations to predictive, probability-driven risk scaling. Furthermore, geographical and microstructural discrepancies - such as the fragmentation of crypto venues, the changing risk profile of Emerging Markets, and the breakdown of traditional cross-asset correlations - prove that a monolithic approach to regime detection is structurally flawed. Ultimately, the success of a regime-aware strategy does not lie in achieving the illusion of instantaneous detection, but in mastering the careful calibration between statistical confidence and execution latency, ensuring that the algorithm survives the transition long enough to exploit the new paradigm.