What Is Market Regime Detection and How AI Spots It
Market regimes are persistent economic environments - such as calm bull markets or high-volatility crashes - that dictate how financial assets behave. Artificial intelligence detects these invisible shifts by using probabilistic models and deep learning to read subtle changes in price, volatility, and cross-asset correlations before traditional indicators can catch up. By continuously identifying the current market state, AI allows investors to dynamically adapt their strategies, rotate asset classes, and protect their portfolios from sudden structural breaks.
The Anatomy of a Market Regime
Most traditional trading strategies and investment portfolios are built with a quiet assumption baked in: the market behaves the same way all the time. Investors optimize their parameters, run a historical backtest, and deploy their capital. But financial markets are non-stationary. The statistical properties of asset prices - their mean returns, variance, and autocorrelations - shift abruptly due to macroeconomic shocks, monetary policy pivots, or sudden changes in liquidity 1.
A market regime is simply the dominant behavioral pattern of a price series at a given time 2. Markets do not explicitly announce when they are transitioning from a stable growth period into a volatile recession. Instead, they leave statistical footprints. The core problem in quantitative finance is not finding a pattern that works, but knowing when that pattern has ceased to exist 1.
Think of a market regime like the weather. Markets alternate - sometimes predictably, sometimes unpredictably - between fundamental states. Trending regimes are periods where price moves persistently in one direction. During these windows, momentum is real, breakouts follow through, and trend-following systems generate immense returns 2. Conversely, mean-reverting regimes are periods where price oscillates around a central value. Breakouts fail, and trend-following systems get whipsawed to pieces. These choppy windows favor range-bound strategies and liquidity fade setups 23.
The problem is not that strategies fail; it is that every strategy fails in the wrong regime. A moving average crossover system built for trending markets will generate endless false signals in a choppy tape. Neither system is inherently wrong - they are just operating outside their intended conditions 2. Regime detection is the practice of identifying which mode the market is currently in, allowing an investment system to adjust its behavior, risk parameters, and asset allocation accordingly 245.
The Four Universal Market States
While different institutions label them uniquely, recent machine learning research by State Street Global Advisors (SSGA) analyzed U.S. equity data from 1995 to 2024 and broadly categorized market environments into four distinct regimes 2:
- Emerging Expansion: Historically the most prevalent regime (accounting for 42.34% of observations), this is often a transitory stage where risk assets begin showing stronger returns 2. During this phase, technology and small-cap stocks tend to excel due to their heightened sensitivity to economic growth and agility in domestic recoveries. Conversely, long-duration U.S. Treasuries often perform poorly here, as stable economic growth raises expectations of increasing interest rates 2.
- Robust Expansion: A strong "risk-on" period characterized by sustained returns for risk assets and the lowest levels of market uncertainty among all regimes. This phase accounts for roughly 25% of observations 2.
- Cautious Decline: A transitory phase bridging expansion and turmoil, marked by generally negative returns for risk assets and rising uncertainty 2.
- Market Turmoil: Overlapping with the worst historical drawdowns of the S&P 500 (such as the 2008 Global Financial Crisis and the 2020 COVID-19 shock). Risk assets perform poorly with high inconsistency. In this regime, broad-based U.S. Treasuries act as the ultimate safe haven, achieving their highest average returns with relative certainty 2.
The Evolution of Market Timing: From Simplicity to Complexity
For decades, quantitative analysts relied on simple, linear models to define market states. They categorized markets using lagging indicators like "boom" and "bust" cycles, moving averages, or simple "risk-on" versus "risk-off" sentiment thresholds 3.
The guiding philosophy in quantitative finance has long been parsimony - the idea championed by statisticians like George Box that the simplest model with the fewest parameters is the most robust, as it avoids "overfitting" to historical noise 4. However, researchers at AQR Capital Management, led by Head of Machine Learning Bryan Kelly, have recently sparked a fierce debate by introducing the "virtue of complexity" 9511.
AQR's research suggests that traditional, simplistic models regularly miss the rich, non-linear relationships that dictate modern market movements 9. Financial data is incredibly noisy and sparse. When analysts try to compress global macroeconomics into a simple linear regression, they actually underfit the data, leaving valuable performance on the table 911. AI and deep learning models, some utilizing over 10,000 parameters, are proving uniquely capable of mapping these complex, non-linear market shifts. Rather than repackaging old momentum strategies, these complex models use implicit regularization to learn from massive datasets without falling victim to the catastrophic breakdowns that plagued older models 96.
How Artificial Intelligence Detects Regime Shifts
Markets do not explicitly broadcast their underlying state. Therefore, AI treats the market regime as a "hidden" variable. It uses the noisy data we can observe - prices, volume, spreads - to infer the latent structure happening beneath the surface 34. In this sense, regime detection sits between raw price forecasting and pure descriptive statistics 3.
Hidden Markov Models (HMMs): The Traditional Gold Standard
The Hidden Markov Model (HMM) is widely considered the gold standard for traditional market regime detection 13. An HMM is a probabilistic, state-space model that assumes the market moves through a sequence of finite, unobserved states 57.
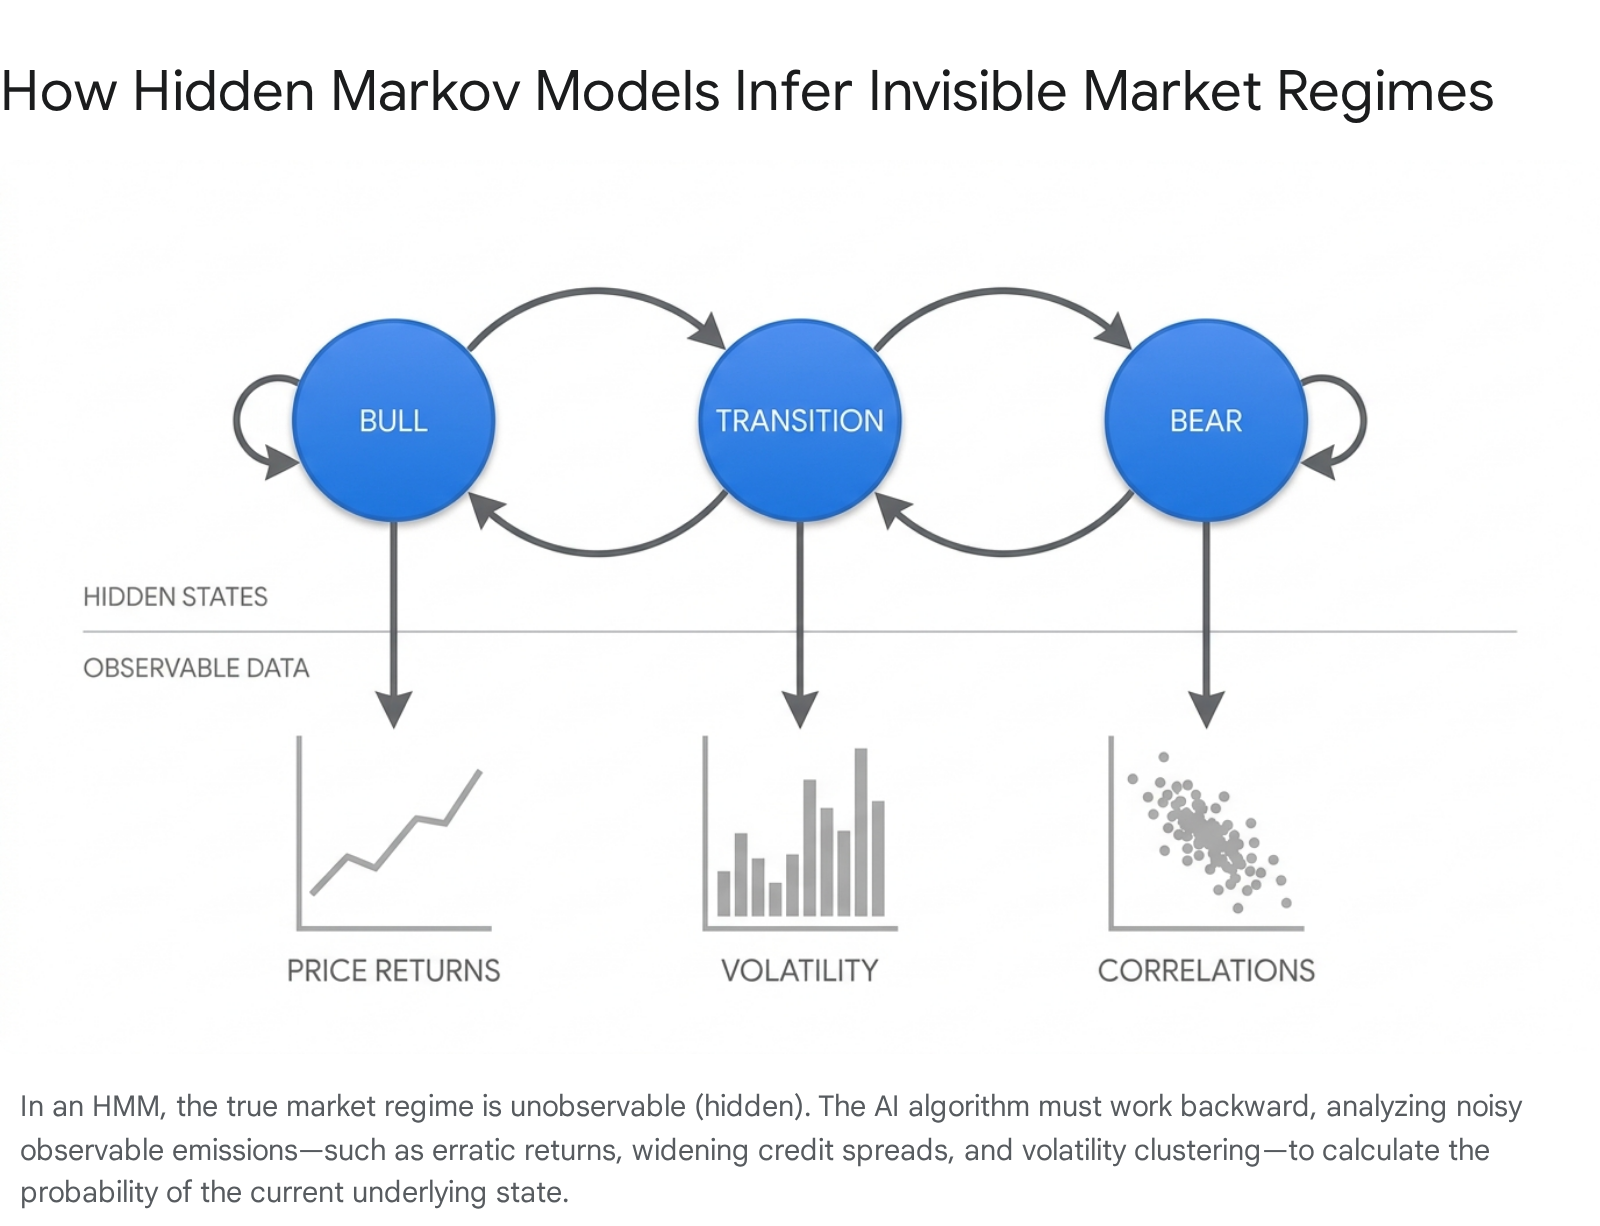
The single idea that makes HMM-based regime detection work is the combination of state persistence and state-specific observation patterns 3. If states did not persist, there would be no value in identifying regimes; if observations did not differ by state, no algorithm could tell them apart 3. For example, in a "normal" state, daily returns might be small and volatility subdued. In a "crash" state, returns become erratic and downside moves are much larger 35. The HMM's job is to analyze today's noisy emissions and calculate the probability that the market has transitioned into a new state, updating its transition probabilities continuously 38.
However, HMMs are not flawless. Studies by the London Stock Exchange Group (LSEG) demonstrate that while HMMs successfully identify major crash periods (like the 2008 financial crisis or the 2020 COVID-19 shock), they can suffer from detection lag 9. Furthermore, HMMs often struggle to reproduce the slow decay of the autocorrelation function found in squared daily returns - a critical stylized fact in financial risk management 7. By the time the HMM confirms a bear regime, the market may have already absorbed the worst of the damage.
Gaussian Mixture Models (GMMs) and Clustering
Another popular unsupervised learning approach is clustering, primarily via Gaussian Mixture Models (GMMs) or K-Means. A GMM assumes that all market data points are generated from a mixture of a finite number of Gaussian (normal bell curve) distributions 3.
If you feed multiple features - such as the VIX, Treasury spreads, and high-frequency volume data - into a GMM, it clusters market days into distinct historical environments. For instance, Cluster 1 might represent a liquidity-driven rally with low yields and rising prices, while Cluster 2 represents an inflationary shock with rising yields and falling prices 1. Quantitative firms like Two Sigma have effectively used GMMs to map specific market conditions - such as a "Crisis" state or a choppy "Walking on Ice" state - allowing them to stress-test portfolios against historically persistent regimes 3. SSGA utilizes a variation of this: a t-distributed mixture model integrated with Generalized AutoRegressive Conditional Heteroskedasticity (GARCH). The t-distribution is preferred over a standard Gaussian model because it better handles the heavy tails and extreme outliers common in financial data 2.
Traditional K-Means clustering, however, often struggles in finance. K-Means relies heavily on Euclidean distance to form clusters. This metric is highly sensitive to feature scales and outliers, making it ill-suited for financial data, which is fundamentally non-independent and prone to fat-tailed distributions 10. As a result, modern quantitative funds are moving toward more advanced, distribution-aware clustering metrics (like Wasserstein distance) to map regimes more accurately 1011.
Directional Changes: A Time-Agnostic Approach
A fascinating divergence in regime detection involves stepping away from traditional time-series analysis entirely. Standard models sample data at regular intervals (seconds, minutes, days), which can obscure the true structural shape of a price movement.
The "Directional Changes" (DC) framework instead summarizes price movements over time by sampling at irregular intervals based on specific price thresholds 8. If an asset's price drops by a predetermined threshold (say, $Q$), it triggers a Directional Change event. This is followed by an "Overshoot" event, where the trend continues until it reverses by that same $Q$ threshold 8. By measuring the total price movement (TMV) and the time taken for these specific threshold events to occur, Hidden Markov Models can detect regime changes based purely on the structural magnitude of market fluctuations, completely removing the noise of arbitrary daily closing times 8.
Deep Learning: Variational Autoencoders and Transformers
The absolute frontier of regime detection relies on deep learning neural networks - specifically Variational Autoencoders (VAEs) and Transformer architectures 1819.
Older statistical models like HMMs and GMMs handle broad clusters well but struggle with non-linear changes and market "memory" 18. A Variational Autoencoder can capture deep, non-linear structural anomalies by encoding features into a probabilistic, low-dimensional latent space where clustering is significantly clearer 19.
More importantly, Transformer models - the same underlying architecture that powers generative AI - introduce temporal awareness 1819. Classical convolutional layers extract local features, but Transformers utilize attention mechanisms to analyze relationships across all time steps simultaneously 12. Instead of looking at isolated static data points, Transformers learn from sequential context. They identify the temporal signatures and sequences of events that inevitably lead to regime shifts, offering a far stronger framework for understanding how markets evolve 19. Recent empirical studies comparing deep learning architectures to traditional econometric models (like ARIMA, ETS, and GARCH) show that Transformer-based models achieve significantly lower forecasting errors (RMSE and MAE) and stronger generalization, particularly during highly volatile periods like the 2022 inflation shock 121314.
Comparing AI Regime Detection Models
| Model Type | Primary Mechanism | Strengths | Weaknesses |
|---|---|---|---|
| Hidden Markov Models (HMM) | Infers unobservable states from observable "emissions" (returns, volatility). | Excellent at capturing state persistence and smooth transitions. The historical industry gold standard 13. | Prone to detection lag; often confirms a regime shift only after the initial shock has occurred 9. |
| Gaussian Mixture Models (GMM) | Clusters data based on underlying probability distributions 3. | Great for identifying distinct, non-overlapping market states from massive datasets 3. | Lacks inherent temporal awareness; treats data points as largely independent 318. |
| K-Means Clustering | Groups data points by minimizing distance to a central centroid 49. | Computationally simple, fast, and easy to interpret 23. | Highly sensitive to outliers; Euclidean distance fails on fat-tailed financial data 10. |
| Transformers & Deep Learning | Uses attention mechanisms to learn sequential and non-linear patterns over time 1912. | Captures complex temporal dependencies, sequence memory, and non-linearities far better than classical models 181912. | Computationally heavy and requires massive training data; functions as a "black box" 19. |
The Data That Fuels AI Regime Detection
An AI model is only as good as the data it ingests. To successfully map the market, quantitative models cannot rely on price alone. They require a multi-dimensional array of features to triangulate the market's true state 9.
- Volatility and Liquidity: The CBOE Volatility Index (VIX) and the volume profile of major indices are critical. Regimes are frequently defined by the shift from low to high volatility. Financial markets exhibit "volatility clustering," where periods of heightened uncertainty occur in succession 428.
- Cross-Asset Correlations: True market regimes reveal themselves in how different assets interact. For example, the spread between the High-Yield Corporate Bond ETF (HYG) and the Investment-Grade Corporate Bond ETF (LQD) is a powerful proxy for systemic credit stress. When equities are rising but credit spreads are widening, the AI detects a structural divergence 23.
- Market Breadth: This measures the percentage of individual stocks participating in a broader market move. If the S&P 500 is rising but small-cap stocks are lagging, the AI notes an equity beta dispersion, warning of a fragile, late-cycle regime driven by a handful of mega-cap stocks 232425.
- Macroeconomic State Variables: To prevent the AI from getting lost in purely technical noise, models ingest fundamental data. Indicators like inflation metrics, copper-to-oil ratios, and interest rate spreads (often sourced from Federal Reserve Economic Data, or FRED) provide independent data streams that ground the AI in economic reality 151617.
- Alternative Data and Sentiment: Advanced models increasingly incorporate Natural Language Processing (NLP) to parse sentiment from news headlines (Reuters, Bloomberg) and social media (Reddit, Twitter). Deep learning models utilizing LSTM and GRU units can detect temporal dependencies in sentiment dynamics, aiding high-frequency trading decisions 16.
Real-World Applications: From Wall Street to Main Street
The detection of market regimes is no longer restricted to elite hedge funds executing statistical arbitrage. The technology is actively reshaping retail investing, exchange-traded funds (ETFs), and institutional wealth management.
Smart Beta ETFs and Factor Rotation
Smart Beta ETFs attempt to strike a middle ground between passive index tracking and active stock picking. Rather than weighting stocks purely by market capitalization, they tilt portfolios toward specific fundamental factors like value, momentum, quality, or low volatility 293031.
Because different factors perform well in different regimes, AI is increasingly being used to dynamically rotate these exposures. For instance, in a low-volatility bull regime, an AI might overweight momentum factors. If the AI detects a transition to a high-volatility bear regime, the ETF can automatically shift toward low-beta defensive stocks 5.
The Goldman Sachs ActiveBeta Emerging Markets Equity ETF (GEM) utilizes a multi-factor approach (durable momentum, high quality, good value, low volatility) to navigate complex ex-U.S. equities, successfully outperforming its category averages 32. Other strategies are even more defensive. Funds like Merlyn.AI deploy genetic algorithms and advanced signal processing to evolve competing sets of candidate models. Using their proprietary StormGuard and SwanGuard software, they assess market risk across key metrics. When a bear market is detected, the ETF automatically switches to a 100% defensive holding pattern (like medium- and long-term Treasuries) to avoid risk entirely rather than merely diluting it 18.
Similarly, in environments where interest rates are high and capital is expensive, specific quality and cash-flow factors outshine broad momentum. ETFs like Pacer US Cash Cows 100 (COWZ) and iShares MSCI USA Quality Factor (QUAL) thrive in regimes where companies must self-fund growth rather than rely on cheap debt 34.
The Explosive Growth of Robo-Advisors
Robo-advisors have democratized portfolio management, utilizing algorithms based on Modern Portfolio Theory to automatically allocate, diversify, and rebalance assets for retail investors 353619. The market is experiencing explosive growth, projected to expand from $14.25 billion in 2025 to over $54.74 billion by 2030, driven by a 30.8% compound annual growth rate 1938.
While early robo-advisors relied on static risk questionnaires, the next generation relies on AI-driven regime awareness 19. By understanding the macro environment, advanced robo-advisors can proactively execute automated tax-loss harvesting during identified market drawdowns, offsetting capital gains to minimize tax liabilities 3539. For example, Wealthfront's Smart Beta strategy effectively navigated the 2022 market correction by leaning into defensive factors like low volatility, successfully outperforming its benchmark during that specific regime 40.
Furthermore, the industry is pivoting heavily toward hybrid models. Pure automation works perfectly in bull markets, but during volatile regime transitions, retail investors tend to panic. Hybrid models combine algorithmic precision for portfolio allocation with access to human financial advisors who step in to provide behavioral coaching when the AI flags a stressful market regime 1941.
Institutional Frameworks and Macro Investing
At the institutional level, asset managers like BlackRock rely heavily on modular machine learning and tools like Aladdin. BlackRock's Systematic investment team developed the Augmented Investment Management (AIM) framework, which generates alpha forecasts from vast, unstructured signal libraries 2021.
To prevent models from overfitting to a specific, localized market environment, BlackRock employs rigorous training techniques that expose the AI to a higher frequency of negative states 20. This ensures the algorithms adapt swiftly to structural regime shifts, transforming complex local datasets - like regional GDP or foot traffic - into tradable global macro exposures 22. Institutional desks essentially run a "Model of Models," where a detector (like an HMM) identifies the regime, a selector logic chooses the optimal sub-strategy, and an executor tailors the trade execution parameters to the prevailing liquidity conditions 1.
Regime Shifts in Emerging vs. Developed Markets
The application of AI regime detection varies significantly between developed and emerging markets (EMs). Developed markets offer massive, clean, and high-frequency datasets, making them ideal for complex deep learning models. Emerging markets present unique challenges due to sparse data, lower liquidity, and frequent structural breaks caused by geopolitical instability 2324.
However, emerging markets also present immense opportunities for AI disruption. EMs control the extraction of key AI infrastructure commodities - such as copper, lithium, and cobalt. As the global AI buildout surges, requiring massive capital expenditures and data center infrastructure, EMs like Chile, Brazil, and Indonesia are structurally exposed to upstream supply chains 24. This demand can create an uptick in economic growth and creditworthiness, effectively triggering localized bull regimes that AI-driven macro models are eager to detect 24.
Conversely, emerging economies that rely heavily on IT and business-services outsourcing (such as the Philippines and India) face severe AI disruption risks 24. AI models assessing emerging market debt must dynamically detect whether a country's regime is benefiting from the commodity supercycle or suffering from service-sector displacement.
The Macroeconomic Interplay: AI, Inflation, and Interest Rates
The deployment of AI is not just a tool for detecting market regimes; the AI boom itself is creating a new macroeconomic regime.
The sheer scale of capital spending tied to the AI buildout is so massive that the microeconomics of tech companies are now driving macroeconomics 25. Hyperscaler capital expenditures are projected to reach $610 billion in 2026 26. This tsunami of spending is having tangible effects on physical infrastructure. U.S. electricity production, after a decade of stagnation, rose 3.0% year-over-year by early 2026, driven largely by data center consumption for AI training and inference 27.
In the near term, this AI buildout acts as an inflationary force. It drives up energy costs, inflates memory chip prices, and boosts demand for specialized construction labor 27. Consequently, central banks are forced to navigate a high-interest-rate environment where inflation remains sticky 2728. However, in the long term, AI deployment is expected to be a massive deflationary force. As corporations realize tangible productivity gains and efficiency improvements from AI software, the resulting cost savings could fundamentally alter the inflation regime, extending trends of declining labor power and dampening wage growth 2627.
The Limitations of AI Market Detection
Despite its mathematical sophistication and massive processing power, AI market regime detection is not a crystal ball. Quantitative analysts must navigate several persistent challenges:
- Classification vs. Prediction: It is vital to distinguish between regime classification (identifying what regime we are currently in) and regime prediction (forecasting the exact moment the next regime will occur). While AI is exceptional at classifying current market conditions and dynamically allocating capital based on those probabilities, predicting future shifts remains extraordinarily difficult due to the random nature of exogenous shocks 101829.
- The Lag Effect: Statistical confidence requires data. By the time an unsupervised model like an HMM or GMM gathers enough "emissions" to confidently confirm a transition into a "crisis" regime, the market has usually already suffered a steep initial drawdown 9.
- Non-Stationarity and False Discoveries: The stock market's continuous evolution means that a bear regime from 2008 may not look statistically identical to a bear regime in 2026. Models trained strictly on historical data run the risk of failing when presented with a novel macroeconomic environment 129. Furthermore, critics of complex AI models warn that adding thousands of parameters increases the risk of false discoveries and occasional catastrophic model breakdowns when structural boundaries change 9.
Bottom line
Market regime detection is the practice of identifying persistent shifts in economic and trading conditions, recognizing that strategies successful in a calm bull market will inevitably fail in a volatile bear market. Artificial intelligence - through Hidden Markov Models, advanced clustering, and deep learning Transformers - allows investors to mathematically infer these invisible states from noisy data like price, volatility, and credit spreads. While AI provides a massive edge in dynamically adjusting risk, rotating Smart Beta ETFs, and powering the explosive growth of robo-advisors, it remains susceptible to detection lag and the inherent unpredictability of novel macroeconomic shocks.