Is Nuclear or Solar Better for Cost, Climate, and the Grid
Solar power offers the fastest, cheapest path to new electricity generation but requires massive land areas and battery storage to ensure reliability when the sun sets. Nuclear energy provides unparalleled, uninterrupted baseload power with a tiny spatial footprint, but struggles with staggering construction delays and steep upfront capital costs. Ultimately, decarbonizing the grid requires a strategic combination of both technologies rather than a strict choice between them.
The Global Energy Context in 2025
The world has entered a new age of electricity. Driven by the electrification of transport, the decarbonization of heavy industry, and the massive power requirements of data centers and artificial intelligence, global energy consumption is rising at an unprecedented rate 12. Electricity use has increased at twice the rate of total energy demand over the past decade, forcing grid operators and policymakers to rapidly reassess how they will meet this surging demand while adhering to stringent net-zero climate commitments 1.
In this environment, the debate over grid expansion frequently centers on two low-carbon heavyweights: nuclear power and solar photovoltaics (PV).
Solar energy is currently experiencing explosive, unprecedented growth. In 2024, global solar installations reached nearly 600 gigawatts (GW) - a 33% increase over the previous year - and accounted for 81% of all new renewable energy capacity added worldwide 3. Cumulatively, global installed solar capacity surpassed 2 terawatts (TW) in 2024, doubling its capacity in just two years after taking 70 years to reach its first terawatt 3.
Simultaneously, nuclear energy is experiencing a powerful renaissance. Driven by geopolitical energy security concerns and the physical need for firm, dispatchable power, interest in nuclear energy is at its highest level since the 1970s oil crises 1. With support from more than 40 countries, global nuclear generation is on track to hit an all-time high in 2025, buoyed by reactor restarts in Japan, completed maintenance in France, and aggressive new-build programs in China and India 1. Furthermore, a new multi-country initiative has launched with the explicit aim of tripling global nuclear capacity by 2050 1.
Understanding the tradeoffs between solar and nuclear requires looking past basic generation capabilities. It requires a nuanced examination of their lifecycle emissions, financial realities, physical land footprints, and their highly distinct roles in stabilizing the power grid of the future.
Climate Impact and Greenhouse Gas Emissions
When evaluating energy sources for climate change mitigation, the most critical metric is lifecycle greenhouse gas (GHG) emissions. This accounts for the entire carbon footprint of a technology: manufacturing, raw material extraction, construction, fuel mining, operations, and eventual decommissioning.
On this front, both nuclear and solar are exceptional performers. According to data compiled by the Intergovernmental Panel on Climate Change (IPCC) in its Sixth Assessment Report, both technologies boast lifecycle GHG emissions that are significantly lower than fossil fuel-based generation 45.
While both operate at near-zero emissions during actual power generation, their carbon footprints are accrued at different stages of their lifecycle. For a nuclear plant, the bulk of emissions occurs during the highly carbon-intensive construction phase, which requires massive quantities of steel and concrete for safety containment structures 4. Additional emissions are tied to the mining and enrichment of uranium fuel 4. Once operational, the fission process itself produces zero carbon dioxide.
Similarly, the lifecycle emissions of solar PV are heavily front-loaded into the manufacturing phase. Refining silicon and manufacturing photovoltaic cells requires intense heat and significant electricity. Consequently, the carbon footprint of a solar panel is largely dependent on the energy mix of the country where it was manufactured 6. However, as the power grids powering these manufacturing hubs become cleaner, the lifecycle emissions of solar panels will continue to drop. Furthermore, newer thin-film technologies, such as cadmium telluride panels, use less energy and materials than traditional silicon, further reducing their footprint 6.
The IPCC and the International Energy Agency (IEA) scenarios clearly indicate that both technologies are required to limit global warming to 1.5°C or 2°C 5. The IEA's Net Zero Emissions by 2050 Scenario explicitly requires nuclear electricity generation to more than double, running in tandem with a massive expansion of renewables 5. The climate debate between the two is therefore largely settled: both are indispensable alternatives to coal and natural gas.
The Economics of Generation: LCOE and Construction Risk
The most significant divergence between solar and nuclear energy lies in their financial models and deployment timelines. Solar has become the cheapest form of new electricity generation in history, while new nuclear builds are notoriously expensive and financially risky.
Levelized Cost of Energy (LCOE)
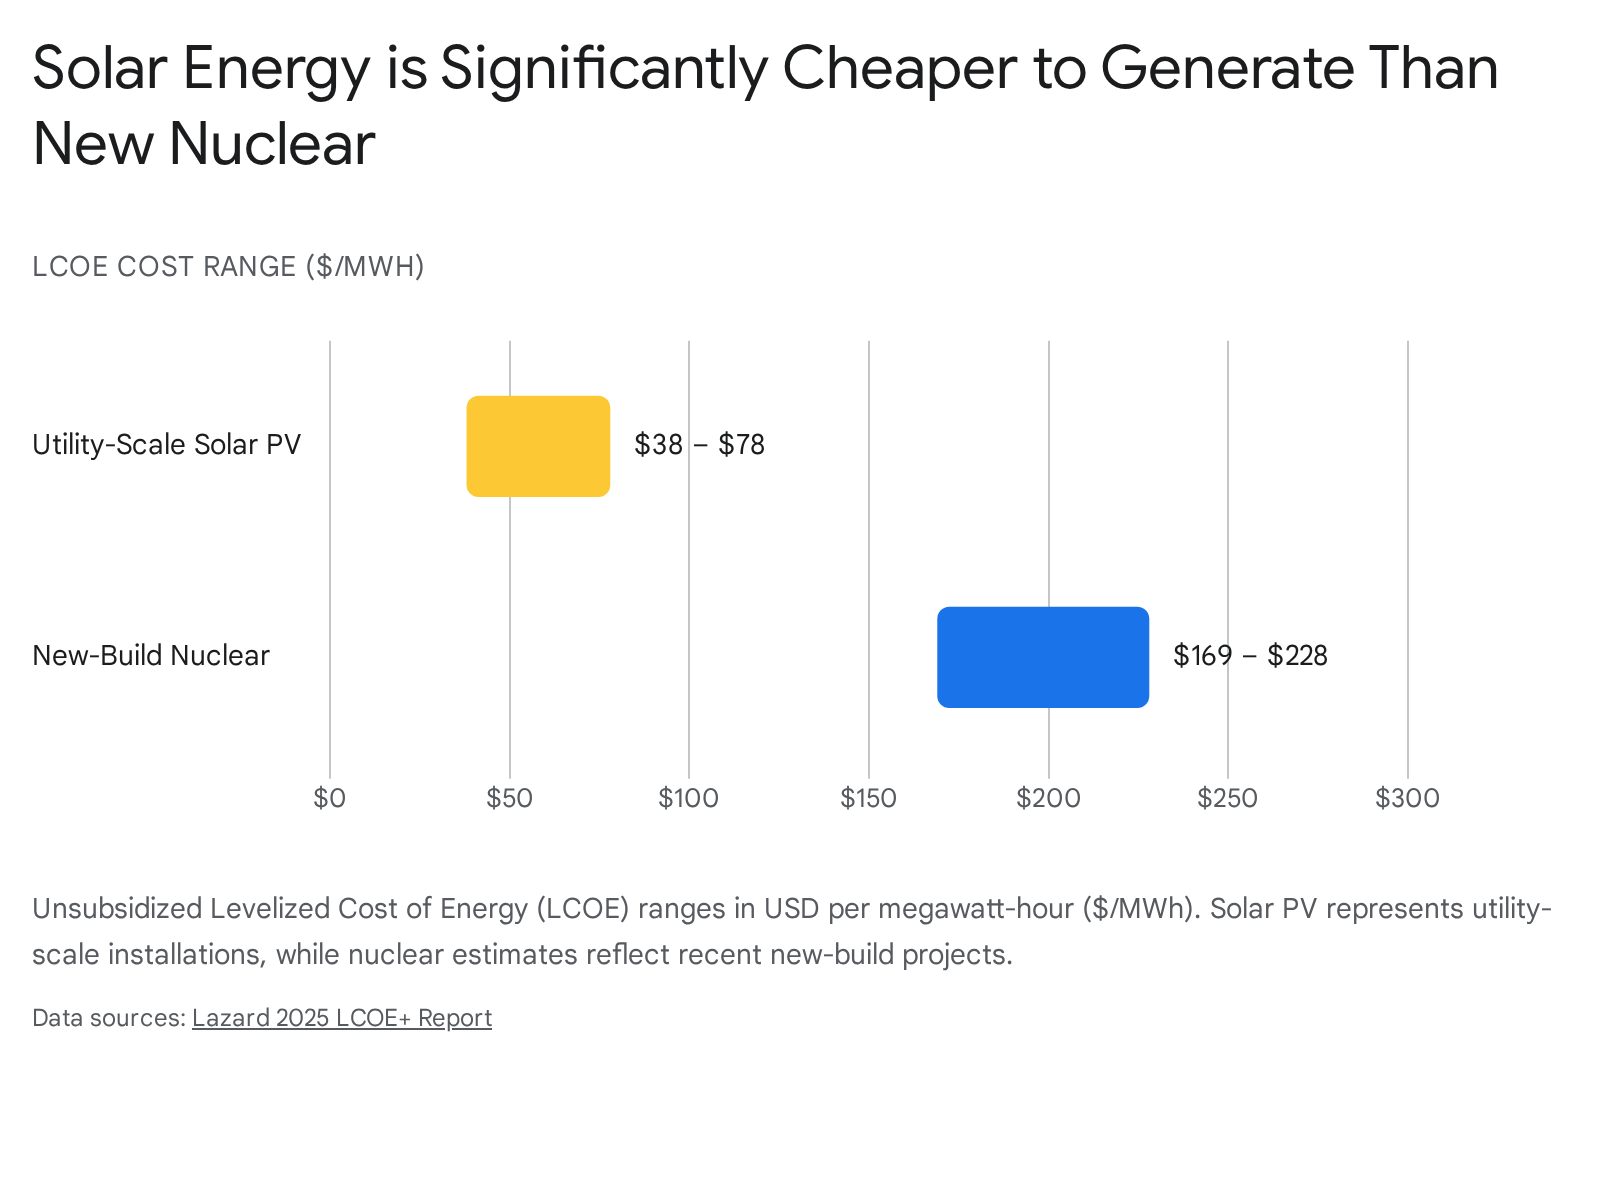
Financial analysts utilize the Levelized Cost of Energy (LCOE) to compare the economic viability of different generation methods. LCOE calculates the total cost of building, operating, and maintaining a power plant over its lifetime, divided by its total energy output. The result is expressed in dollars per megawatt-hour ($/MWh).
According to Lazard's highly cited 2025 LCOE+ report, utility-scale solar PV is extraordinarily competitive. The unsubsidized LCOE for utility-scale solar ranges between $38 and $78/MWh, tightening from previous years and remaining the most cost-competitive form of new-build generation alongside onshore wind 78. When factoring in subsidies like the U.S. Production Tax Credit (PTC), that cost can plummet to between $20 and $45/MWh 8.
By contrast, nuclear power presents a much higher LCOE for new projects. Current estimates place new-build nuclear between $169 and $228/MWh 7910.
This high figure largely reflects the massive upfront capital expenditures and the high cost of borrowing money over long construction periods. For instance, Lazard's nuclear calculation assumes a capital structure of 60% debt at an 8% interest rate and 40% equity at a 12% cost 910. Some nuclear advocates argue these assumed interest rates are overly punitive and inflate the LCOE artificially, noting that government-backed financing can secure much lower rates 9. Nevertheless, the raw capital cost of recent Western projects, such as the Vogtle plant in Georgia (estimated at $32.3 billion for 2.2 GW of capacity), inevitably drives the LCOE upward 910.
It is vital to distinguish between new-build nuclear and existing nuclear. While building a new plant is highly capital-intensive, fully depreciated existing nuclear plants generate electricity very cheaply. The marginal cost of operating an existing nuclear facility is highly competitive with both renewables and fossil fuels 10.
Construction Timelines and Financial Overruns
The theoretical cost of a power plant often differs drastically from the reality of building it. A comprehensive 2025 study by the Boston University Institute for Global Sustainability evaluated 662 energy infrastructure projects globally - representing $1.358 trillion in investment across 83 countries - to assess construction risks 111213.
The findings are stark: nuclear power plants have the highest construction cost overruns and the most extreme time delays of any energy infrastructure analyzed 1112. On average, a nuclear plant incurs a 102.5% cost overrun, meaning it ultimately costs more than double its original budget, and runs roughly $1.56 billion over expected costs 1112. Furthermore, global data indicates that reactors currently under construction have been in progress for an average of 6 years 14. Several flagship projects - such as France's Flamanville-3, India's Prototype Fast Breeder Reactor, and the UK's Hinkley Point C (which has seen costs balloon from £16 billion to £34 billion) - have faced delays extending well past a decade 14.
Conversely, solar energy exhibits the lowest construction risk in the power sector. Solar arrays are highly modular and can be deployed rapidly. Utility-scale solar farms typically take 1 to 3 years to permit and build, and they are frequently completed ahead of schedule and below projected costs 1115.
Equipment Cost Shifts in 2025
While solar hardware has enjoyed rock-bottom prices for the past 18 months due to intense Chinese manufacturing oversupply, the market is shifting. In late 2025, solar module prices fell to historic lows of $0.07 to $0.09 per watt as Chinese manufacturers engaged in fierce price competition 15.
However, looking ahead, developers face rising costs. Consolidation in the polysilicon sector and new Chinese government guidelines restricting expansion have slashed production rates, causing polysilicon prices to jump 48% in September 2025 alone 15. Compounding this, China is cancelling its 13% VAT export rebate for solar modules and storage systems in Q4 2025, which is expected to drive global solar module prices up by approximately 9% moving into 2026 15.
Summary of Economic and Deployment Tradeoffs
| Metric | Utility-Scale Solar PV | New-Build Nuclear |
|---|---|---|
| Unsubsidized LCOE (2025) | $38 - $78 / MWh | $169 - $228 / MWh |
| Typical Deployment Time | 1 to 3 years | 6 to 10+ years |
| Average Cost Overrun Risk | Negative (Often under budget) | 102.5% over budget |
| Capacity Factor | 17% - 28% (Intermittent) | ~90%+ (Continuous) |
Data compiled from Lazard 2025 LCOE+ and Boston University Institute for Global Sustainability (2025). 7811121517
Grid Reliability: Baseload Power vs. The Duck Curve
If solar is exponentially cheaper and faster to build, why do grid operators consider nuclear at all? The answer lies in grid reliability, firming costs, and the physical nature of electricity demand.
Nuclear energy is a "baseload" power source. It operates continuously, producing immense amounts of steady, reliable power regardless of weather conditions or time of day. Nuclear plants routinely achieve capacity factors of over 90%, meaning they produce near their maximum theoretical output almost all year long 1517.
Solar panels, by contrast, only produce electricity when the sun is shining. In regions with heavy solar penetration, such as California, this creates a profound grid management challenge known as the "duck curve" 18. Solar floods the grid with cheap energy during the midday hours, often generating more power than society needs and driving wholesale electricity prices to zero (or even negative). However, as the sun sets in the early evening, solar production drops off precisely when residential electricity demand peaks 18. Grid operators must rapidly ramp up other dispatchable power sources - traditionally natural gas peaker plants - to fill this massive void.
The Rise of Battery Storage
To make solar reliable around the clock, it must be paired with massive amounts of energy storage. For years, the cost of lithium-ion batteries made "firming" solar power prohibitively expensive. However, 2025 marked a tipping point for energy storage economics.
Due to lower-than-expected demand for electric vehicles (EVs) leading to an oversupply of battery cells, alongside technological advances in cell capacity and energy density, the Levelized Cost of Storage (LCOS) dropped sharply 1620. Lazard's 2025 analysis shows utility-scale standalone battery storage (100 MW with 4-hour duration) falling to a range of $115 to $254/MWh, dropping back to 2020 levels and largely offsetting pandemic-era price spikes 20.
This cost reduction is sparking an installation boom. In China, the energy storage sector is scaling at an unprecedented rate. Even after China scrapped a national mandate that required new solar and wind projects to include co-located storage, developers still installed a staggering 65 GWh of grid-scale battery capacity in December 2025 alone 1718. This single month of Chinese deployment exceeded the total capacity installed in the U.S. for the entirety of 2025 18. China has now set an aggressive national target to reach 180 GW of new energy storage capacity by 2027 to stabilize its rapidly expanding renewable grid 1719.
Nuclear Flexibility and Grid Integration
Interestingly, the massive influx of solar power is forcing nuclear energy to adapt its operational profile. France, which derives roughly 65% of its electricity from a fleet of 56 nuclear reactors, has traditionally treated nuclear as a steady, unchanging source of baseload power 20.
However, as cheap solar energy from neighboring countries and domestic installations floods the European grid at midday, French nuclear reactors are increasingly being used to "load follow" or "flex." In 2025, daily swings in French nuclear output averaged 6 GW, with some days seeing massive 18 GW swings 2021. Reactors are dialed down at noon to make room for solar, and ramped back up in the evening 20.
While this proves that modern nuclear plants can be flexible - EDF notes its fleet can dial up or down by 80% in 30 minutes twice a day - it comes with consequences 21. Rapidly adjusting the output of a nuclear reactor causes thermal stress and corrosion, raising concerns about wear-and-tear on aging infrastructure 2021. Furthermore, running a highly capital-intensive nuclear plant at lower capacity to accommodate midday solar ruins its economic model, which relies on running 24/7 to pay off high construction debts 18.
To combat this, the French market is innovating with decentralized storage. Companies like Octopus Energy have launched tariffs that combine home solar, batteries, and intelligent dispatch to relieve the grid. Octopus estimates that equipping 600,000 French homes with smart batteries could provide the grid flexibility equivalent to six nuclear reactors, showcasing how distributed storage can manage the duck curve without stressing heavy infrastructure 22.
Land Use and Energy Density
When evaluating spatial efficiency, nuclear power is unparalleled. Because uranium is incredibly energy-dense, nuclear plants require very little physical space to generate massive amounts of electricity.
A standard 1-gigawatt (GW) nuclear power plant requires roughly 1.3 square miles (3.4 km2) of land 17. To generate the exact same amount of total electricity over a year, factoring in capacity factors, a solar farm requires between 45 and 75 square miles (116 - 200 km2) 17.
When analyzing the total lifecycle land footprint - including the land required to mine uranium versus the land required to mine the silica, silver, and copper for solar panels - nuclear remains the most land-efficient source. Per unit of electricity, nuclear requires 27 times less land than coal, 18 times less than hydropower, and roughly 34 times less than ground-mounted solar PV 623.
| Energy Source | Lifecycle Land Use (m2 per MWh) | Relative Space Required vs Nuclear |
|---|---|---|
| Nuclear | Very Low (~0.1 - 0.3) | 1x (Baseline) |
| Coal | High | ~27x - 50x larger |
| Solar PV (Ground) | Moderate to High | ~18x - 34x larger |
| Wind (Direct) | Low (Highly spaced) | ~170x larger indirect footprint |
Approximations based on Our World in Data, WEF, and NEI lifecycle assessments. 6172324
Solar advocates correctly point out that panels do not always require new or exclusive land. Rooftop solar utilizes existing infrastructure, and the emerging field of agrivoltaics allows for farming beneath elevated panels, counting as "co-used land" 6. Furthermore, solar farms can be situated on degraded land, capped landfills, or remote deserts 17. Wind farms, while requiring massive indirect spacing, allow for agriculture directly beneath the turbines 624.
Nevertheless, as the world moves toward terawatt-scale energy consumption, the sprawling footprint of utility-scale renewables is increasingly leading to local opposition and aesthetic concerns 2324. For densely populated countries, or regions lacking vast empty spaces, nuclear's highly compact footprint is a decisive advantage.
Energy Return on Investment (EROI)
A more technical, thermodynamic debate between the two sources revolves around Energy Return on Investment (EROI) - the ratio of usable energy delivered by a technology over its lifetime compared to the energy used to manufacture, build, and fuel it. An EROI of 7 is generally considered the breakeven point required to sustain a complex, developed socioeconomic system 25.
Historically, nuclear energy has shown exceptional EROI. Because a single fuel pellet of uranium holds immense power, life-cycle analyses regularly show nuclear plants boasting an EROI between 50 and 105, meaning they return up to 100 times the energy it took to build and run them, including the full fuel cycle and enrichment 2530.
The EROI of solar PV has been a point of fierce academic contention. Older, highly criticized studies (such as Ferroni and Hopkirk, 2016) controversially claimed solar PV acted as a net energy sink 26. However, modern consensus and revised models show that the EROI of contemporary silicon solar installations is roughly 9 to 15, with an energy payback time of just 2.5 to 3 years 302627.
The debate often hinges on system boundaries. Some researchers point out that if you mandate heavy battery storage or backup gas plants to smooth out solar's intermittency, the "societal EROI" of the overall grid drops significantly 2527. Conversely, proponents of solar argue that calculating the EROI of PV is much simpler and more accurate than fossil or nuclear fuels because the boundaries are clearly defined at the manufacturing plant 30.
Increasingly, the energy industry views EROI as a secondary, somewhat academic metric. If the financial cost of solar electricity drops to 1 cent per kilowatt-hour over a 25-year fixed contract, the thermodynamic EROI matters far less to utilities and consumers than the actual economic savings 30.
The Waste Challenge and Decommissioning
Perhaps the most common public concern regarding nuclear energy is the management of spent nuclear fuel, commonly referred to as high-level radioactive waste.
Putting Nuclear Waste in Perspective
While nuclear waste is highly toxic and requires strict, long-term isolation, the physical volume generated is astonishingly small compared to the energy produced. All of the high-level nuclear waste produced by the entire U.S. commercial nuclear industry over the last 60 years - approximately 90,000 metric tons - could fit on a single American football field stacked to a depth of less than 10 yards (or roughly 135 meters high if left inside their bulky concrete storage casks) 28293036. High-level waste constitutes less than 0.25% of total radioactive waste reported globally 31.
Spent fuel assemblies are solid metal and ceramic objects - not the glowing green liquids popularized by pop culture 30. After being removed from a reactor, they are cooled in water pools for several years before being transferred to rugged, steel-reinforced concrete dry casks. These casks are engineered to withstand earthquakes, floods, fires, and direct impacts, and are currently stored safely on-site at power plants 2830.
Long-term Storage and Recycling
Currently, most nuclear waste sits safely in dry casks because many countries have historically struggled with the political and social challenge of establishing deep geological repositories 2832. However, this is changing. Finland is currently constructing the world's first permanent deep geological repository, and Sweden has approved a similar design 2832.
Furthermore, spent nuclear fuel still retains over 90% of its potential energy 30. While the U.S. currently treats it as waste and stores it, countries like France and Russia actively recycle spent fuel to extract more electricity, drastically reducing the final volume of highly radioactive material 2930.
Solar energy, conversely, produces no waste during operation. However, millions of tons of solar panels will eventually reach the end of their 25-to-30-year lifespans. While they contain small amounts of heavy metals, recycling programs for PV materials are currently scaling up to recover valuable silver, copper, and silicon to prevent dead panels from overwhelming local landfills 15.
Economic Impact on Local Communities
The socio-economic impacts of power generation differ wildly between solar and nuclear, heavily influencing local politics, zoning, and municipal budgets.
Jobs and Tax Revenue
Nuclear plants are massive economic engines for their host communities. The operation of a typical plant contributes upward of $400 million annually to the local and regional economy 3334. A plant requires between 400 and 700 permanent, highly skilled workers to operate, paying salaries that average 36% higher than the local median 35. According to a 2024 analysis by Oxford Economics, the average U.S. county hosting a nuclear plant sees a $770 million GDP contribution and supports 1,758 direct and indirect jobs 36. Additionally, the average plant pays $16 million annually in state and local taxes, directly funding local schools, emergency services, and infrastructure 35.
Because nuclear power is so deeply integrated into the local economy, the permanent closure of a plant is often devastating. Communities face a "swift, severe, and widespread" loss of tax revenue and high-paying jobs, leading to immediate cutbacks in local public services and eroding local housing values 3334.
Utility-scale solar projects also offer community benefits, but the economic profile is vastly different. Solar farms create a massive spike in local employment during the 1-to-3-year construction phase, requiring skilled laborers, engineers, and supply chain logistics 43. Once operational, however, they require very few permanent maintenance workers 37. A report by the Idaho National Laboratory (INL) highlights this disparity: per megawatt-year of capacity, nuclear sustains roughly 4.8 to 5.2 long-term jobs, whereas solar and wind support roughly 3.6, heavily skewed toward the construction phase 37.
However, solar farms do provide highly valuable, steady lease payments to rural landowners and farmers. They also generate local property tax revenue and permitting fees without burdening municipal services (solar farms do not send children to local schools or require heavy emergency services) 43. Ultimately, solar distributes modest, low-maintenance economic benefits over a wide geographic area, whereas nuclear concentrates intense economic wealth and employment in a single municipality.
Real-World Synergy: National Case Studies
Rather than treating nuclear and solar as mutually exclusive, forward-thinking nations are leveraging both to achieve decarbonization and energy security.
The United Arab Emirates (UAE)
Historically reliant on natural gas, the UAE has aggressively pursued a clean energy transition. To achieve this, they deployed the massive Barakah Nuclear Energy Plant alongside sprawling solar installations like the 2 GW Al Dhafra Solar PV project 3839.
Operating at full capacity, the Barakah plant's four South Korean-designed APR1400 reactors provide 5.6 GW of clean, unwavering baseload power 3947. This single facility meets roughly 25% of the entire nation's electricity demand and prevents 22.4 million tons of carbon emissions annually 3940. Meanwhile, their vast solar farms capture the intense desert sun to provide cheap, abundant power during peak daytime air-conditioning hours. By using nuclear as the unshakeable foundation of the grid, the UAE can aggressively scale intermittent solar without risking blackouts or relying entirely on unproven scales of battery storage 3847.
India's Aggressive Expansion
India, facing massive population growth and a heavy reliance on coal (which provides 74% of its electricity), is also pursuing a dual strategy 41. In 2025, India achieved its target of sourcing 50% of its installed capacity from non-fossil sources five years ahead of schedule, driven by a $20 billion surge in solar investment 42.
Simultaneously, the Indian government recognizes that solar cannot entirely replace coal for industrial baseload. Consequently, India has launched the "Nuclear Energy Mission for Viksit Bharat," setting an ambitious target to scale its nuclear capacity from roughly 8 GW today to 100 GW by its centenary of independence in 2047 4344. To facilitate this, the government passed the Shanti Act in 2025, amending historic laws to allow private companies and foreign investment into its nuclear sector 434445. This includes $62 billion in planned investments by state-run NTPC to build 30 GW of new nuclear, and heavy investment in indigenous Small Modular Reactors (SMRs) to complement their booming solar sector 4344.
Bottom line
The choice between nuclear and solar energy is not a zero-sum game; they solve fundamentally different problems within the power grid. Solar PV is the fastest, most cost-effective way to add clean generation capacity today, but its reliance on vast tracts of land and heavy battery storage limits its ability to single-handedly run an industrialized economy. Nuclear energy provides the ultimate reliable, land-efficient baseload power and generates immense local economic wealth, yet it remains hampered by severe construction delays and exorbitant upfront costs. Achieving a stable, decarbonized future will inevitably require leveraging the rapid deployment economics of solar alongside the unrivaled, round-the-clock reliability of nuclear power.