
Impact of Earnings and News Catalysts on Swing Trade Outcomes
Market Mechanics of Scheduled Earnings Announcements
Scheduled corporate earnings announcements represent one of the most significant recurring liquidity and volatility catalysts in global equities. Because these disclosures force the market to reconcile forward-looking expectations with realized fundamental data, they serve as a primary inflection point for swing-trade positioning. The interplay between earnings releases and asset pricing involves complex mechanisms, primarily driven by volatility expansions, subsequent contractions, and prolonged directional drifts.
Pre-Announcement Implied Volatility Expansion
In the weeks and days preceding a scheduled earnings announcement, uncertainty regarding the firm's financial performance naturally increases. This uncertainty translates into heightened demand for options contracts, as institutional hedgers seek downside protection and speculators seek leveraged directional exposure 12. Consequently, implied volatility (IV) - the options market's forward-looking expectation of price variance - systematically inflates. It is common for the front-month implied volatility of a large-capitalization equity to reach its 52-week high the day immediately prior to an earnings release, reflecting the market pricing in maximum binary uncertainty 2.
The magnitude of this volatility expansion reflects the market's collective estimate of the potential post-earnings price jump. Quantitative traders evaluate the "implied move" by examining the pricing of the front-week at-the-money (ATM) straddle (the combined cost of an ATM call and an ATM put) 12. If a stock trades at $100 and the ATM straddle is priced at $5, the options market implies a 5% move in either direction. Swing traders seeking to capitalize on this phase must evaluate whether the implied move is underpriced relative to the firm's historical post-earnings moves, actively monitoring the build-up of the volatility risk premium in high-beta and growth equities 14.
Post-Announcement Volatility Contraction
Once the earnings data is published, the binary uncertainty is resolved. Regardless of whether the reported metrics are profoundly positive, negative, or neutral, the primary driver of the volatility premium evaporates. This phenomenon is known as "IV crush." During an IV crush, implied volatility can plummet by 30% to 60% in the opening minutes of the subsequent trading session 24.
The mechanics of an IV crush pose a significant structural headwind for directional long-option swing traders. Because option premiums are highly sensitive to volatility changes (measured by the option Greek Vega), a rapid collapse in IV can destroy the value of a long call or put contract even if the underlying equity moves in the trader's anticipated direction 23.
Empirical studies tracking the relationship between implied and realized volatility across S&P 500 equities demonstrate that pre-earnings implied volatility overstates the actual realized price move approximately 85% of the time 2. The average gap between implied and realized volatility runs between three and five percentage points, expanding dramatically during broader market stress 2. Consequently, quantitative swing traders often view earnings not as a directional opportunity, but as a volatility arbitrage opportunity. By structuring short-premium positions, such as short strangles or iron condors entered prior to the announcement, traders directly benefit from the IV collapse, collecting the inflated premium provided the stock does not move beyond the expected range 223.
The Post-Earnings Announcement Drift Phenomenon
While the immediate option market reaction is defined by volatility contraction, the underlying equity often exhibits a prolonged directional trend known as Post-Earnings Announcement Drift (PEAD). First documented by Ball and Brown in 1968, PEAD remains one of the most robust and academically scrutinized anomalies challenging the efficient market hypothesis 6. The phenomenon dictates that a stock's cumulative abnormal returns tend to drift for 60 to 90 days following a positive or negative earnings surprise 64.
The fundamental rationale for PEAD is anchored in investor underreaction and institutional capital constraints. Following a significant earnings surprise, markets do not instantaneously reprice the asset to its true terminal value. Instead, institutional investors, constrained by position limits, liquidity considerations, and risk mandates, accumulate or distribute shares methodically over weeks or months 48.
Historical academic backtesting of PEAD strategies - typically constructed by sorting firms into deciles based on their Standardized Unexpected Earnings (SUE) - shows that a portfolio going long on the highest decile ("Good News") and short on the lowest decile ("Bad News") yields quarterly abnormal returns between 2.6% and 9.4% 4. Adjusting for risk reference portfolios based on size and book-to-market ratios, the hedge trading strategy yields approximately 5.1% over the three months following the announcement, translating to annualized returns between 10% and 25% 5.
Alternative metrics beyond SUE have been shown to enhance the predictive power of PEAD. Strategies built on Expected Growth Risk (EAR) - measured as the covariance between stock returns and expected future real GDP growth rates - produce average abnormal returns of 7.55% per year, outperforming traditional SUE strategies by 1.3% 6. Furthermore, EAR strategy returns do not show a reversal after three quarters. Combining both SUE and EAR information into a dual-factor strategy generates abnormal annual returns of approximately 12.5% 6.
Additionally, PEAD strategies highlight the critical nature of the "Whisper Number" - an unofficial, crowd-sourced earnings estimate that is often more accurate than official Wall Street consensus estimates.
| Scenario Outcome | Average Abnormal Return | Strategy Win Rate |
|---|---|---|
| Beat Whisper + Consensus | +1.8% | 60% |
| Beat Consensus Only (Miss Whisper) | -0.3% | 45% |
| Miss Both | -2.1% | 35% |
Table 1: Whisper number integration into post-earnings swing trade expectancy 4.
Aggregation Bias and Disaggregated Earnings Drift
Despite the aggregated portfolio success of PEAD strategies, recent econometric analysis reveals significant nuances regarding the persistence of the drift at the individual firm level. Research highlights that portfolio-level PEAD analysis often suffers from aggregation bias, obscuring high heterogeneity among individual equities 5.
When disaggregating the data, the traditional monotonic relationship between the magnitude of the earnings surprise and the subsequent price drift collapses. Analysis of 118 quarters of earnings data revealed that 16.1% of aggregated "Good News" quarters actually resulted in negative returns, while 28.0% of "Bad News" quarters experienced positive upward drifts 5.
At the strict firm level, equities in the top decile of earnings surprises only experienced positive drift 51.75% of the time, functioning essentially as a coin toss for the individual swing trader relying solely on fundamental surprise data 5. Conversely, 41.68% of "Bad News" firms actually experienced positive returns over the subsequent quarter 5. Furthermore, the correlation between Standardized Unexpected Earnings (SUE) and subsequent returns, which appears strong at 0.6927 in decile-level aggregation, drops to a statistically insignificant 0.0073 at the individual firm level 5. This statistical reality suggests that while PEAD is a verifiable macroeconomic portfolio factor, relying blindly on earnings surprises for single-asset swing trading involves substantial idiosyncratic risk.
Natural Language Processing in Earnings Prediction
To optimize the identification of genuine PEAD candidates and bypass the limitations of raw SUE data, institutional quantitative models are increasingly relying on Large Language Models (LLMs) to parse the semantic sentiment of earnings call transcripts.
Recent research evaluating LLM architectures for PEAD prediction demonstrates that models capable of contextualizing forward-looking management guidance generate statistically significant abnormal returns. Evaluating the 60-Day Buy and Hold Abnormal Return (BHAR) for portfolios consisting of the top 10% most likely drift candidates reveals distinct performance tiers among LLM types 6.
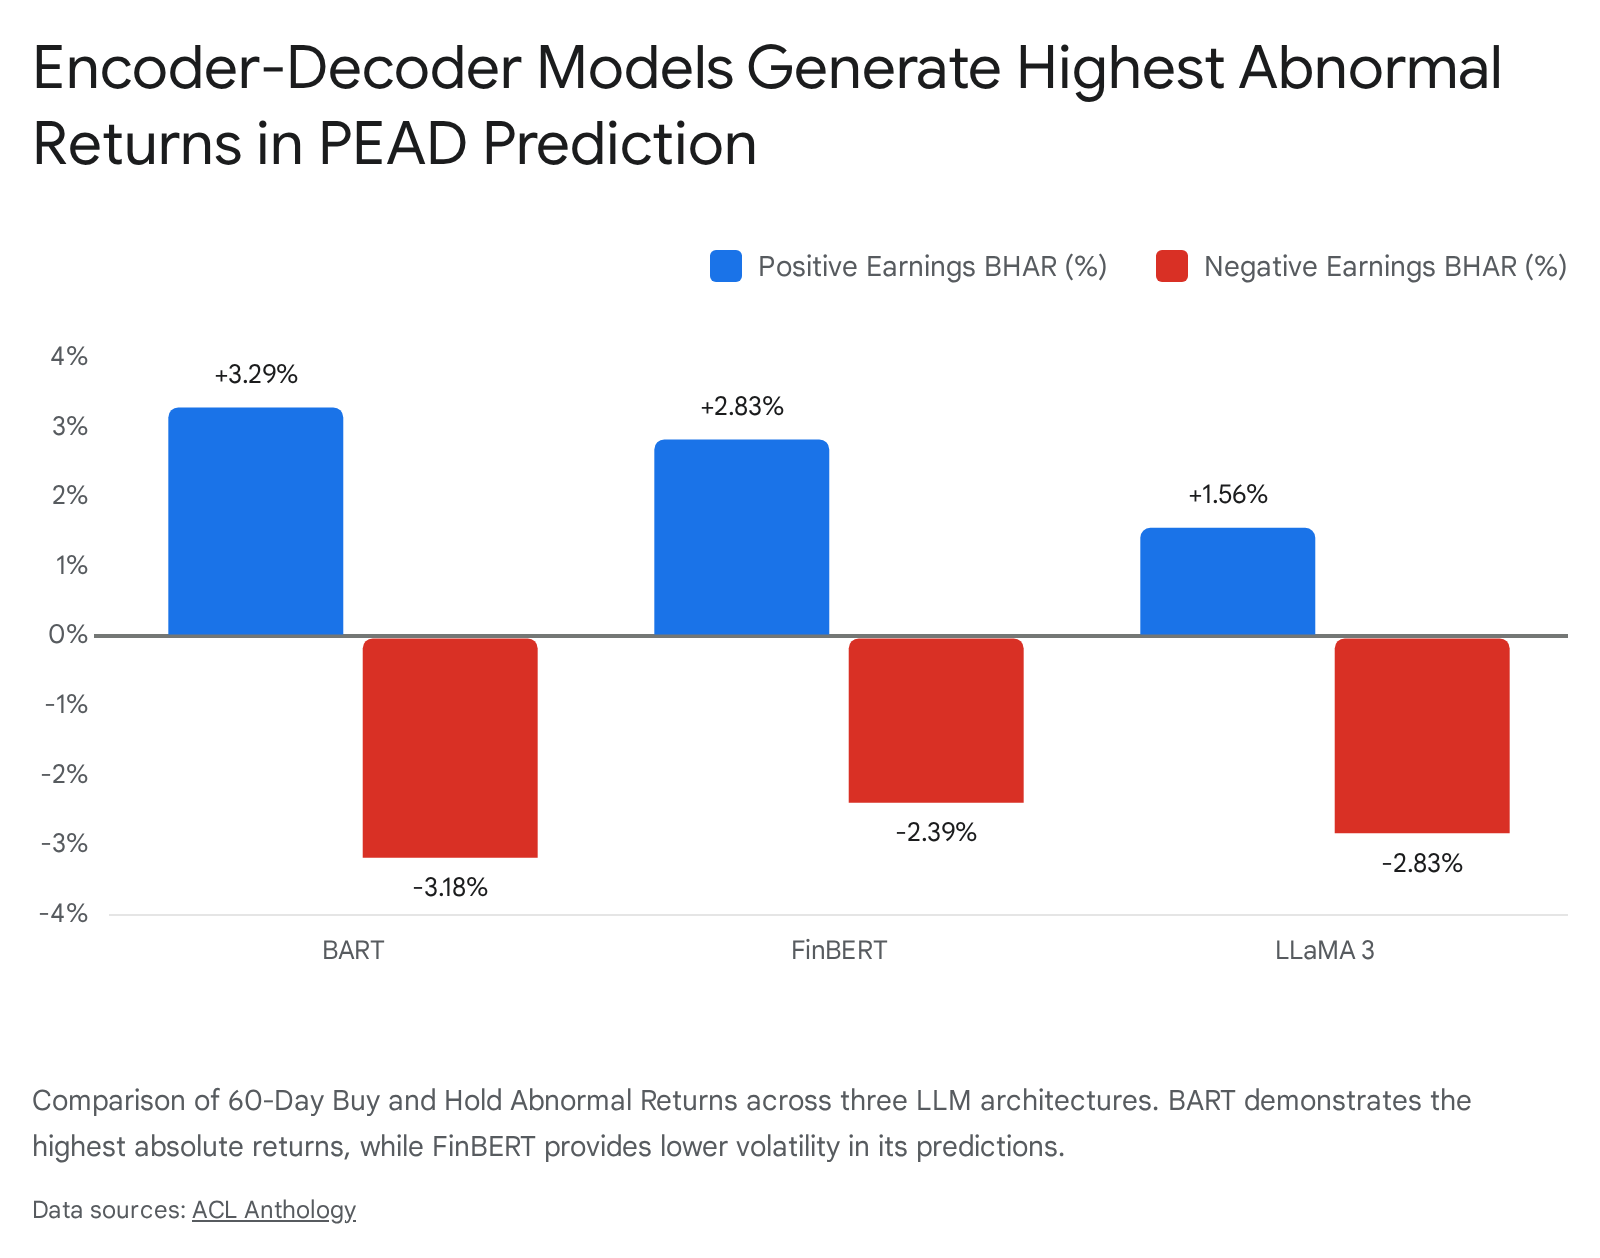
| Model Architecture | Positive Earnings Group BHAR | Negative Earnings Group BHAR | Risk-Adjusted Profile (CV) |
|---|---|---|---|
| BART (Encoder-Decoder) | 3.29% ± 2.25% | -3.18% ± 3.42% | Moderate (0.68) |
| FinBERT (Encoder-only) | 2.83% ± 1.25% | -2.39% ± 1.97% | Strong (0.44) |
| LLaMA 3 | 1.56% ± 1.33% | -2.83% ± 1.10% | Poor |
Table 2: Performance of natural language processing models in identifying PEAD candidates 6.
The integration of early market signals - specifically the cumulative returns from days 1 to 3 post-announcement - further enhances these NLP models. Incorporating these early technical signals increased the BART model's positive group BHAR from 3.29% to 3.91%, suggesting that combining fundamental NLP processing with early institutional order flow momentum creates the highest expectancy in post-earnings swing trades 6.
In highly regulated markets where analyst optimism can bias market consensus, evaluating the Fraction of Misses on the Same Side (FOM) has also been proven superior to traditional forecast error metrics for evaluating earnings surprises and driving PEAD profitability 7.
Macroeconomic Data Releases and Volatility Dynamics
While corporate earnings dictate idiosyncratic single-stock movements, scheduled macroeconomic data releases dictate systemic market volatility and broad index pricing. Key reports such as the Consumer Price Index (CPI), Producer Price Index (PPI), Gross Domestic Product (GDP), Non-Farm Payrolls (NFP), and Federal Open Market Committee (FOMC) interest rate decisions act as macro-level catalysts that force capital reallocation across all asset classes 89.
Volatility Suppression Effects
A persistent empirical finding in market microstructure research is the "volatility suppression" effect of scheduled macroeconomic announcements. Similar to corporate earnings, equity index implied volatility - commonly tracked via the VIX index for the S&P 500 - systematically increases in the days prior to a scheduled macroeconomic release as market participants hedge against tail risk 8910.
The moment the data is released, the uncertainty premium is resolved, leading to a statistically significant drop in implied volatility 810. This effect applies broadly across asset classes; the implied volatility of T-bond and Eurodollar options regularly decreases following NFP and CPI announcements at a significance level of 0.01 10. Studies tracking market reactions to FOMC meetings also demonstrate that the scheduled nature of these events exerts a profound volatility-suppressing effect, with the VIX dropping sharply regardless of the ultimate policy decision, as the act of the announcement itself resolves overarching uncertainty 9.
Realized Volatility Jumps and Asset Repricing
Beneath this aggregate volatility contraction in the options market, macroeconomic announcements serve as the primary drivers of localized volatility "jumps" - sudden, discontinuous changes in asset prices and realized volatility. Research indicates a strong coincidence of realized volatility jumps precisely aligned with scheduled announcements, particularly for interest-rate-sensitive assets 11.
For instance, the arrival rate of implied volatility jumps for 30-year Treasury bonds increases from 16% to 28% upon the release of the US Employment Situation Report 11. By demonstrating that scheduled releases influence both the arrival rate and the magnitude of these jumps, macroeconomic news is confirmed as a critical driver of not just price discovery, but structural volatility shifts in the broader market 11. Furthermore, information contained in option trades prior to FOMC announcements, measured as the implied volatility spread, reliably predicts bank stock returns to a greater degree than volatility spreads observed on non-meeting days, indicating that the options market serves as a primary source of informed trading ahead of macro catalysts 9.
Asymmetric Responses to Macroeconomic News Surprises
The market's reaction to macroeconomic data is highly asymmetric, depending heavily on the discrepancy between the released figure and the consensus estimate (the "surprise component"), as well as the prevailing economic regime 81213. Generally, macroeconomic news that is "better than expected" correlates with an accelerated decrease in option implied volatility, whereas "worse than expected" news can arrest the volatility crush and cause subsequent spikes in uncertainty 8.
The US Non-Farm Payroll (NFP) report exemplifies this dynamic. In typical economic expansion regimes, the NFP release acts as a powerful volatility-suppressing event; historically, the VIX and the MOVE (Treasury bond volatility) indices close lower 70% and 77% of the time, respectively, on NFP days 12. The volatility decline following an NFP print is frequently the most severe of all major economic releases 12.
However, the market reaction completely inverts when transitioning into an economic recession. During the onset of the last three systemic recessions, the NFP report served as a primary catalyst for volatility expansion; poor NFP prints forced rapid downward revisions of growth expectations, driving the VIX significantly higher as investors priced in immediate downside tail risks 12. This indicates that swing traders cannot rely on static reactions to macroeconomic data; outcomes must be weighted against the broader economic cycle and prevailing market distress 1214.
Unscheduled Catalysts and Exogenous Market Shocks
Unlike pre-scheduled earnings or economic data, unscheduled catalysts introduce sudden, unpriced exogenous shocks into the market. Because the market has not inflated implied volatility in anticipation of these events, the resulting price action and volatility expansion are often violent and heavily directional.
Activist Short Seller Reports
One of the most severe unscheduled catalysts for single-stock swing trading is the publication of an activist short seller report. Activist short sellers - entities that establish a short position in a targeted equity and subsequently publish research alleging fraud, accounting irregularities, or severe overvaluation - create immediate market imbalances 15.
Research covering activist short campaigns between 2010 and 2017 indicates that these investors primarily target liquid, highly volatile stocks with large market capitalizations, elevated valuation multiples, and high information asymmetry 15. The market reaction to these unscheduled reports is swift and punitive. Studies suggest that approximately 48% of activist short campaigns generate significant negative abnormal returns during the first few trading days following the announcement 15.
The magnitude of the downward gap is highly correlated with the market reputation of the short seller and whether the report introduces verifiably new evidence rather than merely interpreting existing public data 1521. However, the activist landscape is also populated by manipulative actors. Back-of-the-envelope quantitative estimations suggest that between 2.3% and 5.4% of activist short-selling campaigns exhibit signs of "short and distort" market manipulation, where false or highly misleading information is propagated strictly to trigger a temporary price collapse 15.
Target Firm Responses and Long-Term Outcomes
The target firm's response to an activist catalyst is critical for the duration and severity of the downward swing. Curiously, empirical evidence shows that firms formally respond to activist reports only about 31% of the time 21.
This response rate spikes substantially when the stock experiences severe negative abnormal returns upon the report's release or when the short seller presents genuinely novel allegations. Not responding is historically associated with a less negative immediate stock price reaction and fewer long-term adverse outcomes 21. However, if a firm chooses to launch an internal investigation in response to the allegations, the long-term outlook deteriorates significantly. Target firms initiating internal investigations exhibit substantially higher subsequent rates of SEC enforcement actions, stock exchange delisting, and a reduced likelihood of being acquired 21. Swing traders utilizing a mean-reversion strategy to buy the dip on activist short reports must heavily discount firms that acknowledge the need for internal audits.
Temporal Disclosure Effects and Investor Attention
The specific timing of a corporate disclosure heavily influences the severity of the market's reaction, a factor well-documented in behavioral finance. Corporate management teams frequently attempt to bury negative catalysts by releasing information after regular trading hours or directly prior to weekends.
Research confirms the existence of limited investor attention regarding Friday disclosures. When comparing the impact of 8-K filings, credit rating downgrades, and activist short-seller reports, market responses are notably muted when the disclosure occurs on a Friday 16. Abnormal trading volume, absolute abnormal returns, and EDGAR database download activity are all significantly lower for Friday announcements, indicating that information absorption is delayed 16.
Furthermore, research into the exact time-of-day of earnings announcements reveals a related dynamic. Pre-open (PO) announcements provide investors with less time to process complex information before the opening bell compared to post-close (PC) announcements 17. As a result, PO announcements are associated with a slower incorporation of news into the asset price. Firms announcing in the PO experience approximately 28% greater cumulative abnormal return volatility over days T+2 to T+5 compared to firms announcing in the PC 17. This persistent volatility allows astute swing traders to exploit prolonged price discovery inefficiencies in PO announcers, though option pricing models generally fail to reflect this predictable pattern of differential volatility 17.
Structural Pricing Gaps and Inter-Day Anomalies
Both scheduled and unscheduled catalysts frequently result in price gaps - instances where an asset opens significantly higher or lower than its previous closing price, leaving a void on the price chart. Gaps are physical representations of overnight supply-demand imbalances forcing sudden repricing 1819.
Inter-Day Gaps and Technical Classification
In quantitative technical analysis, inter-day gaps are classified into four primary categories, each carrying specific implications for swing trade duration and direction 1819:
| Gap Classification | Market Context | Volume Profile | Swing Trade Implication |
|---|---|---|---|
| Common Gap | Range-bound markets, random fluctuations. | Low / Average | Tends to "fill" quickly; suitable for short-term mean reversion. |
| Breakaway Gap | Breaking key support/resistance levels. | High / Expanding | Signals the start of a new trend; rarely fills immediately. Strong momentum entry. |
| Runaway (Measuring) Gap | Occurs in the middle of a strong, established trend. | High | Confirms trend continuation; utilized to measure the remaining price target. |
| Exhaustion Gap | Occurs at the late stages of a parabolic trend. | Decreasing | Signals trend termination and impending reversal. |
Table 3: Technical classification of market price gaps and their trading implications 1819.
Weekend Gaps Across Major Indices
Weekend gaps, created between Friday's close and Monday's open, present unique structural anomalies. An analysis of high-frequency (5-minute) data spanning 2013 to 2023 across the DJIA, NASDAQ, and DAX challenges the widely held trading maxim that "all gaps must fill" 20.
The study, which examined 205 weekend gaps in the DJIA, 270 in the NASDAQ, and 406 in the DAX, found no strong, universal bias toward closing gaps at shorter distances 20. However, at medium-to-large distances, significant directional patterns emerge, particularly in the DAX, indicating that large gaps often result in trend continuation rather than mean-reverting retracements 20. Furthermore, larger gap sizes correlate strongly with elevated subsequent volatility in both the DJIA and the NASDAQ, underscoring that gap magnitude serves as a leading indicator of near-term price fluctuations and confirming that gap-based anomalies vary significantly by market structure and geography 20.
Institutional Order Flow and Retail Trading Discrepancies
The structural outcomes of both scheduled and unscheduled catalysts are ultimately dictated by market microstructure - specifically, the interaction between institutional order flow and retail trading volume.
Accumulation and Distribution Dynamics
Institutional investors - such as pension funds, hedge funds, and proprietary trading desks - operate with capital sizes that cannot be deployed instantaneously without triggering massive price slippage. Therefore, institutions must execute block trades and iceberg orders to obscure their true size, absorbing liquidity slowly during periods of consolidation 821. This deliberate process is known as accumulation (when buying) or distribution (when selling) 28.
For swing traders, distinguishing true institutional accumulation from random sideways consolidation is critical for timing post-catalyst breakouts. Traditional lagging indicators like the Relative Strength Index (RSI) or Moving Average Convergence Divergence (MACD) are derivatives of price and often fail to capture real-time order flow imbalances 29. Instead, institutional trading models rely on volume-weighted metrics and option-implied flow variables, which have been shown to generate portfolios with 4.8% annualized alpha over traditional technical strategies 29.
The Accumulation/Distribution (A/D) line is a primary technical measure used to relate price action to volume. The core mechanic relies on the Close Location Value (CLV), which measures where the asset closes relative to its high-low range for the session 2223.
CLV Formula: $$CLV = \frac{(Close - Low) - (High - Close)}{High - Low}$$
The CLV ranges from -1 (closing at the absolute low) to +1 (closing at the absolute high). This multiplier is applied to the session's volume to calculate the cumulative A/D index 22. When an asset's price trends downward or trades flat, but the A/D line steadily rises, it suggests aggressive institutional buying absorbing the available supply - a strong precursor to a bullish breakout 82822. Conversely, if price pushes upward but volume dries up on the advances, it implies institutional distribution into retail strength, signaling an impending reversal 2823.
Zero-Day Options and Gamma Exposure
A dramatic structural shift in order flow dynamics over recent years is the exponential rise of Zero-Days to Expiration (0DTE) options. Initially limited to quarterly or monthly expirations, the introduction of daily expirations in 2022 fundamentally altered hedging mechanics 32. By late 2024, 0DTE options on the S&P 500 Index constituted over 51% of total SPX options volume, averaging over 1.5 million contracts daily 2425.
Retail and institutional adoption of 0DTE options stems from their nearly absent time value (Theta) and extremely high leverage 25. However, the proliferation of these instruments sparked widespread debate regarding systemic market risk. Some analysts posited that because 0DTE options exhibit massive Gamma (sensitivity of Delta to underlying price changes), Options Market Makers (OMMs) hedging these positions could trigger destabilizing "gamma squeezes" - forcing violent intra-day price swings 252627.
Recent quantitative studies largely refute the systemic destabilization theory. While short-dated options do possess large gammas, empirical evidence shows that 0DTE trading volumes have minimal impact on overnight or lagged intraday volatility 2628. The primary reason is that 0DTE order flow on major indices like the SPX is highly balanced between puts and calls, keeping the put/call ratio near parity. This balanced demand effectively neutralizes the net gamma exposure of market makers, preventing the directional cascading effects seen in single-stock retail frenzies 28. The maximum estimated impact of OMM gamma on annualized 30-minute volatility is an increase of roughly 6.4 percentage points, which remains well within normal daily variance parameters 26.
Retail Trader Profitability and Order Flow Segmentation
Retail participation in options markets peaked near 48% during the pandemic and has stabilized around 45% 29. However, quantitative evaluations of retail option trader profitability, particularly around earnings catalysts, indicate severe structural disadvantages.
Research tracking internalized retail order flow reveals that retail traders systematically suffer losses on their complex and single-leg options trades 30. Studies utilizing OPRA data estimate that aggregate retail option portfolios experienced daily net losses scaling up to $4.96 million on 10-day holding periods 30. Specifically concerning corporate earnings, an analysis of signed options volume (using Customer classification data) concluded that retail traders incur concentrated losses when attempting to trade around scheduled earnings announcement dates 30.
This retail underperformance is actively monetized by institutional wholesalers through Payment for Order Flow (PFOF) mechanisms. Order flow segmentation in the U.S. prevents direct interaction between retail and institutional orders 31. Wholesalers purchase retail order flow and use it to provide liquidity to institutional investors. The "institutional liquidity cost" - a measure of average absolute retail trade imbalances - indicates that institutions rely heavily on this wholesaler-provided liquidity, particularly when market liquidity is scarce, resulting in annualized liquidity premia of 2.7% to 3.2% post-2010 31. Ultimately, retail traders attempting to guess the directional outcome of binary catalysts supply the liquidity required by larger institutional players executing precise volatility and accumulation models.
Quantitative Swing Trading Strategy Execution
Transforming the mechanics of earnings and macroeconomic catalysts into a profitable swing trading methodology requires rigid risk management, probabilistic modeling, and an understanding of strategy archetypes.
Momentum Versus Mean Reversion Profiles
Swing trading strategies responding to catalysts generally fall into two statistical profiles: momentum (trend-following) and mean reversion (contrarian).
Momentum Trading: Momentum strategies capitalize on the premise that markets are slow to price in new information 3233. An earnings beat that gaps up 10% may seem "overextended" to a novice, but momentum traders recognize this as the beginning of institutional repricing (the PEAD effect) 32. Momentum systems generally operate with lower win rates but highly asymmetric payout profiles, relying on a few massive winners to offset frequent small losses 32. Academic reviews show that momentum winner portfolios consistently outperform losers by approximately 1.39% per month, reinforcing the long-term strength of trend-following strategies 32. For instance, quantitative models trading post-earnings breakouts seek to enter on the first pullback after the institutional gap, explicitly avoiding holding the asset through the earnings print itself to bypass the overnight gap risk and IV crush 3444.
Mean Reversion Trading: Conversely, mean reversion strategies assume that sudden, violent price spikes - especially those on low volume or driven by panic selling - are structural overreactions that will eventually snap back to their historical moving averages 3233. Mean reversion strategies typically boast higher win rates (often exceeding 60%), but suffer from negative skewness, meaning the average winning trade is smaller in magnitude than the occasional catastrophic loss if a trend fails to revert 3233. Research by Lehmann demonstrated that short-term contrarian mean reversion strategies generate abnormal returns of roughly 1% to 2% per week after extreme short-term moves, while De Bondt and Thaler's long-term reversal study found prior market losers significantly outperformed winners over 3-to-5-year holding periods 32.
Advanced algorithmic applications in cryptocurrency markets utilizing Risk-Aware Deep Q-Networks (DQN) demonstrate that blending momentum strategies with volatility-driven position sizing can yield extraordinary results. By scaling exposure inversely with 20-day realized volatility and optimizing for the Sharpe ratio, augmented RL-based trading models achieved 825.72% returns for Bitcoin, representing a 12-fold gain versus static buy-and-hold strategies 45.
Risk-Reward Dynamics and Expectancy Optimization
The viability of any swing trading strategy relies on the mathematical relationship between the Win Rate and the Risk/Reward Ratio (RRR). A high win rate is meaningless if the risk-reward profile is deeply negative. The breakeven win rate is calculated using a standard expectancy formula:
$$Breakeven Win Rate = \frac{1}{1 + Risk/Reward Ratio}$$
According to this dynamic, a swing trader employing a strict 2:1 RRR (risking $1 to make $2) only requires a win rate of 33.3% to break even before trading costs 324647.
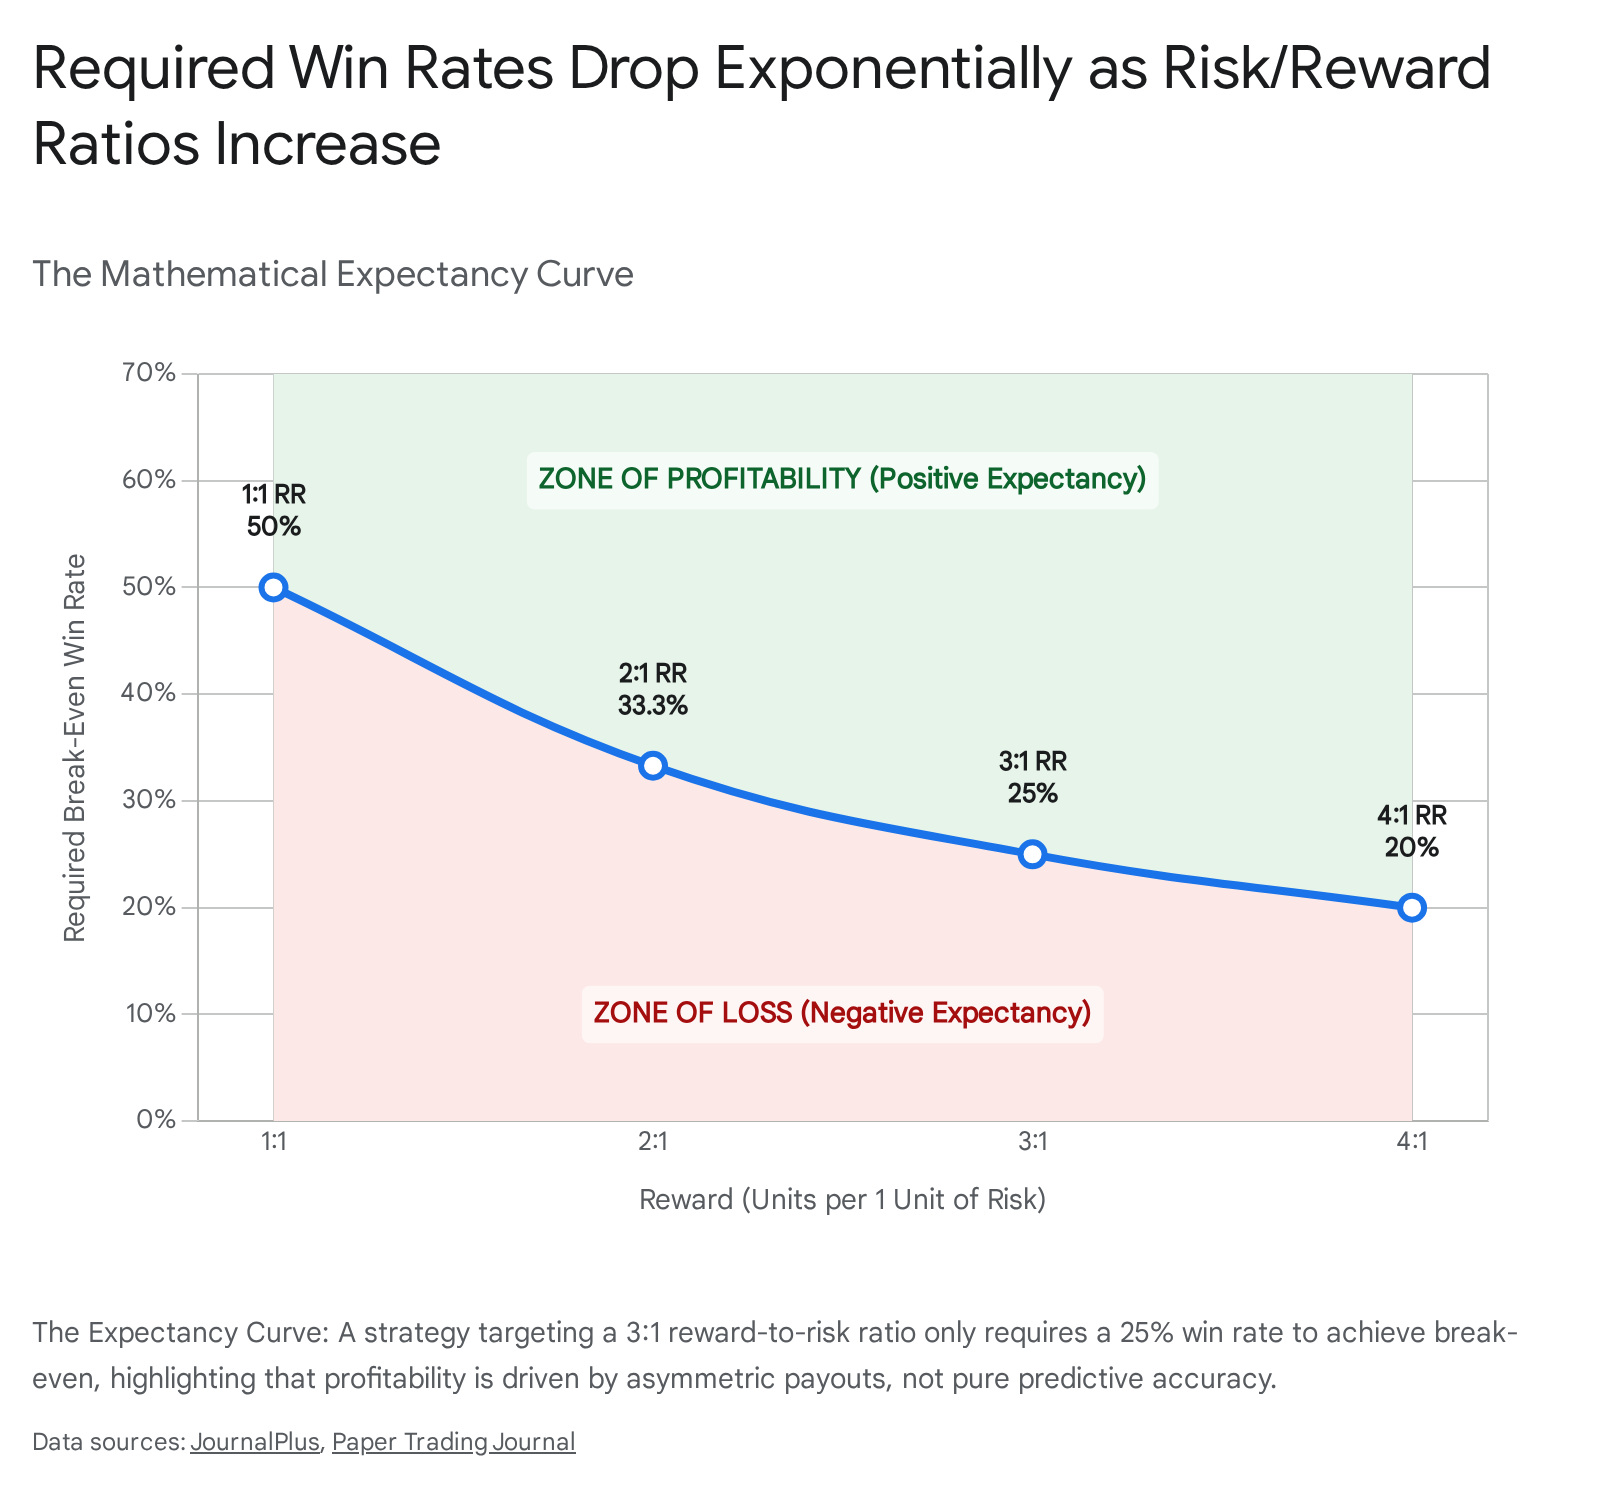
| Risk/Reward Ratio | Minimum Win Rate to Break Even | Strategic Application Focus |
|---|---|---|
| 1:0.67 | 60.0% | High-probability mean reversion fades, volatility shorting. |
| 1:1 | 50.0% | Standard intraday scalping, range-bound swing trades. |
| 1:1.5 | 40.0% | Conservative momentum pullbacks in low volatility. |
| 1:2 | 33.3% | Optimal baseline for standard post-catalyst swing trading. |
| 1:3 | 25.0% | High-volatility breakouts, macro event tail-risk hunting. |
| 1:4 | 20.0% | Deep out-of-the-money option speculation. |
Table 4: The mathematical inverse relationship between risk-reward ratios and required break-even win rates 32344647.
Structural Pitfalls in Quantitative Backtesting
Swing traders attempting to systematize catalyst trading rely heavily on historical backtesting. However, quantitative models are highly susceptible to data integrity errors that systematically inflate simulated returns, leading to catastrophic failure in live execution.
Survivorship bias occurs when a historical dataset only includes equities that currently exist, ignoring those that went bankrupt, were delisted, or were acquired during the test period 48353637. A trading model buying steep pullbacks might show brilliant returns if tested on today's S&P 500, because the dataset implicitly filters out companies that pulled back and subsequently went to zero (e.g., during the dot-com bubble or the 2008 financial crisis) 36. Academic studies tracking mutual fund databases indicate that survivorship bias artificially inflates average annualized returns by roughly 0.9%, while single-equity momentum models can overstate annual returns by 1% to 4% if delisted assets are excluded 3536.
Look-ahead bias is the most pernicious error in fundamental backtesting, particularly regarding earnings catalysts. It occurs when a trading algorithm bases historical decisions on information that was not publicly available at the exact moment of the simulated trade 483537. The textbook example involves corporate earnings restatements. A company may report an EPS of $1.00 in Q2, but quietly revise it down to $0.80 in Q3 35. If the backtesting database overwrites the Q2 data with the revised $0.80 figure, a simulation running on the Q2 date is inadvertently "looking ahead" into the future, reacting to data it could not possibly have known 35. To mitigate this, institutional quants must use "point-in-time" databases that archive the data exactly as it appeared at a specific historical timestamp 3536.
Finally, theoretical models often fail to account for market microstructure frictions, particularly slippage - the difference between the expected price of a trade and the actual execution price 483752. During a post-earnings volatility spike, bid-ask spreads widen significantly. A backtest might assume execution at the closing price of a breakout candle, but in a live, fast-moving market, an order might suffer 0.5% to 1% slippage. Over hundreds of trades, ignored transaction costs and liquidity constraints rapidly erode a strategy's edge, transforming a simulated positive expectancy into a realized negative return 4852.