How Your Credit Score Is Calculated
Credit scores are calculated by proprietary algorithms that ingest your raw financial data - such as payment history, debt loads, and account age - and use statistical models to predict how likely you are to default on a loan within the next two years. While the exact mathematical formulas are closely guarded corporate secrets, the major scoring models primarily weigh how consistently you pay your bills on time and how much of your available credit limit you actively use. Understanding the precise mechanics behind these algorithms allows consumers to strategically manage their financial reputation and secure significantly lower borrowing costs.
The Mechanics of Credit Scoring Algorithms
When a consumer applies for a loan, a credit card, or a mortgage, the lender does not manually review a stack of financial documents. Instead, the modern financial system relies on a heavily automated data extraction and processing pipeline. Every billing cycle, your creditors - banks, credit card issuers, and auto lenders - send standardized data about your accounts to the three major consumer credit reporting agencies: Experian, Equifax, and TransUnion 12.
The raw data stored in these massive databases is vast and largely unstructured. To translate this history into a digestible risk metric, analytics companies like the Fair Isaac Corporation (FICO) and VantageScore Solutions employ an Extract, Transform, Load (ETL) pipeline to prepare the data for predictive modeling 34.
The Data Pipeline: Extraction to Transformation
The journey from a raw credit report to a three-digit score begins with data extraction. Specialized software systems pull specific field types from a consumer's credit file. These fields form the foundational architecture of the credit evaluation 35.
The extraction process categorizes data into distinct buckets: * Personal Information: Name, address, and Social Security Number. While crucial for identity verification and fraud prevention, demographic data is strictly excluded from the scoring algorithm itself 5. * Trade Lines: The core financial data, including account numbers, loan types (revolving vs. installment), current balances, credit limits, payment history, and account opening dates 5. * Inquiries: A chronological list of organizations that have accessed the credit file 5. * Public Records and Collections: Derogatory marks such as bankruptcies, civil judgments, tax liens, and details of unpaid debts handed over to collection agencies 56.
Once extracted, the data undergoes rigorous transformation and cleansing. In computer science and predictive modeling, the axiom "garbage in, garbage out" dictates that algorithms are only as reliable as their underlying data. During the transformation phase, the system resolves inconsistencies - such as a missing middle initial across different trade lines - and aggregates the data to produce a unique, standardized customer signature 47.
Building the Scorecard: Logistic Regression and Machine Learning
With the data structured, it is fed into the scoring model. Traditionally, credit scorecard development has relied heavily on logistic regression. In this phase, the transformed variables are run through a statistical model that has been trained on vast datasets of historical consumer behavior. The logistic regression model seeks to understand the mathematical relationship between specific variables (e.g., carrying a high credit card balance) and credit risk (the statistical likelihood of default) 3.
In the lending industry, these models are often categorized into Application Scorecards (A-scores) for front-end risk management when evaluating new applicants, and Behavior Scorecards (B-scores) for the ongoing back-end risk management of existing customers 3. Both models ultimately aim to answer the same question: What is the probability that this specific consumer will fall at least 90 days behind on a bill within the next 24 months? 67.
Once the probability of default is calculated, the final step involves scaling the model's outputs. The raw statistical probability is converted into a recognizable three-digit number, designed to be easily interpretable by human decision-makers and automated underwriting systems alike. This scaling process ensures that a higher numerical value universally indicates a lower risk of default 38.
Proprietary Trade Secrets vs. Public Transparency
While the financial industry understands the basic ingredients that go into a credit score, the exact recipe remains a closely guarded secret. FICO and VantageScore are competing private entities; FICO, for instance, generates revenue by charging the credit bureaus a fee every time one of its proprietary scores is generated 912.
Because the specific mathematical weights, decision trees, and codebases are protected intellectual property, the algorithms cannot be audited by the general public 812. Consumers and lenders are provided with the general categories of what matters - such as the fact that payment history is the most important factor - but they cannot see the underlying code that translates a single 30-day late payment into a specific 85-point drop 13. This secrecy has led to calls for increased transparency, with critics arguing that a metric so fundamental to modern economic life should not be entirely obscured inside a "black box" 1214.
The Two Giants: FICO vs. VantageScore
For decades, the credit scoring industry was effectively a monopoly. The landscape changed in the mid-2000s, leading to the dual-model ecosystem that exists today.
A Brief History of FICO
The modern credit scoring system was born in 1956 when an engineer named Bill Fair and a mathematician named Earl Isaac founded the Fair Isaac Corporation. In 1958, they introduced the Credit Application Scoring Algorithms 1516. However, it was not until 1989 that FICO introduced the first general-purpose credit scoring model to lenders 915.
Over the decades, FICO became the undisputed industry standard. In 1995, Fannie Mae and Freddie Mac announced that mortgage lenders must use FICO scores to assess creditworthiness for conforming loans, permanently cementing FICO's dominance 10. Today, FICO scores are used in 90% of top lending decisions in the United States 1811. The company has released multiple iterations of its algorithm, with FICO Score 8 (launched in 2004) and FICO Score 9 (launched in 2014) being the most widely used baseline models today 17.
FICO also creates industry-specific algorithms, such as the FICO Auto Score and FICO Bankcard Score. These specialized models are built on the same foundation as the base scores but adjust the internal weights based on industry-specific risk behaviors, and they operate on a slightly different mathematical scale of 250 to 900 71213.
The Rise of VantageScore
In 2006, the three major credit bureaus - Equifax, Experian, and TransUnion - recognized the risk of relying entirely on a third-party algorithm and joined forces to create a competing model: VantageScore 816. Managed by an independent company called VantageScore Solutions, LLC, the model was designed to introduce more consistency across the three bureaus 8.
Early versions of VantageScore (1.0 and 2.0) used a scale of 501 to 990 and assigned consumers letter grades from A to F 113. Realizing that this confused consumers accustomed to FICO's scale, VantageScore 3.0 (released in 2013) and VantageScore 4.0 (released in 2017) adopted the identical 300 to 850 range 1713. While FICO still dominates mortgage lending, VantageScore is heavily used by credit card issuers, personal loan providers, and free consumer credit platforms like Credit Karma and Chase Credit Journey 92214. In 2023 alone, usage of VantageScore increased by 42%, with over 27 billion scores drawn by institutions 115.
Minimum Scoring Criteria: The "Thin File" Problem
One of the most consequential architectural differences between the two algorithms is who they are actually capable of scoring.
FICO's algorithm requires a consumer to have a minimum "thickness" to their credit file. To generate a standard FICO score, a consumer must have at least one credit account that has been open for six months or more, and at least one account that has been reported to the credit bureaus within the prior six months 91116.
VantageScore was engineered to be more inclusive of new borrowers. The VantageScore algorithm can generate a valid credit score with as little as one month of credit history, provided at least one account has been reported within the past 24 months 161116. This programmatic distinction allows VantageScore to score millions of consumers - such as recent immigrants or young adults just opening their first accounts - who are considered completely unscorable by older FICO models 1122.
Breaking Down the Calculation, Factor by Factor
While FICO and VantageScore models analyze the exact same raw data from your credit reports, they assign different levels of importance, or weights, to various financial behaviors 9. This is why a consumer can check their FICO score and their VantageScore on the exact same day and see a discrepancy of 20 points or more 616. In general, VantageScore credit scores average about 14 points higher than classic FICO scores 6.
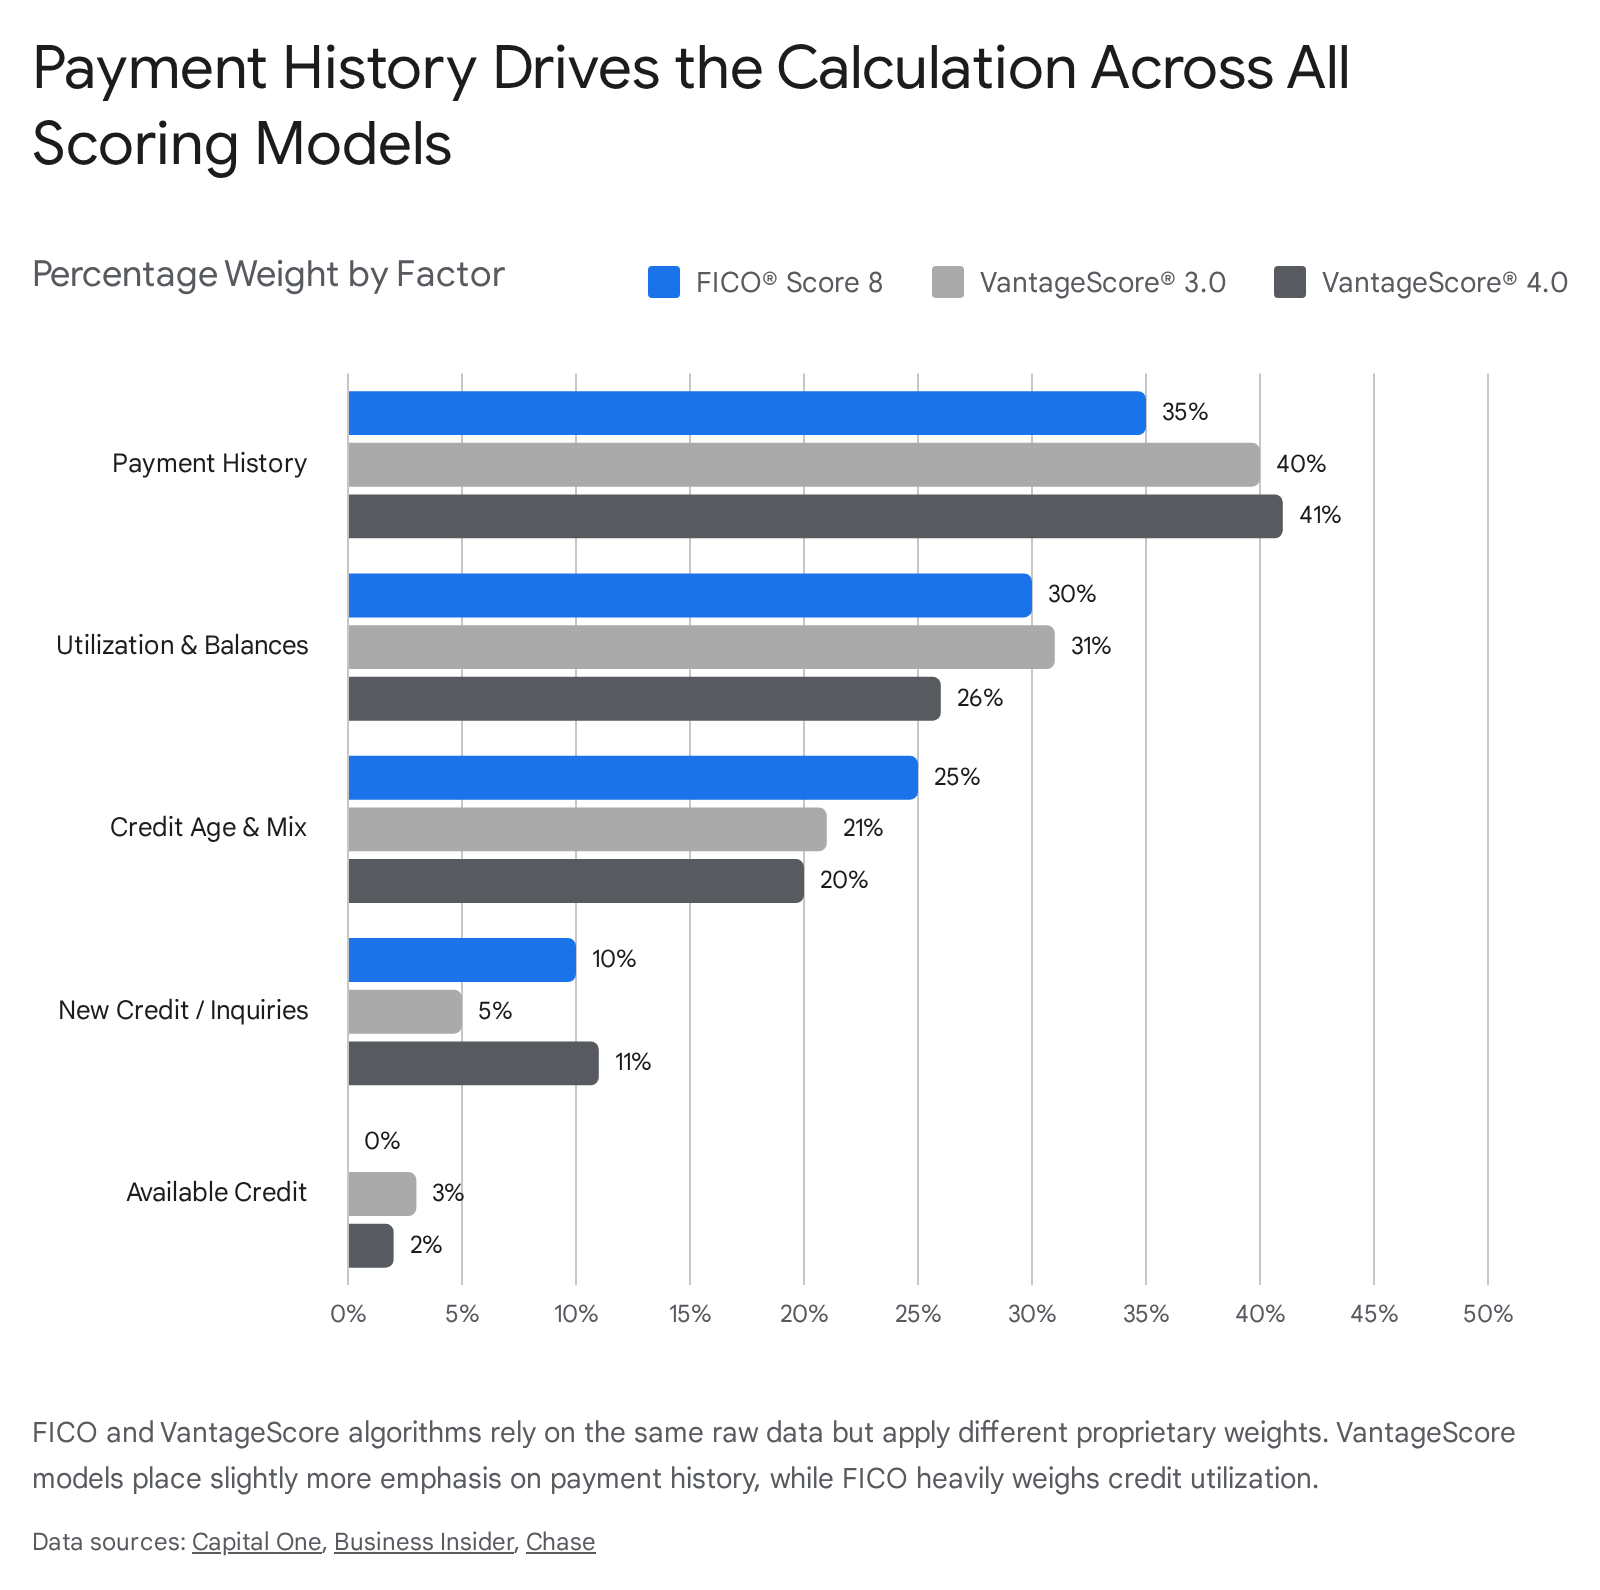
The table below outlines how the three most common baseline models weigh the components of a consumer's credit file:
| Scoring Factor | FICO Score 8 | VantageScore 3.0 | VantageScore 4.0 | Mechanism in the Algorithm |
|---|---|---|---|---|
| Payment History | 35% | 40% | 41% | The historical track record of paying bills on time. |
| Credit Utilization & Balances | 30% | 31% (Combined) | 26% (Combined) | The percentage of available revolving credit limits currently in use. |
| Credit Age & Depth | 15% | 21% | 20% | The age of the oldest account and the average age of all open accounts. |
| Credit Mix | 10% | Included in Depth | Included in Depth | The diversity of the portfolio (e.g., managing both installment loans and revolving credit). |
| New Credit / Inquiries | 10% | 5% | 11% | Recent applications for new lines of credit. |
| Available Credit | Included in Utilization | 3% | 2% | The total absolute dollar amount of credit available to draw upon. |
Payment History: The Heaviest Weight
Making up roughly 35% to 41% of a credit score, payment history is universally the most heavily scrutinized variable 112. Predictive algorithms treat human behavior strictly mathematically: past reliability is deemed the single most accurate predictor of future performance.
A single missed payment that hits the 30-day late mark can trigger a catastrophic point drop - sometimes erasing 90 to 110 points on a VantageScore, or up to 150 points in internal models, depending on the starting score 2617. Counterintuitively, the algorithms punish consumers with excellent credit (e.g., 780+) much more severely for a late payment than consumers who already have poor credit 18. The logic is simple: a late payment from a historically flawless borrower indicates a sudden, severe financial disruption, whereas a late payment from a subprime borrower is already priced into their existing risk profile.
Derogatory marks such as late payments, charge-offs, and accounts sent to collections generally remain on a credit report for seven years, while bankruptcies can linger for up to ten years 1718. However, scoring algorithms apply a time-decay factor. A late payment from last month will suppress a score aggressively, but the mathematical penalty of that same late payment diminishes significantly after two or three years of subsequent on-time behavior. Furthermore, newer models like VantageScore 4.0 have been reprogrammed to ignore paid medical collections entirely and significantly reduce the penalty for unpaid medical debt, recognizing that medical emergencies do not accurately predict a consumer's willingness to repay traditional loans 613.
Credit Utilization and the Shift to Trended Data
Credit utilization measures the amount of revolving debt a consumer currently owes compared to their total available credit limits 18. If a consumer has a single credit card with a $10,000 limit and a $3,000 balance, their utilization is 30%. Financial experts and the algorithms themselves heavily favor consumers who keep this ratio below 30%, with optimal scores often awarded to those utilizing less than 10% 1826.
Historically, older models like FICO 8 and VantageScore 3.0 calculated utilization as a static "snapshot" 69. The algorithm only looked at the exact balance reported by the creditor on the day the score was pulled. If a consumer maxed out a credit card for an emergency but managed to pay the balance down to zero the day before the reporting date, the algorithm would see a 0% utilization and generate a flawless score 91619.
The Revolution of Trended Data: Newer models, specifically VantageScore 4.0 and FICO 10T, have fundamentally altered this calculation by introducing "trended data" 9. Instead of analyzing a static photograph of your balances, these algorithms watch a 24-month rolling video of your financial behavior. They are programmed to identify trajectories: Is the consumer consistently paying down their principal balances every month, or are they slowly racking up higher debts and only making minimum payments? 6926.
By leveraging machine learning over longitudinal data, VantageScore 4.0 and FICO 10T mathematically reward consumers who exhibit "transactor" behavior (paying balances in full) over those who exhibit "revolver" behavior (carrying high balances month-to-month) 69.
Length and Depth of Credit History
Accounting for roughly 15% of a FICO score and 20% of a VantageScore 4.0, the length of your credit history signals stability 1214. The algorithms calculate the age of your oldest account, the age of your newest account, and the average age of all your accounts combined 20. Consumers who have managed credit accounts for decades without defaulting are statistically much safer bets than a 20-year-old with exactly six months of history.
This is why financial advisors routinely caution against closing old, no-annual-fee credit cards. While a closed account in good standing will remain on a credit report for up to 10 years, closing it instantly reduces your total available credit (spiking your utilization ratio) and eventually falls off the report, potentially reducing your average age of accounts 1920.
Credit Mix: Balancing Revolving and Installment Debt
Lenders want to see evidence that you can handle multiple types of financial obligations simultaneously. The algorithms allocate about 10% of the score calculation to "credit mix" 1218. The models look for a healthy blend of revolving accounts (credit cards, retail store cards) and installment accounts (auto loans, mortgages, student loans) 1820. A consumer with only five credit cards is viewed as slightly riskier than a consumer with two credit cards, a car loan, and a mortgage, even if both consumers have never missed a payment 18.
New Credit, Hard Inquiries, and Deduplication Windows
When you apply for a new loan or credit card, the prospective lender conducts a "hard inquiry" on your credit report. Algorithms view consumers who actively seek out large amounts of new credit in a short time frame as high-risk, anticipating cash-flow problems. Consequently, a hard inquiry typically docks a credit score by a few points 2217.
However, scoring models are programmed to distinguish between a consumer desperately applying for six different credit cards and a consumer responsibly shopping around for the best interest rate on a single mortgage. This is handled via algorithmic "deduplication."
If multiple hard inquiries for the same type of loan hit your report within a specific time window, the algorithm groups them together and scores them as a single inquiry 7. The nuance lies in the timeframe: FICO models generally allow a 45-day deduplication window for mortgages, auto loans, and student loans 716. VantageScore applies a stricter 14-day deduplication window, but generously applies this logic to all types of credit, including credit cards 71621.
Anomalies in the Algorithm: Why Good Behavior Sometimes Lowers Scores
One of the most frustrating experiences for a consumer is making a financially responsible decision - such as paying off a five-year auto loan - only to watch their credit score immediately drop 2022. This occurs because algorithms lack human context; they only see the structural changes to the data pipeline.
The "Paid-Off Loan" Penalty
When an installment loan is paid in full, the account status changes to "closed." This triggers a cascade of recalibrations within the scoring model 2022: 1. Credit Mix Reduction: If the paid-off loan was your only installment account, your credit portfolio just lost its diversity. The algorithm docks points because your "credit mix" is now entirely composed of revolving debt 1822. 2. Utilization Spikes: If you pay off and close a revolving line of credit, the algorithm instantly subtracts that available credit limit from your total pool. If your overall balances remain the same, your utilization ratio mathematically spikes, dragging down the 30% of your score dedicated to debt load 1820. 3. Active Balance Metrics: Some proprietary algorithms reward consumers who have active installment loans with low balances relative to the original loan amount. When the account closes, the model no longer factors in that "low balance" indicator 22.
Fortunately, these algorithmic penalties are usually temporary. The positive history of the paid-off loan remains on your credit report for up to a decade, and the score typically stabilizes and rebounds within a few months of the closure 1822.
The Checking Account Misconception
A related anomaly is the belief that closing an everyday bank account impacts credit. It does not. Deposit accounts - such as checking, savings, and certificates of deposit - are never reported to the credit bureaus and are entirely invisible to FICO and VantageScore algorithms 3435.
The only scenario in which a checking account affects a credit score is through secondary negligence. If a consumer closes a checking account but forgets to halt an automated subscription, the account can be overdrawn. If the bank cannot collect the overdraft fees, they may sell the debt to a collection agency, which will then report the unpaid debt to the credit bureaus, severely damaging the consumer's score 342324.
The New Frontier: Rent, BNPL, and Alternative Data
For the first fifty years of its existence, the credit scoring system suffered from a massive structural bias: it primarily tracked traditional debt products. If a consumer paid their rent and utility bills flawlessly for twenty years, the algorithms saw nothing. But if they missed a single utility payment and it went to collections, the algorithms penalized them heavily 25. This negative-only reporting framework meant that millions of responsible consumers could not build credit through their largest monthly expenses.
Moving Beyond Negative-Only Reporting
To modernize the system and increase financial inclusion, the industry is aggressively pivoting toward alternative data. In 2019, Experian launched Experian Boost, an opt-in service that allows consumers to connect their checking accounts directly to the credit bureau via open banking APIs 2640. The platform scans the bank account specifically for recurring, on-time payments to telecom providers, utility companies, and video streaming services, and injects that positive data directly into the consumer's Experian credit file 26. Because payment history is the most heavily weighted factor in the algorithm, this new data stream can trigger an instantaneous score increase 26.
The Impact of Rent Reporting
The integration of rent payments is arguably the most significant advancement for lower-income and younger demographics. Services like Boom, RentTrack, and Esusu now act as intermediaries, verifying rent payments and reporting them as positive trade lines to the bureaus 4027.
A rigorous 2025 randomized controlled trial by the Urban Institute analyzed the algorithmic impact of rent reporting on subsidized housing residents 2528. The researchers found that adding rent data increased the likelihood of a renter becoming "credit visible" (generating a score for the first time) by 12 percentage points 2528. For consumers with "thin files" (fewer than five open accounts), establishing a 12-month rental trade line frequently boosted scores by 10 to 30 points, lifting many previously unscorable renters directly into "near-prime" (601+) territory 2540.
Buy Now, Pay Later (BNPL): Factoring in "Phantom Debt"
The explosive popularity of "Buy Now, Pay Later" (BNPL) services like Affirm, Klarna, and Afterpay introduced a massive blind spot to the financial system. Millions of consumers were utilizing short-term, interest-free installment loans that were completely invisible to traditional credit scoring models 4329. By late 2023, the Federal Reserve estimated that nearly 1 in 5 U.S. households had recently used BNPL .
This "phantom debt" posed a unique programmatic challenge. BNPL fundamentally breaks older credit algorithms because consumers open and close these micro-loans constantly 2945. If a consumer used BNPL four times in one month to buy clothes, a traditional FICO 8 algorithm would register four hard inquiries and four brand-new accounts, immediately crashing the consumer's "average age of accounts" and flagging them as a high-risk borrower spiraling into debt 4345.
To solve this, analytics companies are rewriting the code. In the Fall of 2025, FICO is releasing two specialized models: FICO Score 10 BNPL and FICO Score 10T BNPL 432945. Instead of punishing consumers for opening multiple accounts, the new FICO algorithms utilize an innovative aggregation technique. They bundle all separate BNPL micro-loans together, treating them mathematically as a single, ongoing behavioral variable 4345. VantageScore 4.0 is already capable of ingesting this alternative data 1030. If a consumer repays their BNPL installments on time, the new models will reward them, offering a critical bridge to mainstream credit for younger demographics 29. Conversely, if they miss a payment, it will damage their score exactly like a traditional credit card default 4329.
Systemic Bias, "Credit Invisibles," and Regulatory Scrutiny
While algorithms evaluate data impartially, the data itself is a reflection of historical inequities. A credit score is strictly a measure of debt repayment probability; algorithms are legally barred from considering a consumer's income, total net worth, savings account balances, or employment status 31. Furthermore, the Equal Credit Opportunity Act (ECOA) explicitly forbids credit scoring models from factoring in demographic data such as race, color, religion, national origin, sex, or marital status 1415.
The Demographic Reality of Credit Invisibles
Despite these legal firewalls, algorithms are trained on historical data sets that are deeply intertwined with systemic bias 1415. Decades of discriminatory practices like redlining created segregated neighborhoods and a "dual-credit" environment 14. Because minority and low-income populations were historically denied access to mainstream banking, they are disproportionately shut out of the algorithmic scoring system today 14.
In a landmark 2015 report, the Consumer Financial Protection Bureau (CFPB) found that 26 million American adults (11% of the population) were "credit invisible," meaning they had no credit file whatsoever 3233. An additional 19 million consumers had records that were mathematically unscorable by existing models due to thin files or stale data 3233. The demographic divide was stark: nearly 30% of consumers in low-income neighborhoods were credit invisible, compared to just 4% in upper-income neighborhoods 3233. Furthermore, Black and Hispanic consumers were significantly more likely to be credit invisible or unscorable than White consumers 3233.
By modernizing their data pipelines to include alternative data and utilizing machine learning to score thin files, the industry is making progress. A 2025 update by the CFPB indicated that, through enhanced methodologies and the inclusion of previously ignored data (like deferred student loans), the number of credit invisible Americans had dropped to roughly 7 million by the end of 2020 34.
The CFPB Crackdown on "Black Box" AI Models
As financial institutions increasingly abandon traditional logistic regression in favor of complex artificial intelligence and machine learning (AI/ML) to underwrite loans, federal regulators have issued stern warnings.
The CFPB has explicitly stated that there is no "advanced technology exception" to federal fair lending laws 3536. Under the ECOA and Regulation B, if an algorithm denies a consumer a loan, the lender must provide an Adverse Action Notice (AAN) that clearly discloses the specific, principal reasons for the denial 3537.
A bank cannot legally claim that their proprietary AI is a "black box" that is too mathematically complex to explain to the consumer 3537. The CFPB has directed institutions to utilize "automated debiasing methodologies" to actively search for alternative variables that maintain the model's predictive accuracy while producing less discriminatory outcomes against protected classes 365455. Furthermore, if an algorithm denies a loan based on non-traditional surveillance data that lacks an intuitive connection to a consumer's finances, the lender faces intense regulatory scrutiny regarding the specificity of their AANs 38.
The Real-World Financial Impact of Credit Tiers
The complex math executing inside the servers of Experian, Equifax, and TransUnion translates directly to the cost of everyday life. Lenders do not treat credit scores as a continuous spectrum; they carve the 300 to 850 range into rigid, 20-point tiers 3958. Slipping from a 740 to a 719 might seem like a minor algorithmic fluctuation, but crossing that invisible threshold triggers higher risk premiums and dramatically higher interest rates 3958.
The Cost of Auto Loans by Credit Tier
The auto lending market separates consumers aggressively based on their algorithmic risk profile. Experian's State of the Automotive Finance Market report for Q1 2025 illustrates how heavily credit scores dictate monthly payments 40.
| Credit Tier | FICO Score Range | Average New Car Interest Rate | Average Used Car Interest Rate |
|---|---|---|---|
| Super Prime | 781 - 850 | 5.18% | 6.82% |
| Prime | 661 - 780 | 6.70% | 9.06% |
| Near Prime | 601 - 660 | 9.83% | 13.74% |
| Subprime | 501 - 600 | 13.22% | 18.99% |
| Deep Subprime | 300 - 500 | 15.81% | 21.58% |
A consumer with excellent credit financing a used car will secure an average rate of 6.82%. A consumer with a deep subprime score attempting to buy the exact same vehicle faces an average rate of 21.58% - a crippling mathematical penalty for past financial mistakes 40.
Mortgages: Where Small Score Drops Cost Tens of Thousands
The financial penalty of a low credit score is most severe in the mortgage market, where massive loan balances compound over 30 years.
Based on 2026 data from myFICO, the interest rate differences between credit tiers compound dramatically.
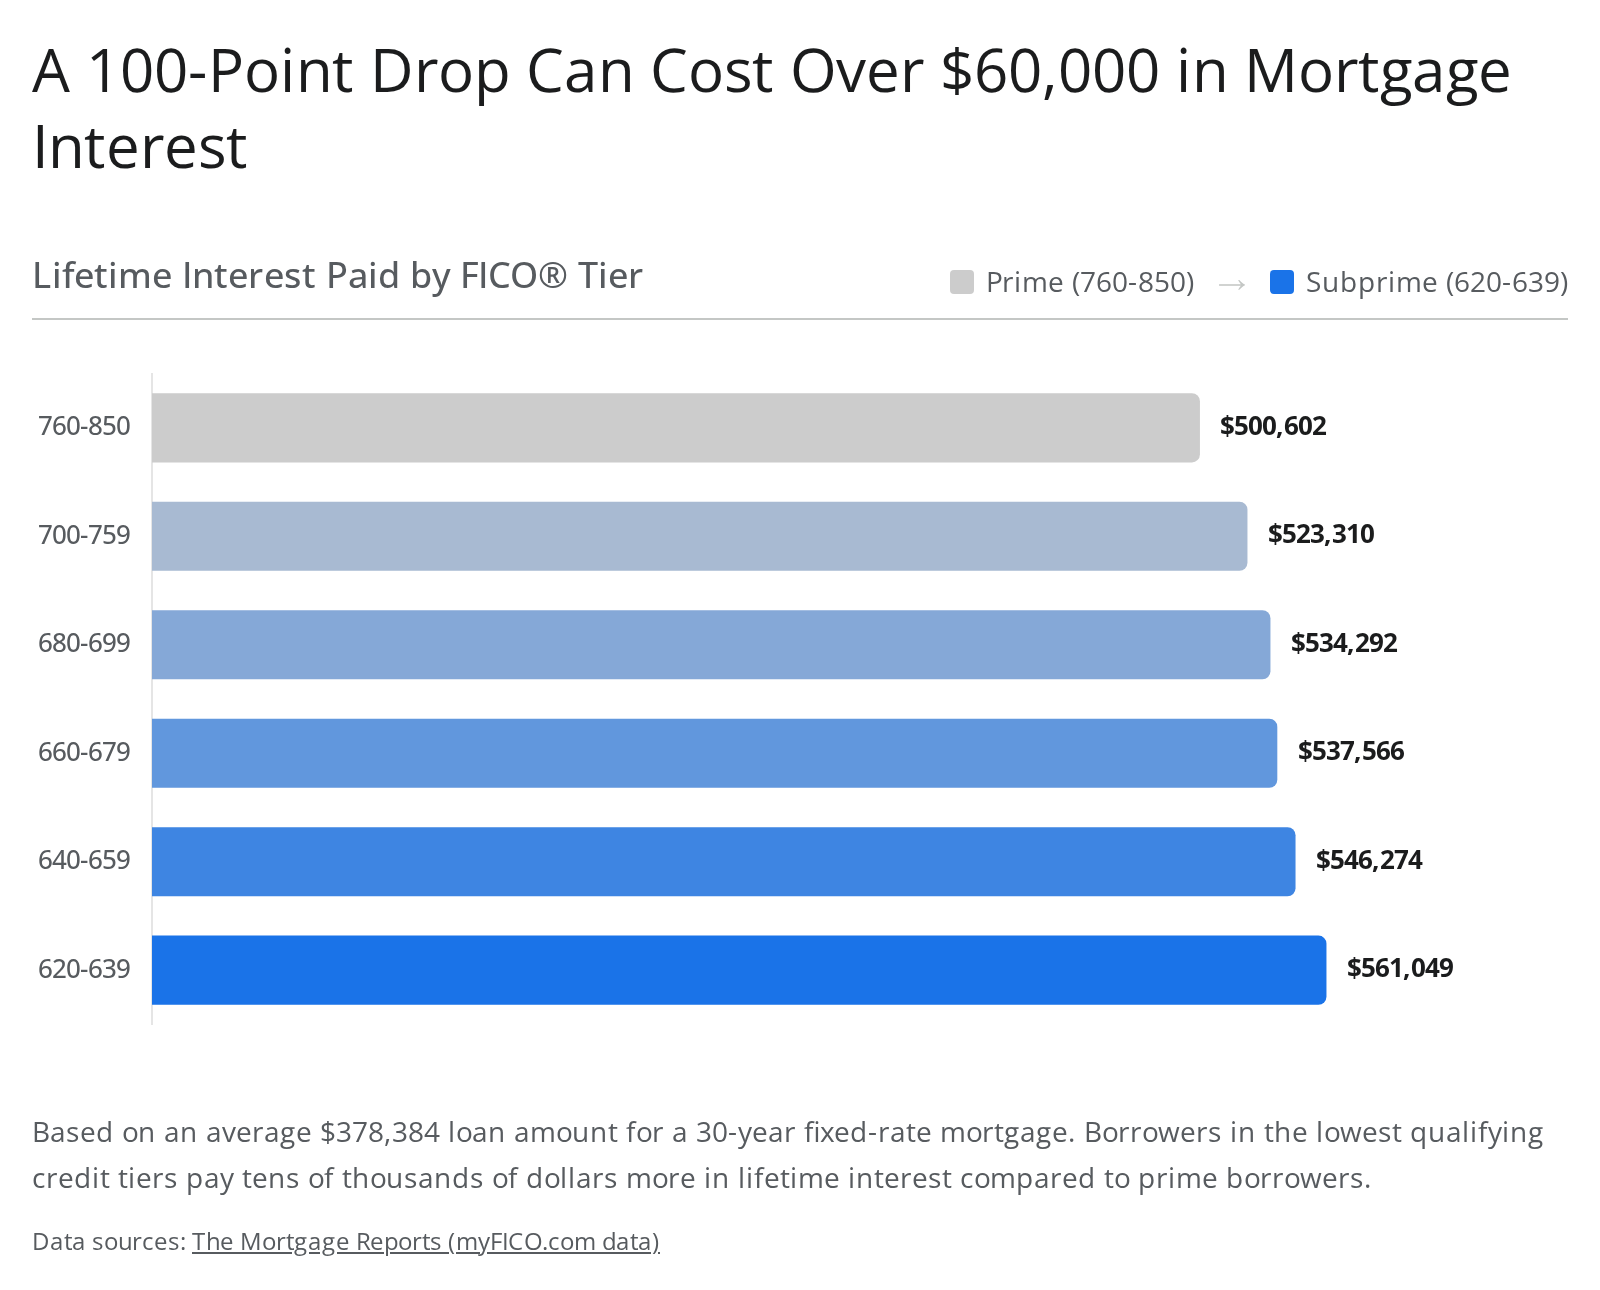
For a standard new single-family home purchase with an average loan amount of $378,384 on a 30-year fixed-rate conventional mortgage, the costs escalate rapidly 39:
| FICO Score Tier | Average Mortgage APR | Estimated Monthly Payment | Total Interest Paid (30 Years) |
|---|---|---|---|
| 760 - 850 | 6.70% | $2,442 | $500,602 |
| 700 - 759 | 6.95% | $2,505 | $523,310 |
| 680 - 699 | 7.07% | $2,535 | $534,292 |
| 620 - 639 | 7.36% | $2,610 | $561,049 |
The data reveals that a borrower in the 620-639 tier pays roughly $168 more per month than a top-tier borrower. Over the 30-year lifespan of the loan, that slight rate increase results in over $60,000 in additional interest payments 39. A recent study by AD Mortgage quantified this on a state-by-state level, finding that improving a score to 760 could save a borrower an average of $20,000 to $30,000, peaking at over $46,000 in savings in high-cost states like Hawaii 60.
How Global Credit Scoring Systems Compare
Because credit scores rely on the data feeds of specific national banking networks, there is no such thing as a "global credit score" 61. If an American with an 850 FICO score relocates to Germany or the UK, they arrive as a "credit invisible" immigrant with a blank slate and must build a new score from scratch 614163.
While the fundamental goal of assessing risk remains the same, different nations approach the calculation using entirely different regulatory and mathematical frameworks.
The Canadian Twin System
Canada's credit system operates almost identically to the United States. It relies on comprehensive reporting, meaning both positive behaviors (on-time payments) and negative behaviors (defaults) are tracked 6164. Canada utilizes two of the same major bureaus - Equifax and TransUnion - and Canadian scoring models are largely adapted from U.S. FICO models 6164. The primary difference is simply the scale: Canadian credit scores range from 300 to 900 61636442.
The United Kingdom: Financial Associations and the Electoral Roll
The United Kingdom does not have a universal scoring model like FICO. Instead, each of its three Credit Reference Agencies (CRAs) - Experian, Equifax, and TransUnion - uses its own proprietary scale. Experian's scale goes from 0 to 999, Equifax's stops at 700, and TransUnion's tops out at 710 61636442.
The UK algorithms factor in two highly unique variables that do not exist in North America: 1. The Electoral Roll: In the UK, registering to vote on the national electoral register is a critical factor in creditworthiness 616466. Algorithms use this public data to verify a consumer's identity and proof of stable residence. Failing to register can severely damage a UK credit score and delay loan applications 646643. 2. Financial Associations: If two people share a joint financial product in the UK, such as a joint bank account or a shared mortgage, a formal "financial association" is created on both of their credit reports. If your spouse or roommate defaults on a separate personal loan, their poor behavior can legally degrade your creditworthiness 6364.
Australia and the EU: Transitioning from Negative-Only Data
Historically, Australia utilized a "negative-only" reporting system. Australian bureaus only recorded adverse events, such as bankruptcies, defaults, and late payments. Under this old system, an empty credit report with zero data was considered optimal 4164. In 2014, Australia modernized its banking laws to implement comprehensive reporting, bringing it closer to the U.S. model by tracking up to two years of positive payment history 4164.
Conversely, many European countries still rely heavily on negative-only systems, operating databases of defaulters rather than building predictive scores based on positive behavior 6442. In Germany, the major credit bureau, SCHUFA, employs a unique mechanism where every consumer starts with a perfect universal score of 100 points, and the score algorithmically decreases as the consumer borrows money or misses payments 41.
| Feature | United States | Canada | United Kingdom | Australia |
|---|---|---|---|---|
| Primary Reporting Type | Comprehensive (Positive & Negative) | Comprehensive | Comprehensive | Comprehensive (Since 2014) |
| Score Range | 300 - 850 (FICO) | 300 - 900 | 0 - 999 (Experian) | 0 - 1200 (Equifax) |
| Electoral Roll Impact | None | None | Extremely High Impact | None |
| Financial Associations | None | Limited to Joint Accounts | Highly Formalized Impact | None |
Debunking Pervasive Algorithmic Credit Myths
Because the mathematical formulas are trade secrets, consumers often attempt to reverse-engineer the algorithms, leading to pervasive and damaging financial myths.
Myth: Closing a Checking Account Lowers Your Score
Deposit accounts - such as checking accounts, savings accounts, and certificates of deposit - are not credit products 343524. Banks do not report deposit activity to the three major credit bureaus, meaning these accounts are entirely invisible to FICO and VantageScore algorithms 3435. Closing a checking account will never directly impact your credit score. The only exception occurs if a consumer abandons an overdrawn checking account and ignores the negative balance; the bank may eventually send the unpaid overdraft fees to a collection agency, which will then report the collection to the bureaus and damage the score 343523.
Myth: Carrying a Small Balance Builds Credit
This is the most pervasive - and expensive - myth in consumer finance. Scoring models take a snapshot (or analyze the trend) of your utilization percentage at the exact moment the credit card issuer generates your monthly statement 19. Carrying a balance forward into the next month, thereby intentionally paying interest to the bank, does absolutely nothing to boost a FICO or VantageScore 19. In fact, leaving a balance unpaid artificially inflates your credit utilization ratio, which mathematically suppresses your score 2619. Consumers achieve the highest possible scores by using their cards regularly but paying the balance down to zero every single month 19.
Myth: Checking Your Own Score Hurts Your Credit
The algorithms are explicitly coded to differentiate between a consumer reviewing their own financial health and a consumer applying for new debt 511. When a consumer checks their own score via a bank app, AnnualCreditReport.com, or a service like Credit Karma, it is logged as a "soft inquiry" 5. Soft inquiries do not enter the mathematical calculation and have zero impact on a credit score. Only "hard inquiries," initiated by a lender during an active credit application, temporarily dock points 517.
Bottom line
A credit score is the automated output of a sophisticated statistical model designed to predict your likelihood of missing a payment over the next 24 months. Whether lenders use a FICO model or VantageScore, the underlying math heavily rewards a flawless, multi-year history of on-time payments and exceptionally low revolving credit balances. While the ongoing integration of alternative data like rent and "Buy Now, Pay Later" loans is helping millions of "credit invisible" consumers establish a financial footprint, maintaining top-tier scores remains the single most effective strategy to save tens of thousands of dollars on long-term borrowing.