
How to Tell If Metrics Drive or Decorate Decisions
To determine whether data is genuinely driving a strategic decision or merely decorating a choice that has already been made, organizations must evaluate if a metric possesses the power to alter a strategy and establish clear causation. True decision-driving metrics work backward from a specific business dilemma to find the necessary data, whereas decorative metrics work forward from whatever impressive-looking data happens to be conveniently available to justify an executive's intuition.
The Illusion of Data-Driven Objectivity
The modern corporate era is heavily defined by the pursuit of the "data-driven decision." Organizations today possess more raw data than ever before in human history, investing massive amounts of capital into advanced analytics, real-time dashboards, and cloud-based computational resources 12. The prevailing corporate mantra dictates that harnessing these data stores will augment human brainpower, eliminate bias, and initiate consistently smarter choices 23.
However, despite these extensive investments, a significant gap remains between the sheer availability of data and the actual execution of objectively sound business strategies. An Accenture survey revealed that only a third of companies report realizing tangible, measurable value from their data initiatives 2. This gap is not a technological failure; it is fundamentally rooted in human psychology, organizational dynamics, and the cognitive mechanisms of choice. Too often, data is not used as a navigational compass, but rather as a rhetorical shield.
The Psychology of Post-Hoc Rationalization
Human beings naturally assume they understand their own decision-making processes. In reality, unconscious forces, visceral emotional reactions, and subtle environmental cues guide our choices in ways that entirely elude conscious introspection 45. When individuals are asked to explain a decision after the fact, they frequently construct narratives that differ entirely from the actual thought process that led to the choice. In behavioral psychology, this is known as the rationalization heuristic or post-hoc rationalization 465.
This phenomenon is not a matter of intentional deception or malice, but rather a subconscious function of cognitive dissonance reduction. When a difficult choice is made, individuals automatically adjust their attitudes to support their decision, increasing their preference for the selected option and decreasing their preference for the rejected alternative 6. Psychologist Timothy Wilson demonstrated this in a famous study involving art selection. Participants who were forced to explicitly explain their reasoning before choosing a piece of art later expressed high levels of regret about their selections. Conversely, those who simply chose based on gut instinct without needing to verbalize a reason remained satisfied weeks later. The very act of verbalizing a reason introduced distortions that led to worse decisions, because the intrinsic factors influencing choices are often impossible to articulate accurately 45.
Neuroimaging studies utilizing functional magnetic resonance imaging (fMRI) have demonstrated that this rationalization process is engaged instantaneously at the moment of the decision itself, rather than after extended post-decision deliberation. Activity in the right-inferior frontal gyrus, medial fronto-parietal regions, and ventral striatum, paired with decreased activity in the anterior insula, indicates that attitude change happens at the neurological level as an emotion regulation process 6.
Because individuals lack genuine, root-cause insight into their intrinsic decision-making drivers, they invent explanations based on what sounds reasonable to themselves and others 45. As humans are natural, evolutionary storytellers, a compelling narrative almost always overshadows factual evidence 455. In the context of business, this means leaders will make an intuitive choice and then subconsciously seek out the data that forms the best story to support it.
The "HiPPO" Effect and Corporate Culture
In traditional corporate settings, this psychological phenomenon manifests as the "HiPPO" effect - an acronym for the Highest Paid Person's Opinion 9. In a HiPPO-centric culture, the chief executive or senior manager relies on their intuition, and subordinate teams are implicitly tasked with scouring databases to find metrics that validate that intuition.
For much of business history, this was simply how operations ran. Executives would gather around a table, debate based on experience and instinct, and the highest-ranking individual would make the final call 9. The justification comes after the action is initiated, utilizing formal rationality and selected data points for post-hoc legitimization rather than actual strategic direction 57.
This transforms the analytics department into an engine for "decision decoration." The data acts as a defense mechanism against scrutiny from boards, investors, or competing factions within the organization, rather than serving as a tool to uncover the truth 11. As noted by researchers, organizations are highly resistant to utilizing analytics that might expose their preferred strategies as flawed. Instead, they leverage the appearance of formal rationality - calculative approaches and dense spreadsheets - to give a veneer of scientific inevitably to human whims 7.
Preference-Driven vs. Decision-Driven Analytics
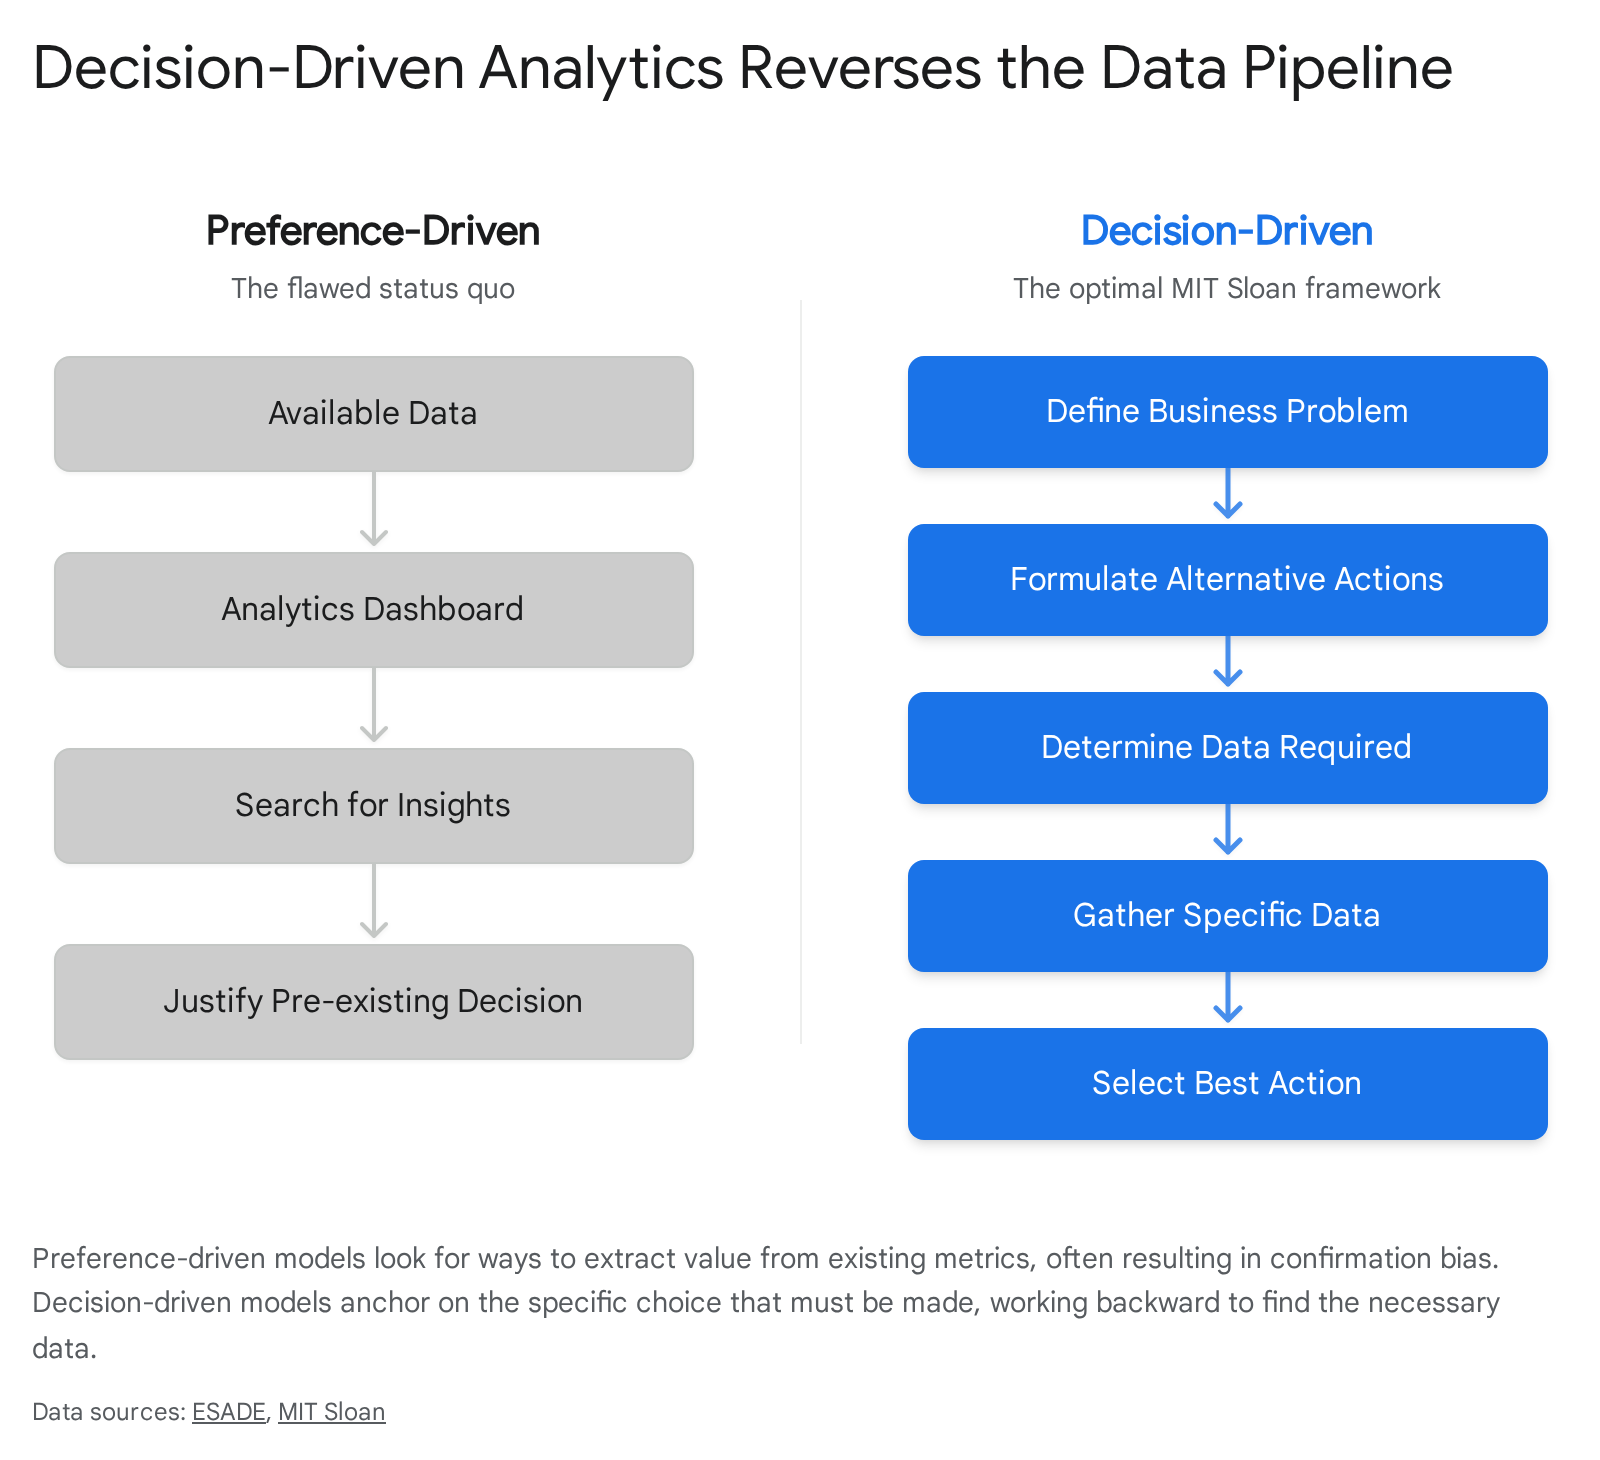
To understand how metrics become decorative, it is essential to examine the fundamental architecture of how organizations interact with their data. According to researchers Bart de Langhe and Stefano Puntoni from the MIT Sloan School of Management, the root of the problem lies in the direction of the analytics pipeline 12.
The Trap of Preference-Driven Analytics
Most organizations take a backward approach to data, which the researchers term "preference-driven data analytics" (often mistakenly praised as "data-driven" decision-making). In this flawed model, companies focus on finding a purpose for the data they already have on hand 12.
Data scientists and analysts look at vast data lakes and attempt to extract value, searching for correlations and interesting trends. However, this approach anchors the organization to available data rather than relevant questions 1. It empowers data providers but puts decision-makers at severe risk of taking data that is consistent with their pre-existing beliefs at face value 1. When you start with the data, it is incredibly easy to cherry-pick the metrics that decorate the strategy you already wanted to execute, falling prey to confirmation bias 18.
The MIT Sloan "Decision-Driven" Framework
To overcome the pitfalls of preference-driven analytics, de Langhe and Puntoni propose a shift to "decision-driven data analytics" 12. This strategy is anchored entirely on the specific decision that needs to be made, working backward to find the data that will best deliver against that objective.
Implementing a genuinely decision-driven data model requires adhering to three specific steps:
- Formulate Alternative Actions (Think Wide, Then Narrow): Business decision-makers - not just data scientists - must define the specific business problem. Crucially, they must explicitly list the alternative courses of action available to them before looking at a single spreadsheet 12.
- Determine Data Requirements: Instead of consulting a pre-existing dashboard to see what numbers are rising or falling, decision-makers and data scientists must jointly ask: "What specific, unknown data is required to figure out which of these alternative actions is the optimal choice?" 12.
- Execute the Best Action: The analysis is then performed solely on the requested data to select the optimal course, isolating the decision from the noise of irrelevant metrics 12.
This human-centric mindset ensures that people stay in charge of the process, utilizing critical thinking over "data worship" 2. It forces organizations to acknowledge that sometimes the data they currently have is entirely useless for the decision at hand, necessitating the collection of new, purposeful data 1.
Distinguishing Actionable Data from Vanity Metrics
Once an organization adopts a decision-driven framework, it must evaluate the nature of the metrics themselves. In the realm of product management, marketing, and corporate strategy, metrics generally fall into one of two starkly opposed categories: vanity metrics and actionable metrics 13915.
The Allure and Danger of Vanity Metrics
Vanity metrics are statistics that appear spectacular on the surface but do not translate to any meaningful, repeatable business results 1510. Eric Ries, who formalized the distinction in his Lean Startup methodology, famously described vanity metrics as the most dangerous numbers in a business because they provide the illusion of success while masking underlying failure 131511.
Vanity metrics provide a constant supply of positive signals, triggering a powerful psychological dopamine response, particularly in high-pressure organizational environments where teams must constantly demonstrate impact to investors or executives 13. Common examples include raw website pageviews, running totals of registered users, total software downloads, or social media follower counts 13151819.
The primary danger of vanity metrics is their total lack of context and their inability to isolate causality 1520. Because running totals (e.g., "total historical app downloads") can literally only increase, they provide a false sense of perpetual growth 1921. A company might celebrate a massive spike in pageviews while customer churn quietly accelerates, driving the business toward bankruptcy while the dashboard flashes green 13.
Consider a real-world example from the nonprofit sector: The organization DoSomething.org once launched a promotional video featuring celebrities asking young people to donate used sports equipment. The video went viral, racking up 1.5 million views - twice as popular as anything they had ever posted 12. The team celebrated the vanity metric as a massive success. However, when the data was scrutinized, those 1.5 million views had resulted in exactly eight sign-ups and zero actual equipment donations 12. The metric (views) decorated a narrative of massive success but masked a total failure in the primary organizational objective.
The Anatomy of Actionable Metrics
Actionable metrics, conversely, connect specific user behavior with concrete business results and clearly guide strategic decisions 13. They demonstrate direct causation, reflect the actual health of the organization, and are usually framed as rates or ratios rather than gross totals 1318. Examples include conversion rates, customer retention rates, customer acquisition costs (CAC), and monthly recurring revenue (MRR) 18.
The fundamental difference lies in utility. If an actionable metric changes, the organization knows exactly what lever to pull to correct it or exploit it 13. If a vanity metric changes, the resulting response is generally confusion, shrugged shoulders, or blind continuation of the status quo 1020.
To highlight the differences clearly, consider the following comparative breakdown:
| Characteristic | Vanity Metrics | Actionable Metrics |
|---|---|---|
| Primary Organizational Purpose | Show activity, visibility, and surface-level success 13. | Support concrete product, strategic, and business decisions 13. |
| Data Trajectory | Often running totals that can only go up (e.g., total registered users) 21. | Rates, ratios, and percentages that fluctuate based on real performance (e.g., churn rate, retention) 18. |
| Strategic Response Triggered | Causes inaction or poor decisions ("Likes are up, let's just keep doing this") 1020. | Drives specific changes ("Acquisition cost is up 20%, we must analyze channel performance immediately") 1020. |
| Connection to Financial ROI | Weak or nonexistent; incredibly difficult to prove revenue contribution 10. | Direct and measurable link to financial impact, sales pipelines, and core business goals 1018. |
| Susceptibility to Manipulation | Easily manipulated by simply spending more money on advertising or bot traffic 10. | Difficult to fake; requires systematic, controlled changes to operations, customer experience, or product quality 10. |
Three Diagnostic Tests for Metric Utility
To establish definitively whether a metric is actively driving a decision or just decorating a dashboard, analysts, managers, and executives can subject their data to three rigorous diagnostic tests. If a metric fails any of these tests, it is likely serving a purely decorative function.
1. The Actionability and Reproducibility Test
The most immediate method to identify a decorative metric is to ask a theoretical question: "If this metric plummeted by 50% tomorrow, or doubled unexpectedly, what specific, concrete business decision would we make?" 1021.
If the answer is "I don't know" or if the strategic response is a mere furrowed brow in an all-hands meeting, the metric is vanity 102021. Actionable metrics dictate clear next steps. For example, knowing that an e-commerce site has a 55% overall bounce rate is practically useless. However, applying segmentation to that metric reveals actionable insight. If the data shows that organic search traffic has a 35% bounce rate while paid ad traffic has a 75% bounce rate, it points directly to a targeting problem in the paid campaigns. The decision is immediate: reallocate or pause the paid ad spend 13.
Furthermore, actionable metrics must be reproducible 24. If a metric spikes, an organization must be able to identify the inputs that caused the spike and intentionally reproduce them. If a metric is driven purely by random chance, viral luck, or external market forces outside the company's control, it cannot drive internal strategy 1024.
2. The Target Test (Goodhart's and Campbell's Laws)
A metric that successfully drives decisions must survive the intense organizational pressure of becoming a target. According to Goodhart's Law - named after British economist Charles Goodhart, who observed the phenomenon in 1975 regarding UK monetary policy - "When a measure becomes a target, it ceases to be a good measure" 14152728.
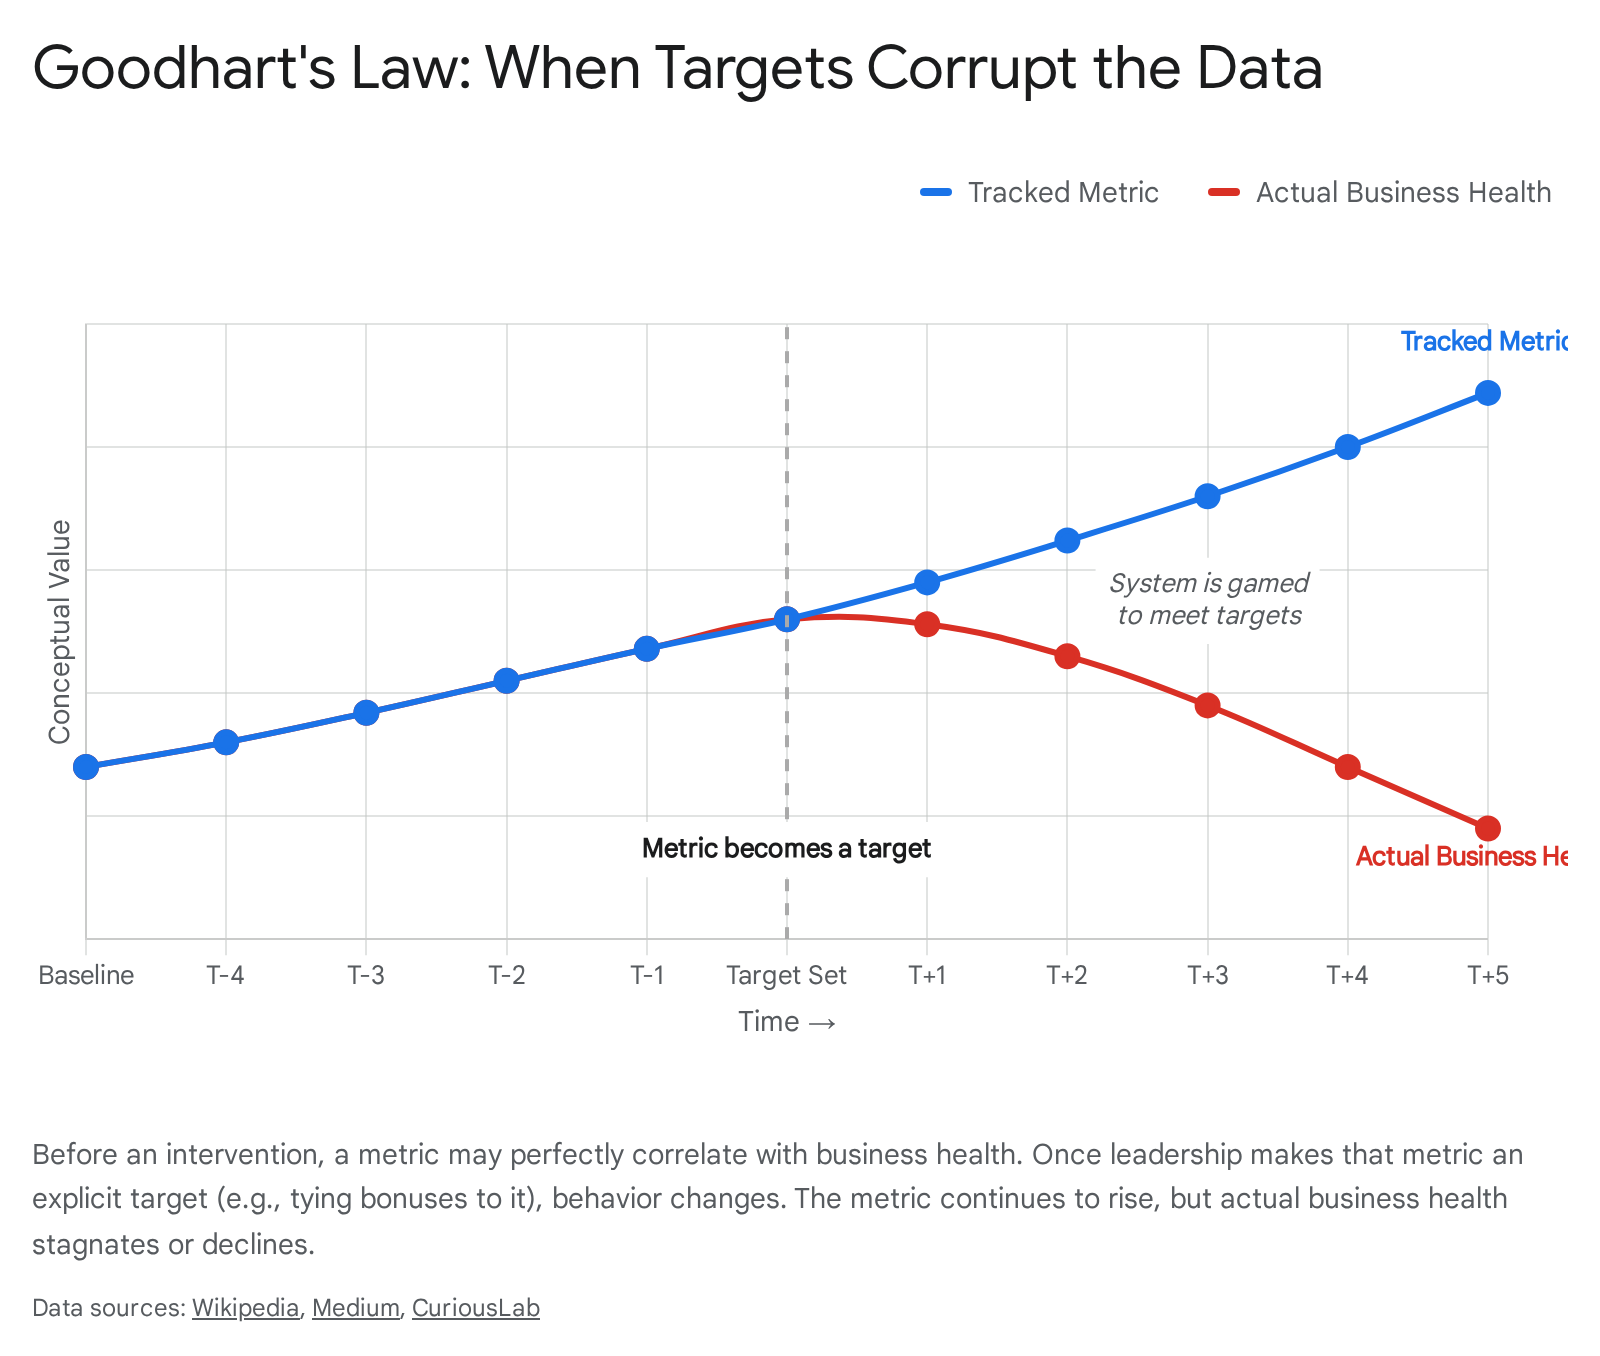
A closely related concept, Campbell's Law, warns that the more a quantitative social indicator is used for decision-making, the more subject it will be to corruption pressures, ultimately distorting the very processes it was intended to monitor 1429.
When individuals are evaluated, compensated, or promoted based on a single metric, they will naturally optimize for that specific metric at the expense of all other systemic factors, effectively turning a diagnostic tool into a decorative illusion 1415. The human drive to meet quotas frequently supersedes the drive to contribute actual value 30.
When metrics are weaponized as targets without safeguards, employees engage in perverse incentives to "game" the system. Historical examples of this are abundant and devastating: * Healthcare: When the British government mandated that hospitals reduce emergency room wait times to under four hours, hospitals met the target by engaging in statistical gaming. Most egregiously, patients were forced to wait inside ambulances parked outside the hospital, and were only officially "admitted" once the hospital was confident they could be seen within the four-hour limit 27. The metric looked perfect on a managerial dashboard, but actual patient care was delayed and degraded. * Customer Service: If a call center aggressively targets "average handle time" or "calls answered per hour," representatives are incentivized to provide subpar service. They may rush callers, skip vital diagnostic steps, or even intentionally disconnect complex calls to keep their individual metrics artificially low 15. * Technology Management: In tech firms where promotions are largely based on "impact radius" (the number of direct reports or budget size under a manager's control), managers are perverseley incentivized to continually expand headcount regardless of actual business need. This creates bloated, inefficient sub-teams, resulting in "headcount bubbles" that eventually lead to mass, devastating layoffs when market conditions tighten 27.
If a metric is easily gamed or incentivizes behavior that harms the broader mission, it ceases to drive sound strategy. Organizations must utilize "paired metrics" (or safeguard metrics) to counteract this phenomenon. For instance, if a sales team is given a strict acquisition quota (a quantity metric), it must be immutably paired with a metric tracking early customer churn rate or engagement levels (a quality metric) to ensure they are acquiring the right kind of customers rather than generating hollow numbers 2731.
3. The Counterfactual Test (Causation vs. Correlation)
The ultimate, gold-standard proof that a metric is driving a decision - rather than merely correlating with it - is the application of counterfactual analysis. A counterfactual test is a backward-looking, what-if analysis that attempts to answer the question: "If this specific intervention did not happen, what would we expect the present to look like?" 3233.
In most corporate environments, causality is assumed simply by looking at a timeline. If a new product feature is launched and user registrations increase by 10% the following month, leadership automatically claims the feature caused the increase. As humans, we are hard-wired to infer causality from correlation when numbers go up, eager to take credit for success (while blaming external factors like "the economy" when numbers go down) 16.
However, without a counterfactual baseline, this assumption is statistically reckless. It is impossible to determine whether the 10% increase was caused by the feature, a seasonal trend, a competitor's misstep, or pure statistical noise 3233. The core problem in causal inference is "bandit feedback" - we only observe the outcomes under the decisions we actually took, leaving the alternative path completely hidden 35.
Counterfactual models attempt to solve this by estimating the difference in potential outcomes, measuring what is known as the "Average Treatment Effect" (ATE) 3517. This is frequently utilized in advanced causal inference algorithms, machine learning fairness testing, and uplift modeling 331737.
For instance, consider human resources attempting to optimize employee retention. Rather than asking if a targeted bonus campaign correlated with lower overall company attrition (a highly flawed, decorative metric), HR analysts must calculate the counterfactual uplift - assessing the probability that a specific, highly valued employee would have stayed even if they had not received the bonus 17. If the employee was going to stay anyway, the bonus was wasted capital; the metric of "employees retained after receiving bonuses" is decorative because it falsely attributes the retention to the intervention.
The Organizational Resistance to Real Measurement
Despite its rigorous ability to separate signal from noise, advanced measurement techniques like counterfactual analysis are often organizationally unloved and actively resisted.
Why Companies Hate Counterfactuals
As one industry data scientist noted, executives who have already used an A/B test to justify shipping a feature do not want to fund or run a counterfactual analysis three to six months later 32. There is a high statistical likelihood that a retrospective counterfactual test will show a much smaller effect size than the original test due to regression to the mean, unaccounted system interactions, or the realization that the initial experiment was a statistical fluke 32.
Because organizations generally dislike discovering that their past decisions did not work out the way they confidently claimed, they actively avoid tests that might disrupt the decorative metrics they have already placed on their performance reviews 32. A counterfactual analysis feels like redoing old work, and telling leadership that a celebrated launch actually had zero causal impact is a politically dangerous move 32. Therefore, genuine causal analysis sits in a very peculiar, marginalized position in the corporate data toolbox.
The Misapplication of Metrics
Metrics also devolve into decoration when the wrong type of measurement is applied at the wrong stage of a project's lifecycle, forcing decision-makers to contort reality to fit the spreadsheet.
A classic example is the evaluation of early-stage corporate innovation. Applying rigid financial metrics - such as Net Present Value (NPV), Return on Sales, or a traditional Product Vitality Index (PVI) - to early-stage innovations will almost universally stifle development 38. If a management team attempts to judge a nascent, unproven product using the same mature metrics as an established cash cow, the innovation will fail the test, often earning these financial metrics the moniker of "innovation killers" 38.
To bridge this gap during the transition phase between the "garage" (R&D) and the "highway" (core business), some analysts suggest using activity metrics, such as the "number of prototypes created" or "number of customer interviews conducted" 38. However, extreme caution is required. While activity metrics show initial momentum, they can easily devolve into vanity metrics that create the false impression that value is being added just because employees are busy 38. Therefore, early-stage activity metrics must transition rapidly into actionable indicators of genuine product-market fit to ensure the project is viable and not just a drain on resources 38.
Similarly, metrics fail when they attempt to measure human behavior without accounting for social dynamics. In a Harvard Business School case study analyzing a division of Hewlett-Packard in San Diego, management attempted to implement a pay-for-performance metric system based on peer evaluations within teams 18. The system was intended to drive productivity, but instead, it caused massive internal friction. Team members found it impossible to objectively judge their peers, tempers flared, and negative evaluations were dismissed as the result of a "bad system" rather than poor performance 18. The metrics did not drive better work; they merely created hostility and were eventually scrapped 18.
Cultivating Strong Metric Hygiene
To sustain a genuinely decision-driven culture and guard against the encroachment of vanity metrics, an organization must treat its reporting systems as an ecosystem requiring constant, ruthless maintenance 31.
Balancing Leading and Lagging Indicators
First, metrics should be strictly categorized into diagnostic (lagging) indicators and prognostic (leading) indicators. Lagging indicators measure outputs that have already happened, such as total quarterly revenue or historical churn 31. While necessary for accounting and high-level reporting, they are functionally useless for daily operational management because they are 100% diagnostic - by the time the metric drops, the damage is already done 31.
Leading indicators, on the other hand, track the inputs and daily activities that will likely produce those outcomes in the future 31. For example, "qualified lead velocity" or "demo request conversion rates" are leading indicators of future sales 31. According to analytics experts, a useful, decision-driving dashboard should ideally be weighted to be roughly 20% diagnostic and 80% prognostic 31.
How to Hunt Down "Zombie KPIs"
Second, metrics must be allowed to "die." Corporate dashboards frequently mutate into massive data graveyards, displaying legacy metrics that no longer influence strategy but are kept alive simply because they have always been measured 31.
To maintain metric hygiene, leaders should routinely evaluate their dashboards using a "Zombie KPI" checklist. If a metric meets any of the following criteria, it is functioning solely as decoration and should be retired immediately 31: * The metric has flatlined for more than two quarters with no meaningful variation 31. * No one can identify a specific, concrete decision that was made based on this metric in the last 90 days 31. * The metric does not directly influence a key result in any of the organization's current strategic objectives or OKRs 31. * Team members cannot clearly articulate the "so what?" of the metric and its specific business impact 31.
By enforcing these constraints, organizations ensure that every pixel on a screen earns its place by serving a clear and direct decision-making purpose 31.
Bottom line
Metrics transform from powerful decision-driving tools into decorative theater when they are used to post-hoc rationalize pre-existing biases, lack rigorous causal grounding, or are weaponized as organizational targets. To harness the true value of data, organizations must reject the comforting dopamine of vanity metrics and implement a decision-driven framework that works backward from specific strategic choices rather than forward from whatever data is available. While perfect foresight is impossible and human intuition will always play a role, subjecting data to strict actionability, counterfactual, and target-resistance tests ensures that analytics illuminate the path forward rather than merely polishing the past.